

Key Insights
The global autonomous taxi market is poised for significant expansion, driven by technological innovation, urban densification, and the escalating demand for efficient mobility. The market is projected to witness a Compound Annual Growth Rate (CAGR) of 99.1%, reaching an estimated market size of $0.61 billion by the base year, 2025. This growth is fueled by the widespread adoption of autonomous vehicles (AVs) across diverse applications. Key market segments include service type (rental-based, station-based), autonomy level (partial to full autonomy), propulsion systems (electric, hybrid, fuel cell), vehicle types (cars, vans/shuttles), and applications (passenger and goods transportation). Leading entities such as Waymo, Cruise, Baidu, and Didi Chuxing are spearheading advancements through substantial R&D investments, strategic alliances, and pilot programs. North America and Asia, particularly the US and China, are anticipated to lead growth due to robust infrastructure development and supportive regulatory environments. Nonetheless, the market faces challenges including regulatory complexities, safety considerations, public adoption, and high upfront AV technology costs, which must be addressed to fully unlock the sector's potential.
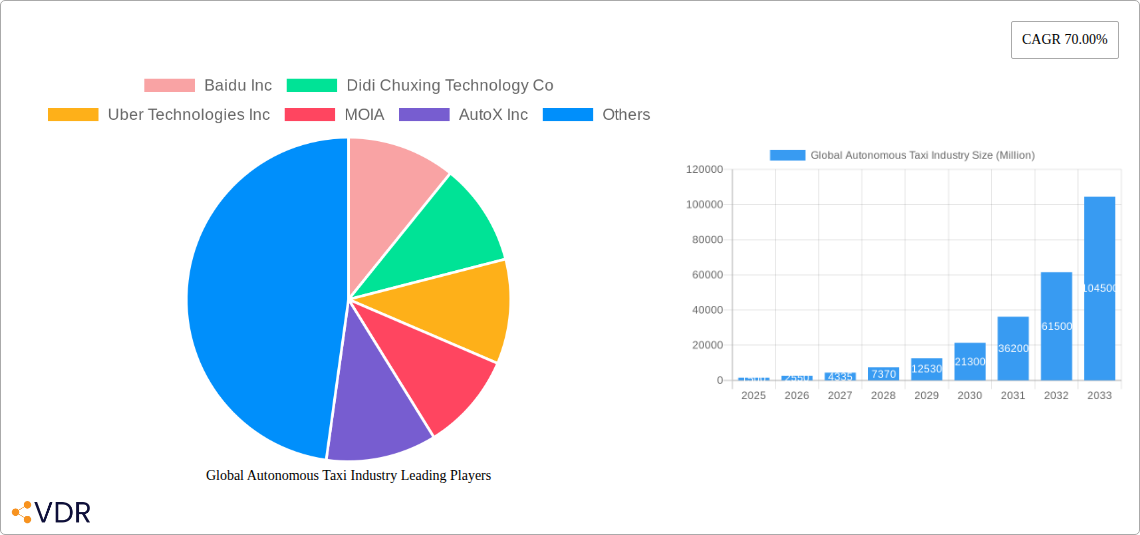
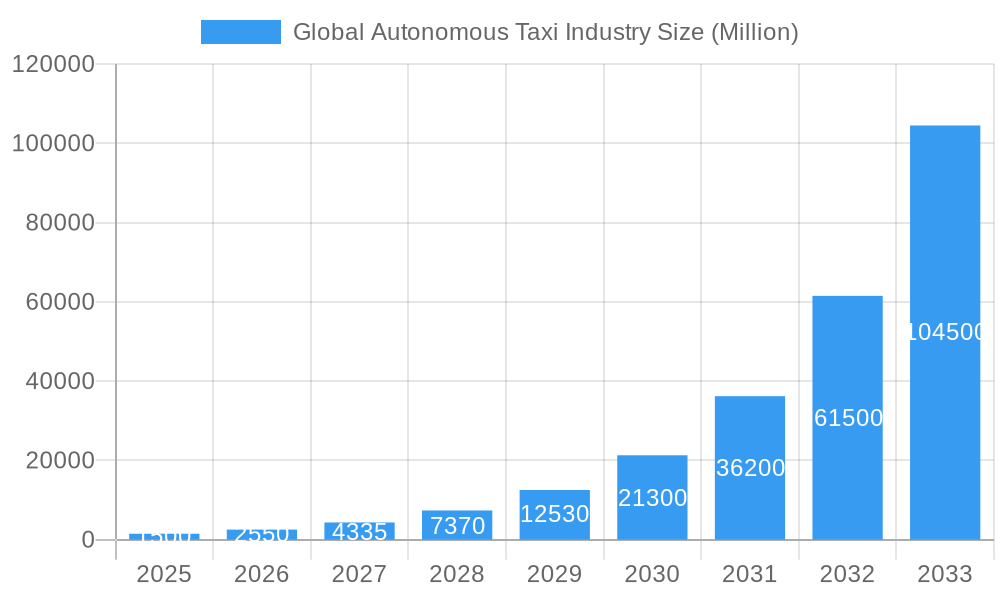
Global Autonomous Taxi Industry Market Size (In Million)
The forecast period (2025-2033) projects sustained market evolution, propelled by breakthroughs in sensor technology, artificial intelligence, and cybersecurity. Enhanced integration of autonomous taxis with smart city frameworks and the development of advanced data management systems will further accelerate growth. The burgeoning mobility-as-a-service (MaaS) sector is also expected to synergize with the autonomous taxi market, fostering novel business models and expanded opportunities. Despite existing challenges, the long-term trajectory for the autonomous taxi market is highly optimistic, promising to revolutionize urban transportation and logistics within the next decade. Consistent innovation, well-defined regulatory pathways, and cultivated consumer trust will be critical success factors.
Global Autonomous Taxi Industry Company Market Share
Global Autonomous Taxi Industry Market Report: 2019-2033
This comprehensive report provides an in-depth analysis of the global autonomous taxi industry, encompassing market dynamics, growth trends, key players, and future outlook. The study period covers 2019-2033, with a base year of 2025 and a forecast period of 2025-2033. The report segments the market by service type (rental-based, station-based), level of autonomy (Level 3, Level 4 & above), propulsion (electric vehicles, hybrid vehicles, fuel cell electric vehicles), vehicle type (car, van/shuttle), and application (passenger transportation, goods transportation). It examines the parent market of autonomous vehicles and the child market of autonomous taxi services, offering granular insights into this rapidly evolving sector.
Global Autonomous Taxi Industry Market Dynamics & Structure
This section analyzes the competitive landscape, technological advancements, regulatory influences, and market trends within the autonomous taxi industry. The market is characterized by intense competition among established players and emerging startups. Market concentration is currently moderate, with a few dominant players holding significant market share, but fragmentation is expected to increase with new entrants.
Market Concentration: The top 5 players are estimated to hold xx% of the global market share in 2025.
Technological Innovation Drivers: Advancements in AI, sensor technology (LiDAR, radar, cameras), and high-definition mapping are crucial drivers. The development of robust and reliable autonomous driving systems is paramount.
Regulatory Frameworks: Varying regulations across different geographies significantly impact market adoption and deployment strategies. Stringent safety standards and liability issues present considerable challenges.
Competitive Product Substitutes: Traditional taxi services and ride-sharing platforms represent the primary substitutes, but the superior efficiency and potential cost-effectiveness of autonomous taxis pose a strong threat.
End-User Demographics: Urban populations with high disposable income and a preference for convenient transportation are the primary target demographic. Accessibility for diverse populations is also a growing focus.
M&A Trends: The sector has witnessed numerous mergers and acquisitions, with an estimated xx million USD worth of deals closed between 2019 and 2024. Strategic partnerships and collaborations are also increasing to accelerate technological development and market expansion.
- Innovation Barriers include high R&D costs, complex software development, and ethical considerations surrounding autonomous decision-making.
- Market entry barriers involve significant capital investment, stringent regulatory approvals, and the need for robust safety certifications.
Global Autonomous Taxi Industry Growth Trends & Insights
The global autonomous taxi market is poised for significant growth, driven by factors such as increasing urbanization, rising demand for convenient transportation, and advancements in autonomous driving technology. The market size is projected to reach xx million units by 2033, exhibiting a CAGR of xx% during the forecast period. Adoption rates are expected to increase steadily as public trust in the technology grows and regulatory frameworks mature. Technological disruptions, such as the development of more advanced sensor technologies and improved AI algorithms, will continue to fuel market expansion. Consumer behavior shifts towards on-demand mobility services and a growing preference for contactless transportation will drive demand. Early adoption is concentrated in major metropolitan areas with supportive regulatory environments.
Dominant Regions, Countries, or Segments in Global Autonomous Taxi Industry
North America and Europe currently lead the global autonomous taxi market, driven by supportive regulatory environments, robust technological infrastructure, and significant investments in R&D. However, Asia-Pacific is projected to exhibit the highest growth rate during the forecast period, fueled by rapid urbanization and increasing adoption of ride-hailing services.
Dominant Segments:
- By Service Type: Rental-based services are expected to hold a larger market share initially, followed by a gradual increase in station-based services as infrastructure develops.
- By Level of Autonomy: Level 4 autonomous vehicles are projected to dominate the market in the long term due to their potential for higher efficiency and safety.
- By Propulsion: Electric vehicles are expected to be the dominant propulsion type due to environmental concerns and government incentives.
- By Vehicle: Cars will maintain a significant share, but van/shuttle services will also experience growth in public transportation and goods transportation applications.
- By Application: Passenger transportation will constitute the primary application, but goods transportation will also show considerable growth, particularly in last-mile delivery.
Key Drivers:
- Government support for autonomous vehicle development through funding and regulatory frameworks.
- Investment from both public and private sectors.
- Technological advancements enabling higher levels of automation and safety.
- Growing demand for efficient and convenient transportation.
Global Autonomous Taxi Industry Product Landscape
The autonomous taxi product landscape is characterized by a diverse range of vehicles and technological solutions, ranging from fully autonomous robotaxis to driver-assisted systems. Key features include advanced sensor suites, sophisticated AI algorithms for navigation and decision-making, and robust communication systems for fleet management and passenger interaction. Unique selling propositions include enhanced safety, improved efficiency, and reduced environmental impact. The market is witnessing continuous innovation in areas such as sensor technology, AI algorithms, and cybersecurity, driving improved performance and reliability.
Key Drivers, Barriers & Challenges in Global Autonomous Taxi Industry
Key Drivers:
- Technological advancements in AI, sensor technology, and mapping.
- Rising demand for efficient and sustainable transportation solutions.
- Government support and incentives for autonomous vehicle development.
Challenges and Restraints:
- High initial investment costs for technology development and infrastructure deployment.
- Regulatory uncertainties and liability concerns.
- Public perception and safety concerns regarding autonomous vehicles.
- Cybersecurity vulnerabilities and potential for hacking.
- Ethical considerations surrounding decision-making in critical situations.
Emerging Opportunities in Global Autonomous Taxi Industry
- Expansion into underserved markets with limited public transportation options.
- Development of integrated mobility solutions, combining autonomous taxis with other transportation modes.
- Growth in autonomous goods transportation applications, such as last-mile delivery.
- Customization of autonomous taxi services to cater to specific user needs and preferences.
Growth Accelerators in the Global Autonomous Taxi Industry Industry
The continued development of advanced AI, sensor technology, and high-definition mapping systems will accelerate market growth. Strategic partnerships between technology companies, automotive manufacturers, and ride-hailing platforms will enable the rapid scaling of autonomous taxi services. Government policies supporting the adoption of autonomous vehicles and the development of necessary infrastructure will play a critical role in driving widespread market adoption.
Key Players Shaping the Global Autonomous Taxi Industry Market
- Baidu Inc
- Didi Chuxing Technology Co
- Uber Technologies Inc
- MOIA (Part of Volkswagen Group)
- AutoX Inc
- GM Cruise
- Tesla Inc
- Waymo LLC
- APTIV PLC
- EasyMile
- NAVYA SA
- AB Volvo
- ZF Friedrichshafen AG
Notable Milestones in Global Autonomous Taxi Industry Sector
- May 2021: Agro AI introduced a new Lidar Sensor with 400-meter range and high-resolution photorealistic quality.
- December 2021: AutoX Inc. opened a production facility in China for Level 4 robotaxis.
- August 2022: Waymo LLC launched features enhancing accessibility for passengers with visual impairments.
In-Depth Global Autonomous Taxi Industry Market Outlook
The future of the autonomous taxi industry is bright, with significant growth potential driven by technological advancements, increasing consumer adoption, and supportive government policies. Strategic partnerships and investments will be crucial in accelerating market penetration. The focus will shift towards enhancing safety, reliability, and scalability, as well as addressing ethical concerns and ensuring equitable access. The market will witness further consolidation, with larger players acquiring smaller companies to gain a competitive edge. The development of sustainable and cost-effective autonomous taxi solutions will play a key role in shaping the long-term growth trajectory of the industry.
Global Autonomous Taxi Industry Segmentation
-
1. Level of Autonomy
- 1.1. Level 4
- 1.2. Level 5
-
2. Propulsion
- 2.1. Electric Vehicles
- 2.2. Hybrid Vehicles
- 2.3. Fuel Cell Electric Vehicles
-
3. Vehicle
- 3.1. Car
- 3.2. Van/Shuttle
-
4. Application
- 4.1. Passenger Transportation
- 4.2. Goods Transportation
-
5. Service Type
- 5.1. Rental-Based
- 5.2. Station-Based
Global Autonomous Taxi Industry Segmentation By Geography
-
1. North America
- 1.1. United States
- 1.2. Canada
- 1.3. Rest of North America
-
2. Europe
- 2.1. Germany
- 2.2. United Kingdom
- 2.3. France
- 2.4. Italy
- 2.5. Spain
- 2.6. Rest of Europe
-
3. Asia Pacific
- 3.1. China
- 3.2. Japan
- 3.3. India
- 3.4. Rest of Asia Pacific
-
4. Rest of the World
- 4.1. South America
- 4.2. Middle East and Africa
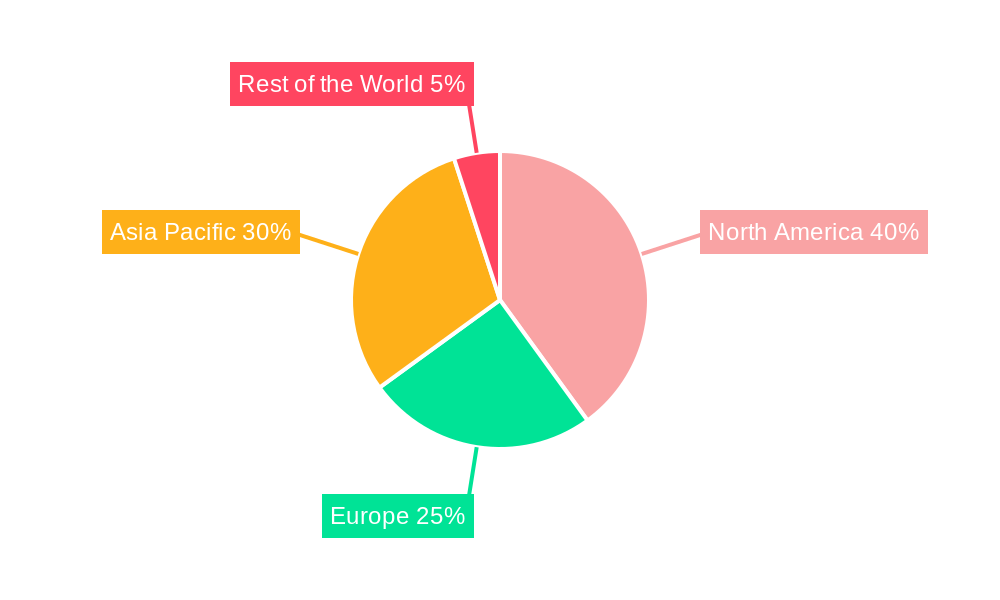
Global Autonomous Taxi Industry Regional Market Share
Geographic Coverage of Global Autonomous Taxi Industry
Global Autonomous Taxi Industry REPORT HIGHLIGHTS
| Aspects | Details |
|---|---|
| Study Period | 2020-2034 |
| Base Year | 2025 |
| Estimated Year | 2026 |
| Forecast Period | 2026-2034 |
| Historical Period | 2020-2025 |
| Growth Rate | CAGR of 99.1% from 2020-2034 |
| Segmentation |
|
Table of Contents
- 1. Introduction
- 1.1. Research Scope
- 1.2. Market Segmentation
- 1.3. Research Objective
- 1.4. Definitions and Assumptions
- 2. Executive Summary
- 2.1. Market Snapshot
- 3. Market Dynamics
- 3.1. Market Drivers
- 3.2. Market Restrains
- 3.3. Market Trends
- 3.4. Market Opportunities
- 4. Market Factor Analysis
- 4.1. Porters Five Forces
- 4.1.1. Bargaining Power of Suppliers
- 4.1.2. Bargaining Power of Buyers
- 4.1.3. Threat of New Entrants
- 4.1.4. Threat of Substitutes
- 4.1.5. Competitive Rivalry
- 4.2. PESTEL analysis
- 4.3. BCG Analysis
- 4.3.1. Stars (High Growth, High Market Share)
- 4.3.2. Cash Cows (Low Growth, High Market Share)
- 4.3.3. Question Mark (High Growth, Low Market Share)
- 4.3.4. Dogs (Low Growth, Low Market Share)
- 4.4. Ansoff Matrix Analysis
- 4.5. Supply Chain Analysis
- 4.6. Regulatory Landscape
- 4.7. Current Market Potential and Opportunity Assessment (TAM–SAM–SOM Framework)
- 4.8. VDR Analyst Note
- 4.1. Porters Five Forces
- 5. Market Analysis, Insights and Forecast 2021-2033
- 5.1. Market Analysis, Insights and Forecast - by Level of Autonomy
- 5.1.1. Level 4
- 5.1.2. Level 5
- 5.2. Market Analysis, Insights and Forecast - by Propulsion
- 5.2.1. Electric Vehicles
- 5.2.2. Hybrid Vehicles
- 5.2.3. Fuel Cell Electric Vehicles
- 5.3. Market Analysis, Insights and Forecast - by Vehicle
- 5.3.1. Car
- 5.3.2. Van/Shuttle
- 5.4. Market Analysis, Insights and Forecast - by Application
- 5.4.1. Passenger Transportation
- 5.4.2. Goods Transportation
- 5.5. Market Analysis, Insights and Forecast - by Service Type
- 5.5.1. Rental-Based
- 5.5.2. Station-Based
- 5.6. Market Analysis, Insights and Forecast - by Region
- 5.6.1. North America
- 5.6.2. Europe
- 5.6.3. Asia Pacific
- 5.6.4. Rest of the World
- 5.1. Market Analysis, Insights and Forecast - by Level of Autonomy
- 6. Global Autonomous Taxi Industry Analysis, Insights and Forecast, 2021-2033
- 6.1. Market Analysis, Insights and Forecast - by Level of Autonomy
- 6.1.1. Level 4
- 6.1.2. Level 5
- 6.2. Market Analysis, Insights and Forecast - by Propulsion
- 6.2.1. Electric Vehicles
- 6.2.2. Hybrid Vehicles
- 6.2.3. Fuel Cell Electric Vehicles
- 6.3. Market Analysis, Insights and Forecast - by Vehicle
- 6.3.1. Car
- 6.3.2. Van/Shuttle
- 6.4. Market Analysis, Insights and Forecast - by Application
- 6.4.1. Passenger Transportation
- 6.4.2. Goods Transportation
- 6.5. Market Analysis, Insights and Forecast - by Service Type
- 6.5.1. Rental-Based
- 6.5.2. Station-Based
- 6.1. Market Analysis, Insights and Forecast - by Level of Autonomy
- 7. North America Global Autonomous Taxi Industry Analysis, Insights and Forecast, 2021-2033
- 7.1. Market Analysis, Insights and Forecast - by Level of Autonomy
- 7.1.1. Level 4
- 7.1.2. Level 5
- 7.2. Market Analysis, Insights and Forecast - by Propulsion
- 7.2.1. Electric Vehicles
- 7.2.2. Hybrid Vehicles
- 7.2.3. Fuel Cell Electric Vehicles
- 7.3. Market Analysis, Insights and Forecast - by Vehicle
- 7.3.1. Car
- 7.3.2. Van/Shuttle
- 7.4. Market Analysis, Insights and Forecast - by Application
- 7.4.1. Passenger Transportation
- 7.4.2. Goods Transportation
- 7.5. Market Analysis, Insights and Forecast - by Service Type
- 7.5.1. Rental-Based
- 7.5.2. Station-Based
- 7.1. Market Analysis, Insights and Forecast - by Level of Autonomy
- 8. Europe Global Autonomous Taxi Industry Analysis, Insights and Forecast, 2021-2033
- 8.1. Market Analysis, Insights and Forecast - by Level of Autonomy
- 8.1.1. Level 4
- 8.1.2. Level 5
- 8.2. Market Analysis, Insights and Forecast - by Propulsion
- 8.2.1. Electric Vehicles
- 8.2.2. Hybrid Vehicles
- 8.2.3. Fuel Cell Electric Vehicles
- 8.3. Market Analysis, Insights and Forecast - by Vehicle
- 8.3.1. Car
- 8.3.2. Van/Shuttle
- 8.4. Market Analysis, Insights and Forecast - by Application
- 8.4.1. Passenger Transportation
- 8.4.2. Goods Transportation
- 8.5. Market Analysis, Insights and Forecast - by Service Type
- 8.5.1. Rental-Based
- 8.5.2. Station-Based
- 8.1. Market Analysis, Insights and Forecast - by Level of Autonomy
- 9. Asia Pacific Global Autonomous Taxi Industry Analysis, Insights and Forecast, 2021-2033
- 9.1. Market Analysis, Insights and Forecast - by Level of Autonomy
- 9.1.1. Level 4
- 9.1.2. Level 5
- 9.2. Market Analysis, Insights and Forecast - by Propulsion
- 9.2.1. Electric Vehicles
- 9.2.2. Hybrid Vehicles
- 9.2.3. Fuel Cell Electric Vehicles
- 9.3. Market Analysis, Insights and Forecast - by Vehicle
- 9.3.1. Car
- 9.3.2. Van/Shuttle
- 9.4. Market Analysis, Insights and Forecast - by Application
- 9.4.1. Passenger Transportation
- 9.4.2. Goods Transportation
- 9.5. Market Analysis, Insights and Forecast - by Service Type
- 9.5.1. Rental-Based
- 9.5.2. Station-Based
- 9.1. Market Analysis, Insights and Forecast - by Level of Autonomy
- 10. Rest of the World Global Autonomous Taxi Industry Analysis, Insights and Forecast, 2021-2033
- 10.1. Market Analysis, Insights and Forecast - by Level of Autonomy
- 10.1.1. Level 4
- 10.1.2. Level 5
- 10.2. Market Analysis, Insights and Forecast - by Propulsion
- 10.2.1. Electric Vehicles
- 10.2.2. Hybrid Vehicles
- 10.2.3. Fuel Cell Electric Vehicles
- 10.3. Market Analysis, Insights and Forecast - by Vehicle
- 10.3.1. Car
- 10.3.2. Van/Shuttle
- 10.4. Market Analysis, Insights and Forecast - by Application
- 10.4.1. Passenger Transportation
- 10.4.2. Goods Transportation
- 10.5. Market Analysis, Insights and Forecast - by Service Type
- 10.5.1. Rental-Based
- 10.5.2. Station-Based
- 10.1. Market Analysis, Insights and Forecast - by Level of Autonomy
- 11. Competitive Analysis
- 11.1. Company Profiles
- 11.1.1 Baidu Inc
- 11.1.1.1. Company Overview
- 11.1.1.2. Products
- 11.1.1.3. Company Financials
- 11.1.1.4. SWOT Analysis
- 11.1.2 Didi Chuxing Technology Co
- 11.1.2.1. Company Overview
- 11.1.2.2. Products
- 11.1.2.3. Company Financials
- 11.1.2.4. SWOT Analysis
- 11.1.3 Uber Technologies Inc
- 11.1.3.1. Company Overview
- 11.1.3.2. Products
- 11.1.3.3. Company Financials
- 11.1.3.4. SWOT Analysis
- 11.1.4 MOIA
- 11.1.4.1. Company Overview
- 11.1.4.2. Products
- 11.1.4.3. Company Financials
- 11.1.4.4. SWOT Analysis
- 11.1.5 AutoX Inc
- 11.1.5.1. Company Overview
- 11.1.5.2. Products
- 11.1.5.3. Company Financials
- 11.1.5.4. SWOT Analysis
- 11.1.6 GM Cruise
- 11.1.6.1. Company Overview
- 11.1.6.2. Products
- 11.1.6.3. Company Financials
- 11.1.6.4. SWOT Analysis
- 11.1.7 Tesla Inc *List Not Exhaustive
- 11.1.7.1. Company Overview
- 11.1.7.2. Products
- 11.1.7.3. Company Financials
- 11.1.7.4. SWOT Analysis
- 11.1.8 Waymo LLC
- 11.1.8.1. Company Overview
- 11.1.8.2. Products
- 11.1.8.3. Company Financials
- 11.1.8.4. SWOT Analysis
- 11.1.9 APTIV PLC
- 11.1.9.1. Company Overview
- 11.1.9.2. Products
- 11.1.9.3. Company Financials
- 11.1.9.4. SWOT Analysis
- 11.1.10 EasyMile
- 11.1.10.1. Company Overview
- 11.1.10.2. Products
- 11.1.10.3. Company Financials
- 11.1.10.4. SWOT Analysis
- 11.1.11 NAVYA SA
- 11.1.11.1. Company Overview
- 11.1.11.2. Products
- 11.1.11.3. Company Financials
- 11.1.11.4. SWOT Analysis
- 11.1.12 AB Volvo
- 11.1.12.1. Company Overview
- 11.1.12.2. Products
- 11.1.12.3. Company Financials
- 11.1.12.4. SWOT Analysis
- 11.1.13 ZF Friedrichshafen AG
- 11.1.13.1. Company Overview
- 11.1.13.2. Products
- 11.1.13.3. Company Financials
- 11.1.13.4. SWOT Analysis
- 11.1.1 Baidu Inc
- 11.2. Market Entropy
- 11.2.1 Company's Key Areas Served
- 11.2.2 Recent Developments
- 11.3. Company Market Share Analysis 2025
- 11.3.1 Top 5 Companies Market Share Analysis
- 11.3.2 Top 3 Companies Market Share Analysis
- 11.4. List of Potential Customers
- 12. Research Methodology
List of Figures
- Figure 1: Global Global Autonomous Taxi Industry Revenue Breakdown (billion, %) by Region 2025 & 2033
- Figure 2: North America Global Autonomous Taxi Industry Revenue (billion), by Level of Autonomy 2025 & 2033
- Figure 3: North America Global Autonomous Taxi Industry Revenue Share (%), by Level of Autonomy 2025 & 2033
- Figure 4: North America Global Autonomous Taxi Industry Revenue (billion), by Propulsion 2025 & 2033
- Figure 5: North America Global Autonomous Taxi Industry Revenue Share (%), by Propulsion 2025 & 2033
- Figure 6: North America Global Autonomous Taxi Industry Revenue (billion), by Vehicle 2025 & 2033
- Figure 7: North America Global Autonomous Taxi Industry Revenue Share (%), by Vehicle 2025 & 2033
- Figure 8: North America Global Autonomous Taxi Industry Revenue (billion), by Application 2025 & 2033
- Figure 9: North America Global Autonomous Taxi Industry Revenue Share (%), by Application 2025 & 2033
- Figure 10: North America Global Autonomous Taxi Industry Revenue (billion), by Service Type 2025 & 2033
- Figure 11: North America Global Autonomous Taxi Industry Revenue Share (%), by Service Type 2025 & 2033
- Figure 12: North America Global Autonomous Taxi Industry Revenue (billion), by Country 2025 & 2033
- Figure 13: North America Global Autonomous Taxi Industry Revenue Share (%), by Country 2025 & 2033
- Figure 14: Europe Global Autonomous Taxi Industry Revenue (billion), by Level of Autonomy 2025 & 2033
- Figure 15: Europe Global Autonomous Taxi Industry Revenue Share (%), by Level of Autonomy 2025 & 2033
- Figure 16: Europe Global Autonomous Taxi Industry Revenue (billion), by Propulsion 2025 & 2033
- Figure 17: Europe Global Autonomous Taxi Industry Revenue Share (%), by Propulsion 2025 & 2033
- Figure 18: Europe Global Autonomous Taxi Industry Revenue (billion), by Vehicle 2025 & 2033
- Figure 19: Europe Global Autonomous Taxi Industry Revenue Share (%), by Vehicle 2025 & 2033
- Figure 20: Europe Global Autonomous Taxi Industry Revenue (billion), by Application 2025 & 2033
- Figure 21: Europe Global Autonomous Taxi Industry Revenue Share (%), by Application 2025 & 2033
- Figure 22: Europe Global Autonomous Taxi Industry Revenue (billion), by Service Type 2025 & 2033
- Figure 23: Europe Global Autonomous Taxi Industry Revenue Share (%), by Service Type 2025 & 2033
- Figure 24: Europe Global Autonomous Taxi Industry Revenue (billion), by Country 2025 & 2033
- Figure 25: Europe Global Autonomous Taxi Industry Revenue Share (%), by Country 2025 & 2033
- Figure 26: Asia Pacific Global Autonomous Taxi Industry Revenue (billion), by Level of Autonomy 2025 & 2033
- Figure 27: Asia Pacific Global Autonomous Taxi Industry Revenue Share (%), by Level of Autonomy 2025 & 2033
- Figure 28: Asia Pacific Global Autonomous Taxi Industry Revenue (billion), by Propulsion 2025 & 2033
- Figure 29: Asia Pacific Global Autonomous Taxi Industry Revenue Share (%), by Propulsion 2025 & 2033
- Figure 30: Asia Pacific Global Autonomous Taxi Industry Revenue (billion), by Vehicle 2025 & 2033
- Figure 31: Asia Pacific Global Autonomous Taxi Industry Revenue Share (%), by Vehicle 2025 & 2033
- Figure 32: Asia Pacific Global Autonomous Taxi Industry Revenue (billion), by Application 2025 & 2033
- Figure 33: Asia Pacific Global Autonomous Taxi Industry Revenue Share (%), by Application 2025 & 2033
- Figure 34: Asia Pacific Global Autonomous Taxi Industry Revenue (billion), by Service Type 2025 & 2033
- Figure 35: Asia Pacific Global Autonomous Taxi Industry Revenue Share (%), by Service Type 2025 & 2033
- Figure 36: Asia Pacific Global Autonomous Taxi Industry Revenue (billion), by Country 2025 & 2033
- Figure 37: Asia Pacific Global Autonomous Taxi Industry Revenue Share (%), by Country 2025 & 2033
- Figure 38: Rest of the World Global Autonomous Taxi Industry Revenue (billion), by Level of Autonomy 2025 & 2033
- Figure 39: Rest of the World Global Autonomous Taxi Industry Revenue Share (%), by Level of Autonomy 2025 & 2033
- Figure 40: Rest of the World Global Autonomous Taxi Industry Revenue (billion), by Propulsion 2025 & 2033
- Figure 41: Rest of the World Global Autonomous Taxi Industry Revenue Share (%), by Propulsion 2025 & 2033
- Figure 42: Rest of the World Global Autonomous Taxi Industry Revenue (billion), by Vehicle 2025 & 2033
- Figure 43: Rest of the World Global Autonomous Taxi Industry Revenue Share (%), by Vehicle 2025 & 2033
- Figure 44: Rest of the World Global Autonomous Taxi Industry Revenue (billion), by Application 2025 & 2033
- Figure 45: Rest of the World Global Autonomous Taxi Industry Revenue Share (%), by Application 2025 & 2033
- Figure 46: Rest of the World Global Autonomous Taxi Industry Revenue (billion), by Service Type 2025 & 2033
- Figure 47: Rest of the World Global Autonomous Taxi Industry Revenue Share (%), by Service Type 2025 & 2033
- Figure 48: Rest of the World Global Autonomous Taxi Industry Revenue (billion), by Country 2025 & 2033
- Figure 49: Rest of the World Global Autonomous Taxi Industry Revenue Share (%), by Country 2025 & 2033
List of Tables
- Table 1: Global Autonomous Taxi Industry Revenue billion Forecast, by Level of Autonomy 2020 & 2033
- Table 2: Global Autonomous Taxi Industry Revenue billion Forecast, by Propulsion 2020 & 2033
- Table 3: Global Autonomous Taxi Industry Revenue billion Forecast, by Vehicle 2020 & 2033
- Table 4: Global Autonomous Taxi Industry Revenue billion Forecast, by Application 2020 & 2033
- Table 5: Global Autonomous Taxi Industry Revenue billion Forecast, by Service Type 2020 & 2033
- Table 6: Global Autonomous Taxi Industry Revenue billion Forecast, by Region 2020 & 2033
- Table 7: Global Autonomous Taxi Industry Revenue billion Forecast, by Level of Autonomy 2020 & 2033
- Table 8: Global Autonomous Taxi Industry Revenue billion Forecast, by Propulsion 2020 & 2033
- Table 9: Global Autonomous Taxi Industry Revenue billion Forecast, by Vehicle 2020 & 2033
- Table 10: Global Autonomous Taxi Industry Revenue billion Forecast, by Application 2020 & 2033
- Table 11: Global Autonomous Taxi Industry Revenue billion Forecast, by Service Type 2020 & 2033
- Table 12: Global Autonomous Taxi Industry Revenue billion Forecast, by Country 2020 & 2033
- Table 13: United States Global Autonomous Taxi Industry Revenue (billion) Forecast, by Application 2020 & 2033
- Table 14: Canada Global Autonomous Taxi Industry Revenue (billion) Forecast, by Application 2020 & 2033
- Table 15: Rest of North America Global Autonomous Taxi Industry Revenue (billion) Forecast, by Application 2020 & 2033
- Table 16: Global Autonomous Taxi Industry Revenue billion Forecast, by Level of Autonomy 2020 & 2033
- Table 17: Global Autonomous Taxi Industry Revenue billion Forecast, by Propulsion 2020 & 2033
- Table 18: Global Autonomous Taxi Industry Revenue billion Forecast, by Vehicle 2020 & 2033
- Table 19: Global Autonomous Taxi Industry Revenue billion Forecast, by Application 2020 & 2033
- Table 20: Global Autonomous Taxi Industry Revenue billion Forecast, by Service Type 2020 & 2033
- Table 21: Global Autonomous Taxi Industry Revenue billion Forecast, by Country 2020 & 2033
- Table 22: Germany Global Autonomous Taxi Industry Revenue (billion) Forecast, by Application 2020 & 2033
- Table 23: United Kingdom Global Autonomous Taxi Industry Revenue (billion) Forecast, by Application 2020 & 2033
- Table 24: France Global Autonomous Taxi Industry Revenue (billion) Forecast, by Application 2020 & 2033
- Table 25: Italy Global Autonomous Taxi Industry Revenue (billion) Forecast, by Application 2020 & 2033
- Table 26: Spain Global Autonomous Taxi Industry Revenue (billion) Forecast, by Application 2020 & 2033
- Table 27: Rest of Europe Global Autonomous Taxi Industry Revenue (billion) Forecast, by Application 2020 & 2033
- Table 28: Global Autonomous Taxi Industry Revenue billion Forecast, by Level of Autonomy 2020 & 2033
- Table 29: Global Autonomous Taxi Industry Revenue billion Forecast, by Propulsion 2020 & 2033
- Table 30: Global Autonomous Taxi Industry Revenue billion Forecast, by Vehicle 2020 & 2033
- Table 31: Global Autonomous Taxi Industry Revenue billion Forecast, by Application 2020 & 2033
- Table 32: Global Autonomous Taxi Industry Revenue billion Forecast, by Service Type 2020 & 2033
- Table 33: Global Autonomous Taxi Industry Revenue billion Forecast, by Country 2020 & 2033
- Table 34: China Global Autonomous Taxi Industry Revenue (billion) Forecast, by Application 2020 & 2033
- Table 35: Japan Global Autonomous Taxi Industry Revenue (billion) Forecast, by Application 2020 & 2033
- Table 36: India Global Autonomous Taxi Industry Revenue (billion) Forecast, by Application 2020 & 2033
- Table 37: Rest of Asia Pacific Global Autonomous Taxi Industry Revenue (billion) Forecast, by Application 2020 & 2033
- Table 38: Global Autonomous Taxi Industry Revenue billion Forecast, by Level of Autonomy 2020 & 2033
- Table 39: Global Autonomous Taxi Industry Revenue billion Forecast, by Propulsion 2020 & 2033
- Table 40: Global Autonomous Taxi Industry Revenue billion Forecast, by Vehicle 2020 & 2033
- Table 41: Global Autonomous Taxi Industry Revenue billion Forecast, by Application 2020 & 2033
- Table 42: Global Autonomous Taxi Industry Revenue billion Forecast, by Service Type 2020 & 2033
- Table 43: Global Autonomous Taxi Industry Revenue billion Forecast, by Country 2020 & 2033
- Table 44: South America Global Autonomous Taxi Industry Revenue (billion) Forecast, by Application 2020 & 2033
- Table 45: Middle East and Africa Global Autonomous Taxi Industry Revenue (billion) Forecast, by Application 2020 & 2033
Frequently Asked Questions
1. What is the projected Compound Annual Growth Rate (CAGR) of the Global Autonomous Taxi Industry?
The projected CAGR is approximately 99.1%.
2. Which companies are prominent players in the Global Autonomous Taxi Industry?
Key companies in the market include Baidu Inc, Didi Chuxing Technology Co, Uber Technologies Inc, MOIA, AutoX Inc, GM Cruise, Tesla Inc *List Not Exhaustive, Waymo LLC, APTIV PLC, EasyMile, NAVYA SA, AB Volvo, ZF Friedrichshafen AG.
3. What are the main segments of the Global Autonomous Taxi Industry?
The market segments include Level of Autonomy, Propulsion, Vehicle, Application, Service Type.
4. Can you provide details about the market size?
The market size is estimated to be USD 0.61 billion as of 2022.
5. What are some drivers contributing to market growth?
Increase in Leisure Activities in the Country.
6. What are the notable trends driving market growth?
Robo-Taxis Are Attracting People Around the World.
7. Are there any restraints impacting market growth?
Strict Vehicle Emission Regulations.
8. Can you provide examples of recent developments in the market?
In August 2022, Waymo LLC introduced new features designed to make its fleet of autonomous taxis more accessible to passengers with visual impairments and other disabilities.
9. What pricing options are available for accessing the report?
Pricing options include single-user, multi-user, and enterprise licenses priced at USD 4750, USD 5250, and USD 8750 respectively.
10. Is the market size provided in terms of value or volume?
The market size is provided in terms of value, measured in billion.
11. Are there any specific market keywords associated with the report?
Yes, the market keyword associated with the report is "Global Autonomous Taxi Industry," which aids in identifying and referencing the specific market segment covered.
12. How do I determine which pricing option suits my needs best?
The pricing options vary based on user requirements and access needs. Individual users may opt for single-user licenses, while businesses requiring broader access may choose multi-user or enterprise licenses for cost-effective access to the report.
13. Are there any additional resources or data provided in the Global Autonomous Taxi Industry report?
While the report offers comprehensive insights, it's advisable to review the specific contents or supplementary materials provided to ascertain if additional resources or data are available.
14. How can I stay updated on further developments or reports in the Global Autonomous Taxi Industry?
To stay informed about further developments, trends, and reports in the Global Autonomous Taxi Industry, consider subscribing to industry newsletters, following relevant companies and organizations, or regularly checking reputable industry news sources and publications.
Methodology
Step 1 - Identification of Relevant Samples Size from Population Database


Step 2 - Approaches for Defining Global Market Size (Value, Volume* & Price*)

Note*: In applicable scenarios
Step 3 - Data Sources
Primary Research
- Web Analytics
- Survey Reports
- Research Institute
- Latest Research Reports
- Opinion Leaders
Secondary Research
- Annual Reports
- White Paper
- Latest Press Release
- Industry Association
- Paid Database
- Investor Presentations

Step 4 - Data Triangulation
Involves using different sources of information in order to increase the validity of a study
These sources are likely to be stakeholders in a program - participants, other researchers, program staff, other community members, and so on.
Then we put all data in single framework & apply various statistical tools to find out the dynamic on the market.
During the analysis stage, feedback from the stakeholder groups would be compared to determine areas of agreement as well as areas of divergence