
Key Insights
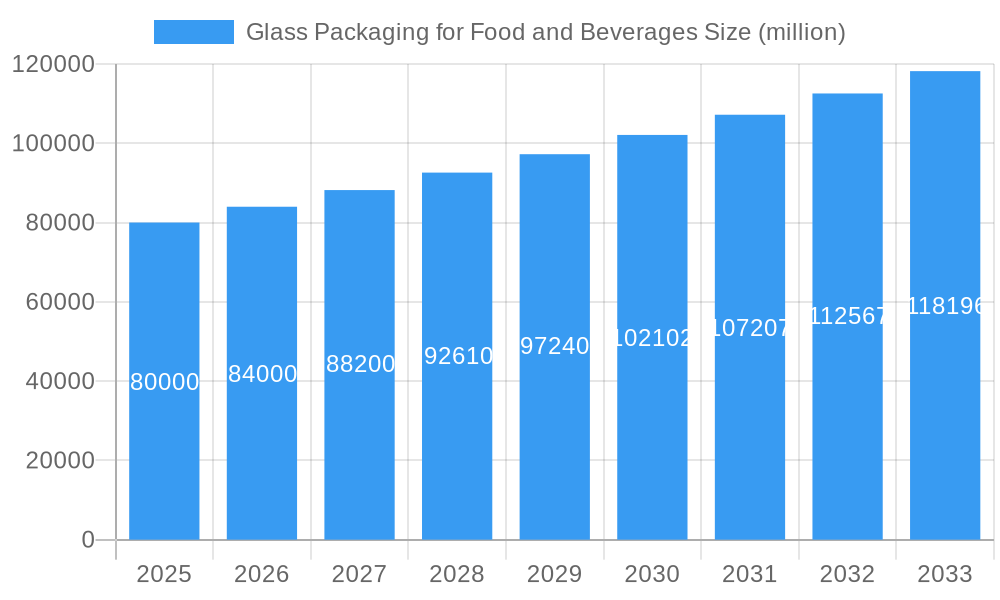
The global market for glass packaging in the food and beverage sector is experiencing robust growth, driven by the increasing consumer preference for sustainable and environmentally friendly packaging solutions. The inherent properties of glass, such as its recyclability, inertness, and ability to preserve product quality and freshness, are key factors fueling this demand. Furthermore, the rising demand for premium and convenient food and beverage products is contributing to the market's expansion, as glass packaging is often associated with higher quality and luxury. We estimate the market size in 2025 to be approximately $80 billion, with a Compound Annual Growth Rate (CAGR) of 5% projected through 2033. This growth is being witnessed across various segments, including bottled water, alcoholic beverages, and processed foods, though growth rates may vary slightly depending on specific product categories and regional trends. Key players like Ardagh Packaging, HNGI, Owens-Illinois, and Saint-Gobain are strategically investing in innovation and capacity expansion to capitalize on this growing market.

Glass Packaging for Food and Beverages Market Size (In Billion)

Despite the positive outlook, the market faces challenges. Fluctuating raw material prices (particularly energy costs associated with glass manufacturing) and increasing transportation costs pose significant restraints. Additionally, the rise of lightweight alternatives like plastic and aluminum, despite their environmental concerns, presents ongoing competitive pressure. However, the burgeoning trend towards sustainable consumption and increasing regulatory pressures to reduce plastic waste are expected to mitigate these challenges, ultimately bolstering the long-term growth of the glass packaging market. Regional variations will exist, with mature markets in North America and Europe showing steady growth, while emerging economies in Asia-Pacific and Latin America present significant potential for future expansion. The focus will increasingly be on innovation within the industry, such as the development of lighter-weight glass containers and improved recycling technologies to further enhance sustainability and reduce costs.
Glass Packaging for Food and Beverages Company Market Share
Glass Packaging for Food and Beverages Market Report: 2019-2033
This comprehensive report provides an in-depth analysis of the global glass packaging market for food and beverages, offering invaluable insights for industry professionals, investors, and strategic decision-makers. The report covers the period 2019-2033, with a focus on the forecast period 2025-2033, utilizing 2025 as the base year. The study analyzes market dynamics, growth trends, regional dominance, product innovations, and key players, including Ardagh Packaging, HNGI, Owens-Illinois, and Saint-Gobain. The report is segmented by various product types and applications within the food and beverage industry, providing a granular understanding of this dynamic market.
Glass Packaging for Food and Beverages Market Dynamics & Structure
This section analyzes the market's competitive landscape, technological advancements, regulatory influences, and market trends. We delve into the factors shaping the market structure, including market concentration, mergers and acquisitions (M&A) activity, and the emergence of substitute packaging materials. The analysis considers both qualitative and quantitative aspects, providing a holistic view of the market dynamics.
- Market Concentration: The market exhibits a moderately concentrated structure with the top four players holding approximately xx% market share in 2025. This is expected to shift slightly by 2033.
- Technological Innovation: Technological advancements in glass manufacturing, including lighter-weight containers and improved coatings, are driving innovation. However, high capital investment acts as a significant barrier to entry for new players.
- Regulatory Framework: Stringent regulations regarding food safety and recyclability are influencing packaging choices, particularly favoring glass due to its inherent inertness and recyclability.
- Competitive Product Substitutes: The primary substitutes for glass packaging are plastic and metal containers. The growing awareness of environmental concerns and the rise of sustainability initiatives are bolstering the demand for glass packaging.
- End-User Demographics: The increasing preference for premium and healthier food and beverage products is driving demand for glass packaging, particularly among health-conscious consumers.
- M&A Trends: The past five years have witnessed xx M&A deals in the glass packaging sector, primarily driven by companies seeking to expand their product portfolio and geographic reach.
Glass Packaging for Food and Beverages Growth Trends & Insights
This section provides a detailed analysis of the market's historical and projected growth trajectory, leveraging econometric modeling and industry-specific data to offer valuable insights. We analyze market size evolution, adoption rates, and consumer behavior shifts influencing market growth.
The global glass packaging market for food and beverages witnessed a CAGR of xx% during the historical period (2019-2024), reaching a market size of xx million units in 2024. The market is projected to exhibit a CAGR of xx% during the forecast period (2025-2033), reaching xx million units by 2033. This growth is primarily attributed to rising consumer demand for premium products, increasing focus on sustainability, and favorable regulatory changes. Technological innovations like lightweight glass packaging and improved manufacturing efficiency are also significantly contributing to the growth.
Dominant Regions, Countries, or Segments in Glass Packaging for Food and Beverages
This section identifies the leading geographic regions and segments driving market growth. We analyze market share and growth potential, considering economic policies, infrastructure development, and consumer preferences.
- North America: This region holds a significant market share due to high consumer spending and strong demand for premium food and beverage products. Factors such as robust infrastructure and established recycling programs further contribute to the region's dominance.
- Europe: Stringent environmental regulations, coupled with increasing consumer awareness of sustainability, are boosting the adoption of glass packaging in Europe.
- Asia-Pacific: This region is experiencing rapid growth due to increasing disposable income, urbanization, and the rising popularity of convenience foods.
The food segment dominates the market due to high demand for glass jars and bottles for preserving food items.
Glass Packaging for Food and Beverages Product Landscape
The glass packaging industry is witnessing continuous innovations in design, material properties, and functionality. Lighter weight bottles and jars are being developed to reduce transportation costs and carbon footprint. Advanced coatings and surface treatments enhance product shelf life and improve the aesthetic appeal of the packaging. These innovations cater to the evolving needs of food and beverage manufacturers and consumers, focusing on sustainability and enhanced user experience.
Key Drivers, Barriers & Challenges in Glass Packaging for Food and Beverages
Key Drivers:
- Increasing consumer preference for sustainable and eco-friendly packaging.
- Growing demand for premium food and beverage products.
- Stringent regulations promoting recyclability and reducing plastic waste.
Key Barriers and Challenges:
- High production costs compared to other packaging materials.
- Fragility of glass, leading to higher breakage rates and transportation costs.
- Fluctuations in raw material prices (e.g., silica sand) impacting profitability.
Emerging Opportunities in Glass Packaging for Food and Beverages
Emerging opportunities include:
- Growth in the premium spirits and wine segments driving demand for sophisticated glass bottles.
- Increasing adoption of glass packaging in emerging markets fueled by rising disposable incomes.
- Development of innovative closures and dispensing systems for glass containers.
Growth Accelerators in the Glass Packaging for Food and Beverages Industry
Technological advancements in manufacturing processes, strategic partnerships to enhance supply chains, and expansion into new geographic markets with high growth potential are key growth accelerators in the industry.
Key Players Shaping the Glass Packaging for Food and Beverages Market
Notable Milestones in Glass Packaging for Food and Beverages Sector
- 2020: Owens-Illinois launches a new lightweight glass bottle design, reducing material usage by 15%.
- 2022: Ardagh Packaging invests in a new glass manufacturing facility in [Location], expanding production capacity.
- 2023: Saint-Gobain introduces a new sustainable glass coating technology to improve product shelf life.
In-Depth Glass Packaging for Food and Beverages Market Outlook
The glass packaging market for food and beverages is poised for robust growth in the coming years, driven by sustainable packaging trends and growing consumer preference for premium products. Strategic investments in R&D, efficient manufacturing processes, and sustainable practices will be crucial for players to capitalize on the emerging opportunities and maintain a competitive edge in this dynamic market.
Glass Packaging for Food and Beverages Segmentation
-
1. Application
- 1.1. Hot Drinks
- 1.2. Packaged Drinks
- 1.3. Milk and Dairy Drinks
- 1.4. CSD
- 1.5. Beer and Cider
- 1.6. Juice Drinks
- 1.7. Iced Tea and Coffee
- 1.8. Spirits
- 1.9. Wine
-
2. Types
- 2.1. Bottles
- 2.2. Vials
- 2.3. Jars
- 2.4. Others
Glass Packaging for Food and Beverages Segmentation By Geography
-
1. North America
- 1.1. United States
- 1.2. Canada
- 1.3. Mexico
-
2. South America
- 2.1. Brazil
- 2.2. Argentina
- 2.3. Rest of South America
-
3. Europe
- 3.1. United Kingdom
- 3.2. Germany
- 3.3. France
- 3.4. Italy
- 3.5. Spain
- 3.6. Russia
- 3.7. Benelux
- 3.8. Nordics
- 3.9. Rest of Europe
-
4. Middle East & Africa
- 4.1. Turkey
- 4.2. Israel
- 4.3. GCC
- 4.4. North Africa
- 4.5. South Africa
- 4.6. Rest of Middle East & Africa
-
5. Asia Pacific
- 5.1. China
- 5.2. India
- 5.3. Japan
- 5.4. South Korea
- 5.5. ASEAN
- 5.6. Oceania
- 5.7. Rest of Asia Pacific

Glass Packaging for Food and Beverages Regional Market Share
Geographic Coverage of Glass Packaging for Food and Beverages
Glass Packaging for Food and Beverages REPORT HIGHLIGHTS
| Aspects | Details |
|---|---|
| Study Period | 2020-2034 |
| Base Year | 2025 |
| Estimated Year | 2026 |
| Forecast Period | 2026-2034 |
| Historical Period | 2020-2025 |
| Growth Rate | CAGR of 3.6% from 2020-2034 |
| Segmentation |
|
Table of Contents
- 1. Introduction
- 1.1. Research Scope
- 1.2. Market Segmentation
- 1.3. Research Methodology
- 1.4. Definitions and Assumptions
- 2. Executive Summary
- 2.1. Introduction
- 3. Market Dynamics
- 3.1. Introduction
- 3.2. Market Drivers
- 3.3. Market Restrains
- 3.4. Market Trends
- 4. Market Factor Analysis
- 4.1. Porters Five Forces
- 4.2. Supply/Value Chain
- 4.3. PESTEL analysis
- 4.4. Market Entropy
- 4.5. Patent/Trademark Analysis
- 5. Global Glass Packaging for Food and Beverages Analysis, Insights and Forecast, 2020-2032
- 5.1. Market Analysis, Insights and Forecast - by Application
- 5.1.1. Hot Drinks
- 5.1.2. Packaged Drinks
- 5.1.3. Milk and Dairy Drinks
- 5.1.4. CSD
- 5.1.5. Beer and Cider
- 5.1.6. Juice Drinks
- 5.1.7. Iced Tea and Coffee
- 5.1.8. Spirits
- 5.1.9. Wine
- 5.2. Market Analysis, Insights and Forecast - by Types
- 5.2.1. Bottles
- 5.2.2. Vials
- 5.2.3. Jars
- 5.2.4. Others
- 5.3. Market Analysis, Insights and Forecast - by Region
- 5.3.1. North America
- 5.3.2. South America
- 5.3.3. Europe
- 5.3.4. Middle East & Africa
- 5.3.5. Asia Pacific
- 5.1. Market Analysis, Insights and Forecast - by Application
- 6. North America Glass Packaging for Food and Beverages Analysis, Insights and Forecast, 2020-2032
- 6.1. Market Analysis, Insights and Forecast - by Application
- 6.1.1. Hot Drinks
- 6.1.2. Packaged Drinks
- 6.1.3. Milk and Dairy Drinks
- 6.1.4. CSD
- 6.1.5. Beer and Cider
- 6.1.6. Juice Drinks
- 6.1.7. Iced Tea and Coffee
- 6.1.8. Spirits
- 6.1.9. Wine
- 6.2. Market Analysis, Insights and Forecast - by Types
- 6.2.1. Bottles
- 6.2.2. Vials
- 6.2.3. Jars
- 6.2.4. Others
- 6.1. Market Analysis, Insights and Forecast - by Application
- 7. South America Glass Packaging for Food and Beverages Analysis, Insights and Forecast, 2020-2032
- 7.1. Market Analysis, Insights and Forecast - by Application
- 7.1.1. Hot Drinks
- 7.1.2. Packaged Drinks
- 7.1.3. Milk and Dairy Drinks
- 7.1.4. CSD
- 7.1.5. Beer and Cider
- 7.1.6. Juice Drinks
- 7.1.7. Iced Tea and Coffee
- 7.1.8. Spirits
- 7.1.9. Wine
- 7.2. Market Analysis, Insights and Forecast - by Types
- 7.2.1. Bottles
- 7.2.2. Vials
- 7.2.3. Jars
- 7.2.4. Others
- 7.1. Market Analysis, Insights and Forecast - by Application
- 8. Europe Glass Packaging for Food and Beverages Analysis, Insights and Forecast, 2020-2032
- 8.1. Market Analysis, Insights and Forecast - by Application
- 8.1.1. Hot Drinks
- 8.1.2. Packaged Drinks
- 8.1.3. Milk and Dairy Drinks
- 8.1.4. CSD
- 8.1.5. Beer and Cider
- 8.1.6. Juice Drinks
- 8.1.7. Iced Tea and Coffee
- 8.1.8. Spirits
- 8.1.9. Wine
- 8.2. Market Analysis, Insights and Forecast - by Types
- 8.2.1. Bottles
- 8.2.2. Vials
- 8.2.3. Jars
- 8.2.4. Others
- 8.1. Market Analysis, Insights and Forecast - by Application
- 9. Middle East & Africa Glass Packaging for Food and Beverages Analysis, Insights and Forecast, 2020-2032
- 9.1. Market Analysis, Insights and Forecast - by Application
- 9.1.1. Hot Drinks
- 9.1.2. Packaged Drinks
- 9.1.3. Milk and Dairy Drinks
- 9.1.4. CSD
- 9.1.5. Beer and Cider
- 9.1.6. Juice Drinks
- 9.1.7. Iced Tea and Coffee
- 9.1.8. Spirits
- 9.1.9. Wine
- 9.2. Market Analysis, Insights and Forecast - by Types
- 9.2.1. Bottles
- 9.2.2. Vials
- 9.2.3. Jars
- 9.2.4. Others
- 9.1. Market Analysis, Insights and Forecast - by Application
- 10. Asia Pacific Glass Packaging for Food and Beverages Analysis, Insights and Forecast, 2020-2032
- 10.1. Market Analysis, Insights and Forecast - by Application
- 10.1.1. Hot Drinks
- 10.1.2. Packaged Drinks
- 10.1.3. Milk and Dairy Drinks
- 10.1.4. CSD
- 10.1.5. Beer and Cider
- 10.1.6. Juice Drinks
- 10.1.7. Iced Tea and Coffee
- 10.1.8. Spirits
- 10.1.9. Wine
- 10.2. Market Analysis, Insights and Forecast - by Types
- 10.2.1. Bottles
- 10.2.2. Vials
- 10.2.3. Jars
- 10.2.4. Others
- 10.1. Market Analysis, Insights and Forecast - by Application
- 11. Competitive Analysis
- 11.1. Global Market Share Analysis 2025
- 11.2. Company Profiles
- 11.2.1 Ardagh Packaging
- 11.2.1.1. Overview
- 11.2.1.2. Products
- 11.2.1.3. SWOT Analysis
- 11.2.1.4. Recent Developments
- 11.2.1.5. Financials (Based on Availability)
- 11.2.2 HNGI
- 11.2.2.1. Overview
- 11.2.2.2. Products
- 11.2.2.3. SWOT Analysis
- 11.2.2.4. Recent Developments
- 11.2.2.5. Financials (Based on Availability)
- 11.2.3 Owens-Illinois
- 11.2.3.1. Overview
- 11.2.3.2. Products
- 11.2.3.3. SWOT Analysis
- 11.2.3.4. Recent Developments
- 11.2.3.5. Financials (Based on Availability)
- 11.2.4 Saint-Gobain
- 11.2.4.1. Overview
- 11.2.4.2. Products
- 11.2.4.3. SWOT Analysis
- 11.2.4.4. Recent Developments
- 11.2.4.5. Financials (Based on Availability)
- 11.2.1 Ardagh Packaging
List of Figures
- Figure 1: Global Glass Packaging for Food and Beverages Revenue Breakdown (undefined, %) by Region 2025 & 2033
- Figure 2: North America Glass Packaging for Food and Beverages Revenue (undefined), by Application 2025 & 2033
- Figure 3: North America Glass Packaging for Food and Beverages Revenue Share (%), by Application 2025 & 2033
- Figure 4: North America Glass Packaging for Food and Beverages Revenue (undefined), by Types 2025 & 2033
- Figure 5: North America Glass Packaging for Food and Beverages Revenue Share (%), by Types 2025 & 2033
- Figure 6: North America Glass Packaging for Food and Beverages Revenue (undefined), by Country 2025 & 2033
- Figure 7: North America Glass Packaging for Food and Beverages Revenue Share (%), by Country 2025 & 2033
- Figure 8: South America Glass Packaging for Food and Beverages Revenue (undefined), by Application 2025 & 2033
- Figure 9: South America Glass Packaging for Food and Beverages Revenue Share (%), by Application 2025 & 2033
- Figure 10: South America Glass Packaging for Food and Beverages Revenue (undefined), by Types 2025 & 2033
- Figure 11: South America Glass Packaging for Food and Beverages Revenue Share (%), by Types 2025 & 2033
- Figure 12: South America Glass Packaging for Food and Beverages Revenue (undefined), by Country 2025 & 2033
- Figure 13: South America Glass Packaging for Food and Beverages Revenue Share (%), by Country 2025 & 2033
- Figure 14: Europe Glass Packaging for Food and Beverages Revenue (undefined), by Application 2025 & 2033
- Figure 15: Europe Glass Packaging for Food and Beverages Revenue Share (%), by Application 2025 & 2033
- Figure 16: Europe Glass Packaging for Food and Beverages Revenue (undefined), by Types 2025 & 2033
- Figure 17: Europe Glass Packaging for Food and Beverages Revenue Share (%), by Types 2025 & 2033
- Figure 18: Europe Glass Packaging for Food and Beverages Revenue (undefined), by Country 2025 & 2033
- Figure 19: Europe Glass Packaging for Food and Beverages Revenue Share (%), by Country 2025 & 2033
- Figure 20: Middle East & Africa Glass Packaging for Food and Beverages Revenue (undefined), by Application 2025 & 2033
- Figure 21: Middle East & Africa Glass Packaging for Food and Beverages Revenue Share (%), by Application 2025 & 2033
- Figure 22: Middle East & Africa Glass Packaging for Food and Beverages Revenue (undefined), by Types 2025 & 2033
- Figure 23: Middle East & Africa Glass Packaging for Food and Beverages Revenue Share (%), by Types 2025 & 2033
- Figure 24: Middle East & Africa Glass Packaging for Food and Beverages Revenue (undefined), by Country 2025 & 2033
- Figure 25: Middle East & Africa Glass Packaging for Food and Beverages Revenue Share (%), by Country 2025 & 2033
- Figure 26: Asia Pacific Glass Packaging for Food and Beverages Revenue (undefined), by Application 2025 & 2033
- Figure 27: Asia Pacific Glass Packaging for Food and Beverages Revenue Share (%), by Application 2025 & 2033
- Figure 28: Asia Pacific Glass Packaging for Food and Beverages Revenue (undefined), by Types 2025 & 2033
- Figure 29: Asia Pacific Glass Packaging for Food and Beverages Revenue Share (%), by Types 2025 & 2033
- Figure 30: Asia Pacific Glass Packaging for Food and Beverages Revenue (undefined), by Country 2025 & 2033
- Figure 31: Asia Pacific Glass Packaging for Food and Beverages Revenue Share (%), by Country 2025 & 2033
List of Tables
- Table 1: Global Glass Packaging for Food and Beverages Revenue undefined Forecast, by Application 2020 & 2033
- Table 2: Global Glass Packaging for Food and Beverages Revenue undefined Forecast, by Types 2020 & 2033
- Table 3: Global Glass Packaging for Food and Beverages Revenue undefined Forecast, by Region 2020 & 2033
- Table 4: Global Glass Packaging for Food and Beverages Revenue undefined Forecast, by Application 2020 & 2033
- Table 5: Global Glass Packaging for Food and Beverages Revenue undefined Forecast, by Types 2020 & 2033
- Table 6: Global Glass Packaging for Food and Beverages Revenue undefined Forecast, by Country 2020 & 2033
- Table 7: United States Glass Packaging for Food and Beverages Revenue (undefined) Forecast, by Application 2020 & 2033
- Table 8: Canada Glass Packaging for Food and Beverages Revenue (undefined) Forecast, by Application 2020 & 2033
- Table 9: Mexico Glass Packaging for Food and Beverages Revenue (undefined) Forecast, by Application 2020 & 2033
- Table 10: Global Glass Packaging for Food and Beverages Revenue undefined Forecast, by Application 2020 & 2033
- Table 11: Global Glass Packaging for Food and Beverages Revenue undefined Forecast, by Types 2020 & 2033
- Table 12: Global Glass Packaging for Food and Beverages Revenue undefined Forecast, by Country 2020 & 2033
- Table 13: Brazil Glass Packaging for Food and Beverages Revenue (undefined) Forecast, by Application 2020 & 2033
- Table 14: Argentina Glass Packaging for Food and Beverages Revenue (undefined) Forecast, by Application 2020 & 2033
- Table 15: Rest of South America Glass Packaging for Food and Beverages Revenue (undefined) Forecast, by Application 2020 & 2033
- Table 16: Global Glass Packaging for Food and Beverages Revenue undefined Forecast, by Application 2020 & 2033
- Table 17: Global Glass Packaging for Food and Beverages Revenue undefined Forecast, by Types 2020 & 2033
- Table 18: Global Glass Packaging for Food and Beverages Revenue undefined Forecast, by Country 2020 & 2033
- Table 19: United Kingdom Glass Packaging for Food and Beverages Revenue (undefined) Forecast, by Application 2020 & 2033
- Table 20: Germany Glass Packaging for Food and Beverages Revenue (undefined) Forecast, by Application 2020 & 2033
- Table 21: France Glass Packaging for Food and Beverages Revenue (undefined) Forecast, by Application 2020 & 2033
- Table 22: Italy Glass Packaging for Food and Beverages Revenue (undefined) Forecast, by Application 2020 & 2033
- Table 23: Spain Glass Packaging for Food and Beverages Revenue (undefined) Forecast, by Application 2020 & 2033
- Table 24: Russia Glass Packaging for Food and Beverages Revenue (undefined) Forecast, by Application 2020 & 2033
- Table 25: Benelux Glass Packaging for Food and Beverages Revenue (undefined) Forecast, by Application 2020 & 2033
- Table 26: Nordics Glass Packaging for Food and Beverages Revenue (undefined) Forecast, by Application 2020 & 2033
- Table 27: Rest of Europe Glass Packaging for Food and Beverages Revenue (undefined) Forecast, by Application 2020 & 2033
- Table 28: Global Glass Packaging for Food and Beverages Revenue undefined Forecast, by Application 2020 & 2033
- Table 29: Global Glass Packaging for Food and Beverages Revenue undefined Forecast, by Types 2020 & 2033
- Table 30: Global Glass Packaging for Food and Beverages Revenue undefined Forecast, by Country 2020 & 2033
- Table 31: Turkey Glass Packaging for Food and Beverages Revenue (undefined) Forecast, by Application 2020 & 2033
- Table 32: Israel Glass Packaging for Food and Beverages Revenue (undefined) Forecast, by Application 2020 & 2033
- Table 33: GCC Glass Packaging for Food and Beverages Revenue (undefined) Forecast, by Application 2020 & 2033
- Table 34: North Africa Glass Packaging for Food and Beverages Revenue (undefined) Forecast, by Application 2020 & 2033
- Table 35: South Africa Glass Packaging for Food and Beverages Revenue (undefined) Forecast, by Application 2020 & 2033
- Table 36: Rest of Middle East & Africa Glass Packaging for Food and Beverages Revenue (undefined) Forecast, by Application 2020 & 2033
- Table 37: Global Glass Packaging for Food and Beverages Revenue undefined Forecast, by Application 2020 & 2033
- Table 38: Global Glass Packaging for Food and Beverages Revenue undefined Forecast, by Types 2020 & 2033
- Table 39: Global Glass Packaging for Food and Beverages Revenue undefined Forecast, by Country 2020 & 2033
- Table 40: China Glass Packaging for Food and Beverages Revenue (undefined) Forecast, by Application 2020 & 2033
- Table 41: India Glass Packaging for Food and Beverages Revenue (undefined) Forecast, by Application 2020 & 2033
- Table 42: Japan Glass Packaging for Food and Beverages Revenue (undefined) Forecast, by Application 2020 & 2033
- Table 43: South Korea Glass Packaging for Food and Beverages Revenue (undefined) Forecast, by Application 2020 & 2033
- Table 44: ASEAN Glass Packaging for Food and Beverages Revenue (undefined) Forecast, by Application 2020 & 2033
- Table 45: Oceania Glass Packaging for Food and Beverages Revenue (undefined) Forecast, by Application 2020 & 2033
- Table 46: Rest of Asia Pacific Glass Packaging for Food and Beverages Revenue (undefined) Forecast, by Application 2020 & 2033
Frequently Asked Questions
1. What is the projected Compound Annual Growth Rate (CAGR) of the Glass Packaging for Food and Beverages?
The projected CAGR is approximately 3.6%.
2. Which companies are prominent players in the Glass Packaging for Food and Beverages?
Key companies in the market include Ardagh Packaging, HNGI, Owens-Illinois, Saint-Gobain.
3. What are the main segments of the Glass Packaging for Food and Beverages?
The market segments include Application, Types.
4. Can you provide details about the market size?
The market size is estimated to be USD XXX N/A as of 2022.
5. What are some drivers contributing to market growth?
N/A
6. What are the notable trends driving market growth?
N/A
7. Are there any restraints impacting market growth?
N/A
8. Can you provide examples of recent developments in the market?
N/A
9. What pricing options are available for accessing the report?
Pricing options include single-user, multi-user, and enterprise licenses priced at USD 4900.00, USD 7350.00, and USD 9800.00 respectively.
10. Is the market size provided in terms of value or volume?
The market size is provided in terms of value, measured in N/A.
11. Are there any specific market keywords associated with the report?
Yes, the market keyword associated with the report is "Glass Packaging for Food and Beverages," which aids in identifying and referencing the specific market segment covered.
12. How do I determine which pricing option suits my needs best?
The pricing options vary based on user requirements and access needs. Individual users may opt for single-user licenses, while businesses requiring broader access may choose multi-user or enterprise licenses for cost-effective access to the report.
13. Are there any additional resources or data provided in the Glass Packaging for Food and Beverages report?
While the report offers comprehensive insights, it's advisable to review the specific contents or supplementary materials provided to ascertain if additional resources or data are available.
14. How can I stay updated on further developments or reports in the Glass Packaging for Food and Beverages?
To stay informed about further developments, trends, and reports in the Glass Packaging for Food and Beverages, consider subscribing to industry newsletters, following relevant companies and organizations, or regularly checking reputable industry news sources and publications.
Methodology
Step 1 - Identification of Relevant Samples Size from Population Database


Step 2 - Approaches for Defining Global Market Size (Value, Volume* & Price*)

Note*: In applicable scenarios
Step 3 - Data Sources
Primary Research
- Web Analytics
- Survey Reports
- Research Institute
- Latest Research Reports
- Opinion Leaders
Secondary Research
- Annual Reports
- White Paper
- Latest Press Release
- Industry Association
- Paid Database
- Investor Presentations

Step 4 - Data Triangulation
Involves using different sources of information in order to increase the validity of a study
These sources are likely to be stakeholders in a program - participants, other researchers, program staff, other community members, and so on.
Then we put all data in single framework & apply various statistical tools to find out the dynamic on the market.
During the analysis stage, feedback from the stakeholder groups would be compared to determine areas of agreement as well as areas of divergence

