Key Insights
The global girder market is poised for significant expansion, driven by robust infrastructure development worldwide and increasing demand across various construction applications. In 2024, the market is valued at an estimated $45,016.88 million. The sector is expected to experience a Compound Annual Growth Rate (CAGR) of 6.7% from 2025 to 2033, projecting substantial growth in the coming years. This growth is primarily fueled by the increasing need for strong and durable structural components in building construction, as well as in critical infrastructure projects like bridges. Emerging economies, particularly in Asia Pacific and the Middle East & Africa, are exhibiting strong demand for girders due to rapid urbanization and substantial investments in public works and private sector construction. Technological advancements in material science and manufacturing processes are also contributing to the development of more efficient and cost-effective girder solutions, further stimulating market growth.
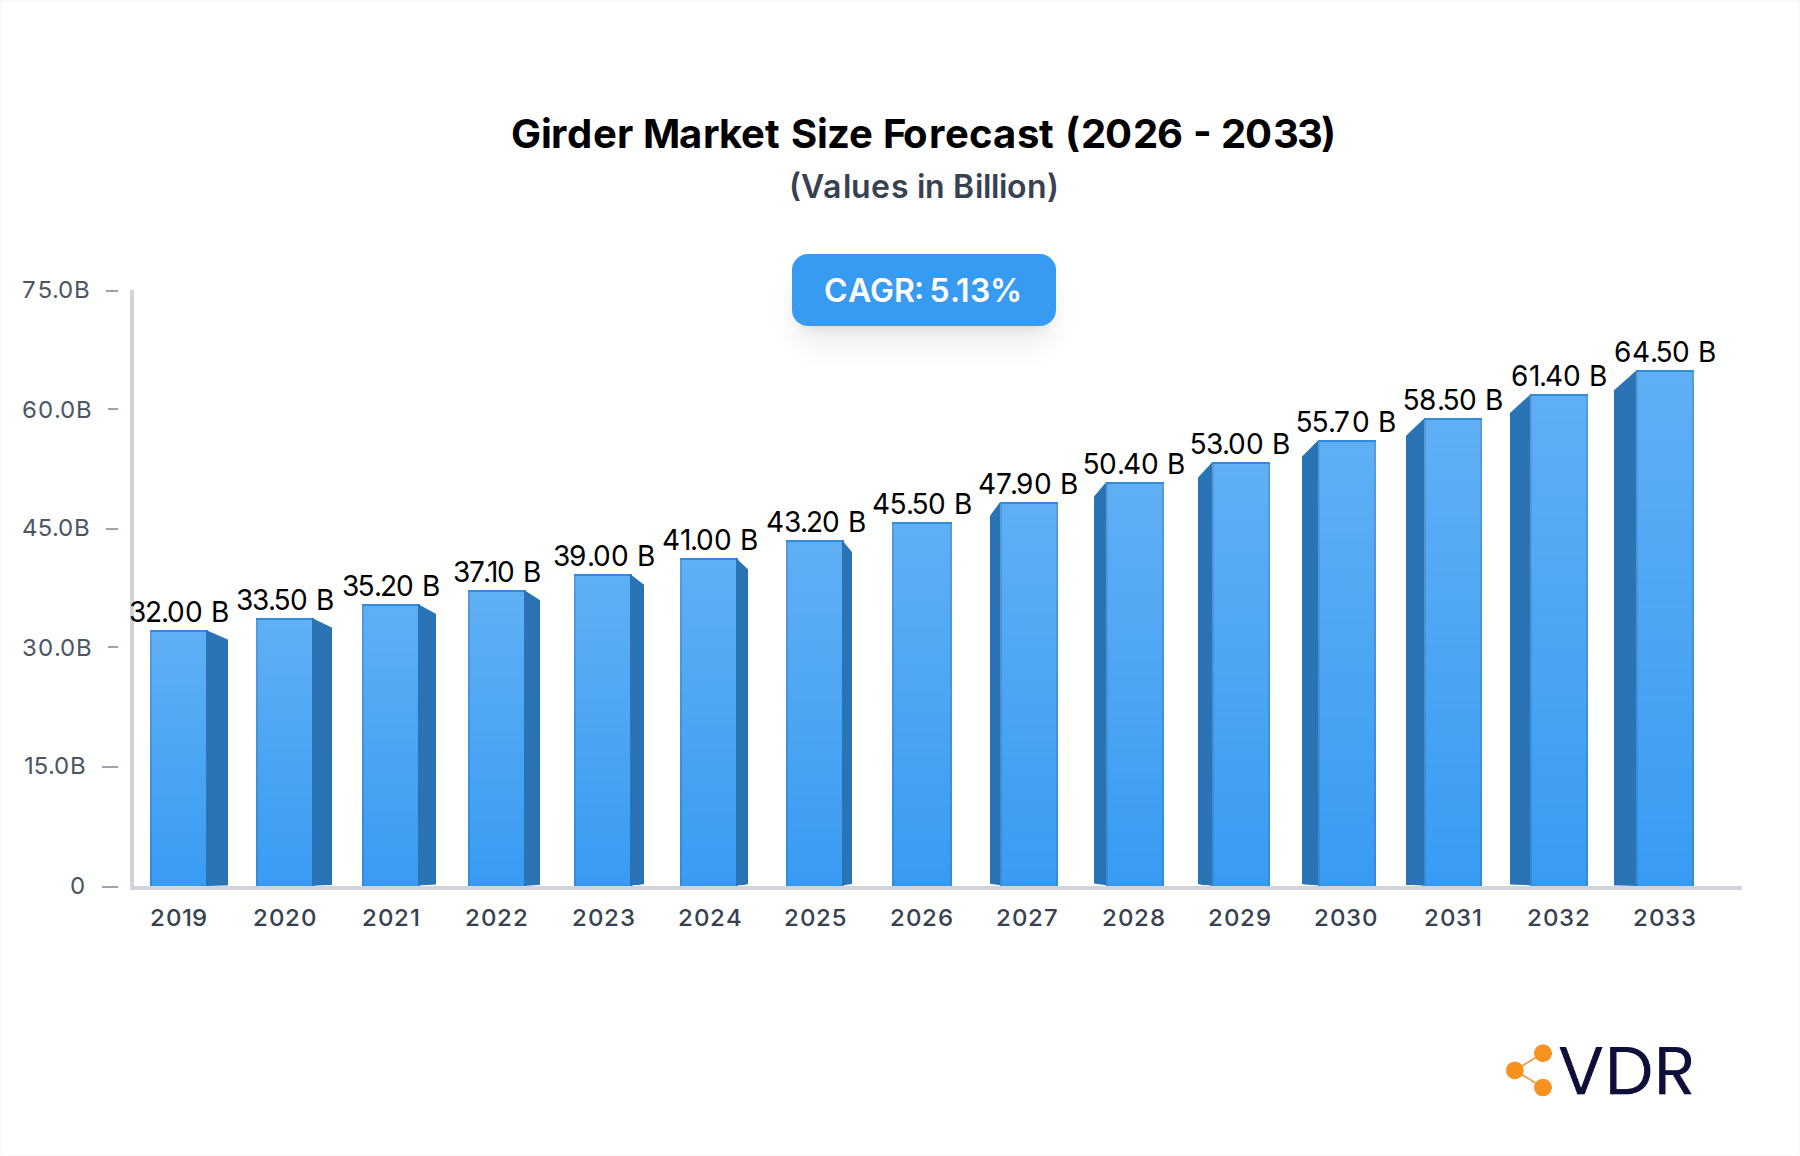
Girder Market Size (In Billion)
The girder market is characterized by diverse applications and types, catering to a wide spectrum of construction needs. In terms of application, buildings represent the largest segment, followed by bridges and other infrastructure projects. The types of girders available include metal girders, favored for their strength and durability in large-scale constructions; wood girders, often used in residential and traditional structures; and concrete girders, known for their versatility and cost-effectiveness. Key players such as JFE Holdings, ArcelorMittal, and Nippon Steel are actively involved in this market, focusing on innovation and expanding their product portfolios to meet evolving industry demands. The market's trajectory suggests a strong upward trend, with continued investment in infrastructure and construction activities worldwide acting as primary growth catalysts.

Girder Company Market Share
This in-depth report offers a panoramic view of the global girder market, dissecting its intricate dynamics, growth trajectories, and future potential from 2019 to 2033. With a base year of 2025 and a forecast period spanning 2025–2033, this analysis provides critical insights for industry stakeholders, including manufacturers, investors, engineers, and construction professionals. The report delves into parent and child markets, offering a granular understanding of market segmentation and identifying key growth drivers. We present all values in million units for clarity and conciseness.
Girder Market Dynamics & Structure
The global girder market exhibits a moderately concentrated structure, with key players like JFE Holdings, JPW Companies, ArcelorMittal, Nippon Steel, and Wuhan Group holding significant market shares. Technological innovation is a primary driver, particularly in the development of lighter, stronger, and more sustainable girder materials and manufacturing processes. Regulatory frameworks, especially those pertaining to construction safety standards and environmental impact, significantly influence market adoption and product development. Competitive product substitutes, such as advanced composite materials and pre-fabricated structural elements, pose a constant challenge, necessitating continuous innovation from girder manufacturers. End-user demographics are shifting, with an increasing demand for cost-effective and rapidly deployable structural solutions. Mergers and acquisitions (M&A) are a recurring theme, with companies consolidating to achieve economies of scale, expand technological capabilities, and enhance market reach. For instance, recent M&A activities have focused on integrating advanced manufacturing technologies and expanding into emerging markets.
- Market Concentration: Moderate, dominated by a few major global players.
- Technological Innovation: Driven by materials science (e.g., high-strength steel, composite materials), advanced manufacturing (e.g., automated fabrication), and BIM integration.
- Regulatory Frameworks: Stringent building codes, safety certifications, and sustainability mandates impact product design and material choices.
- Competitive Product Substitutes: Composites, pre-stressed concrete, and modular construction solutions.
- End-User Demographics: Growing demand from developing economies, urban infrastructure projects, and sustainable building initiatives.
- M&A Trends: Strategic acquisitions to gain market share, acquire new technologies, and diversify product portfolios. Deal volume projected to increase by xx% in the next five years.
Girder Growth Trends & Insights
The global girder market is poised for significant expansion, driven by robust infrastructure development and evolving construction methodologies. The market size is projected to reach USD 25,000 million by 2033, exhibiting a Compound Annual Growth Rate (CAGR) of 4.5% during the forecast period. Adoption rates are steadily increasing, fueled by the superior strength-to-weight ratio of metal girders and the cost-effectiveness of concrete girders in specific applications. Technological disruptions, including advancements in 3D printing for structural components and the use of AI in structural design optimization, are poised to revolutionize the market. Consumer behavior is shifting towards sustainable construction practices, prioritizing materials with a lower environmental footprint and longer service life. This trend is particularly evident in the growing demand for recycled steel and engineered wood girders. The base year of 2025 sees the market valued at USD 18,000 million, reflecting a steady historical growth from 2019–2024. The increasing urbanization in emerging economies and the global focus on upgrading aging infrastructure are critical factors contributing to sustained market penetration. The projected market penetration for advanced girder systems is expected to rise by 15% by 2033.
Dominant Regions, Countries, or Segments in Girder
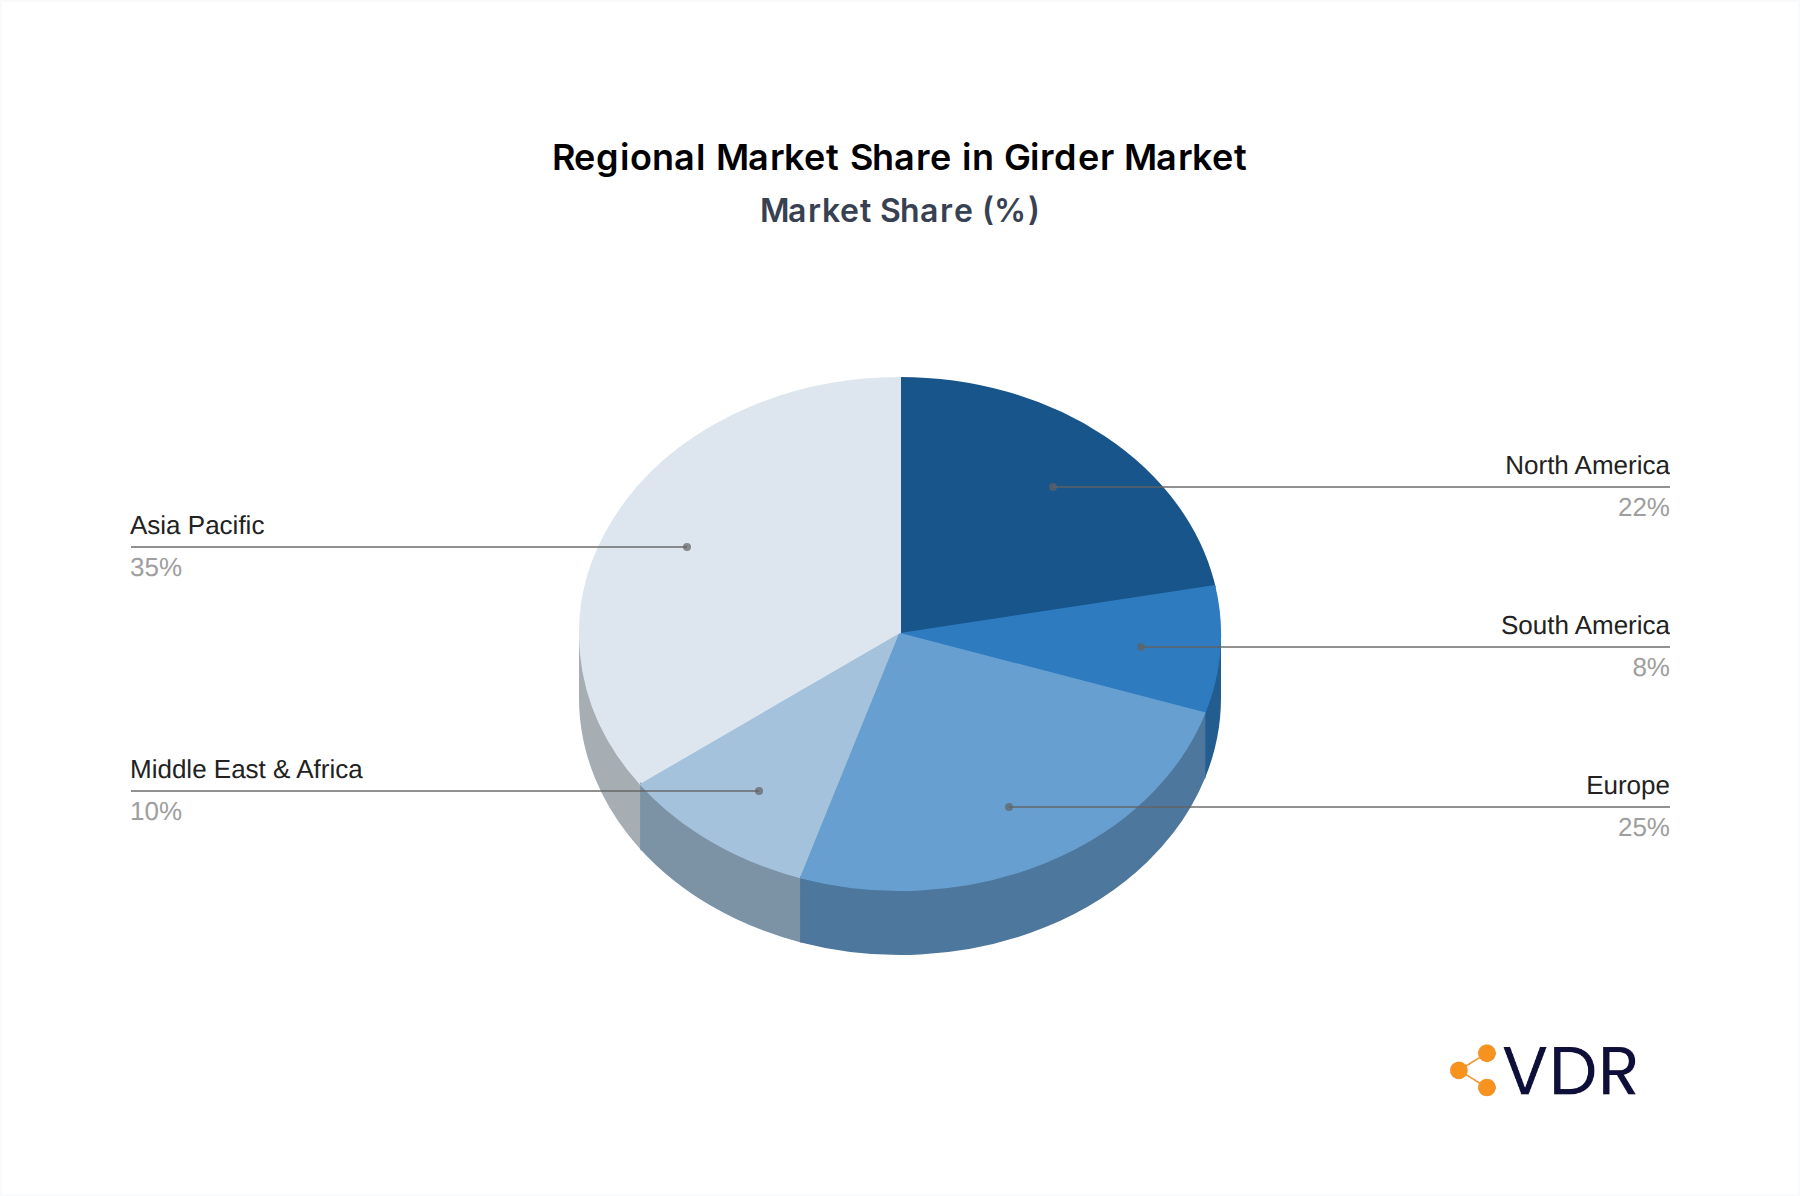
The Buildings segment, particularly within the Metal Girder sub-segment, is a dominant force driving growth in the global girder market. This dominance is primarily attributed to the burgeoning construction of commercial, residential, and industrial buildings worldwide, especially in rapidly urbanizing regions. Asia-Pacific, spearheaded by China and India, represents the largest and fastest-growing regional market for girders. This region's growth is propelled by substantial government investments in infrastructure development, including smart cities, high-speed rail networks, and commercial complexes. The increasing adoption of pre-fabricated construction techniques, which heavily rely on standardized metal girders for speed and efficiency, further bolsters this segment's lead.
- Dominant Segment: Buildings (estimated market share of 45% in 2025).
- Dominant Type: Metal Girder (estimated market share of 60% within the Buildings segment).
- Key Regional Market: Asia-Pacific (projected to account for 35% of the global market by 2025).
- Drivers in Asia-Pacific:
- Massive urbanization and population growth.
- Government initiatives for infrastructure development (e.g., Belt and Road Initiative).
- Growing real estate sector and demand for modern architectural designs.
- Increased adoption of pre-engineered building (PEB) solutions.
- Dominance Factors:
- Economic Policies: Favorable investment climates and incentives for construction projects.
- Infrastructure Spending: Significant allocation of public funds towards infrastructure upgrades and new constructions.
- Market Share: Asia-Pacific's substantial share is driven by sheer volume of construction projects.
- Growth Potential: Continued urbanization and economic development promise sustained high growth for the region.
- Other Key Segments & Regions: The Bridges segment is also a significant contributor, with ongoing global efforts to replace aging bridges and build new ones to support increased traffic. North America and Europe remain crucial markets, characterized by a focus on retrofitting existing structures and adopting high-performance, durable girder solutions.
Girder Product Landscape
The girder market is witnessing a continuous stream of product innovations focused on enhancing structural integrity, reducing weight, and improving sustainability. High-strength steel girders, incorporating advanced alloys and manufacturing techniques, offer superior load-bearing capacity with a reduced material footprint. The development of composite girders, utilizing carbon fiber or fiberglass reinforced polymers, presents lightweight and corrosion-resistant alternatives for specialized applications, particularly in corrosive environments. Engineered wood girders are gaining traction for their renewable nature and aesthetic appeal in sustainable construction projects. Furthermore, advancements in fabrication technologies, such as robotic welding and precision cutting, ensure higher quality and faster production cycles for all girder types.
Key Drivers, Barriers & Challenges in Girder
Key Drivers:
- Infrastructure Development: Global initiatives for building and upgrading roads, bridges, and buildings are paramount.
- Technological Advancements: Innovations in material science, manufacturing processes, and design software are enhancing girder performance and efficiency.
- Urbanization: Rapid population growth in urban centers necessitates continuous construction of residential, commercial, and industrial facilities.
- Sustainability Trends: Growing demand for eco-friendly construction materials and methods, favoring recycled steel and engineered wood.
Barriers & Challenges:
- Volatile Raw Material Prices: Fluctuations in steel and timber prices directly impact manufacturing costs and profit margins.
- Supply Chain Disruptions: Global events can disrupt the availability and timely delivery of raw materials and finished products.
- Stringent Regulations and Standards: Compliance with evolving building codes and safety regulations can increase development and certification costs.
- Competition from Substitutes: The emergence of advanced composite materials and alternative construction methods poses a competitive threat.
- Skilled Labor Shortage: A lack of qualified welders, fabricators, and installers can hinder project execution. The impact of supply chain disruptions is estimated at a 5% increase in project timelines for the next two years.
Emerging Opportunities in Girder
Emerging opportunities in the girder market lie in the development of smart girders integrated with sensors for real-time structural health monitoring, particularly for critical infrastructure like bridges and high-rise buildings. The growing demand for sustainable construction presents a significant opportunity for manufacturers of engineered wood girders and those utilizing recycled materials. Furthermore, the expansion of construction activities in developing economies, coupled with government incentives for green building, opens new untapped markets. The rise of modular and prefabricated construction offers a niche for standardized, rapidly deployable girder systems.
Growth Accelerators in the Girder Industry
Key growth accelerators include significant government investments in national infrastructure projects, the increasing adoption of Building Information Modeling (BIM) for optimized structural design and fabrication, and strategic partnerships between material suppliers, manufacturers, and construction firms. Technological breakthroughs in material science, leading to stronger, lighter, and more durable girders, will also act as significant catalysts. Market expansion strategies targeting emerging economies with burgeoning construction sectors are crucial for long-term growth.
Key Players Shaping the Girder Market
- JFE Holdings
- JPW Companies
- ArcelorMittal
- Nippon Steel
- Wuhan Group
- High Industries
- Emirates Building System
- United Engineering Industries
Notable Milestones in Girder Sector
- 2021: ArcelorMittal launches a new range of high-strength structural steel with improved sustainability credentials.
- 2022: JFE Holdings invests in advanced robotic welding technology to enhance girder fabrication efficiency.
- 2023: Nippon Steel develops a novel steel grade for bridge construction, offering enhanced corrosion resistance.
- 2024: Wuhan Group announces strategic expansion into Southeast Asian markets to capitalize on infrastructure growth.
- 2024: The development of innovative composite girder designs for offshore wind turbine foundations gains traction.
In-Depth Girder Market Outlook
The future outlook for the girder market is exceptionally promising, driven by a confluence of factors including sustained global infrastructure development, continuous technological innovation, and an increasing emphasis on sustainable construction practices. The market is poised for robust growth, with advanced girder solutions, smart structural components, and eco-friendly materials set to lead the charge. Strategic investments in emerging markets, coupled with collaborations aimed at enhancing production efficiency and supply chain resilience, will be critical for capitalizing on future opportunities and ensuring long-term market leadership.
Girder Segmentation
-
1. Application
- 1.1. Buildings
- 1.2. Bridges
- 1.3. Others
-
2. Types
- 2.1. Metal Girder
- 2.2. Wood Girder
- 2.3. Concrete Girder
Girder Segmentation By Geography
-
1. North America
- 1.1. United States
- 1.2. Canada
- 1.3. Mexico
-
2. South America
- 2.1. Brazil
- 2.2. Argentina
- 2.3. Rest of South America
-
3. Europe
- 3.1. United Kingdom
- 3.2. Germany
- 3.3. France
- 3.4. Italy
- 3.5. Spain
- 3.6. Russia
- 3.7. Benelux
- 3.8. Nordics
- 3.9. Rest of Europe
-
4. Middle East & Africa
- 4.1. Turkey
- 4.2. Israel
- 4.3. GCC
- 4.4. North Africa
- 4.5. South Africa
- 4.6. Rest of Middle East & Africa
-
5. Asia Pacific
- 5.1. China
- 5.2. India
- 5.3. Japan
- 5.4. South Korea
- 5.5. ASEAN
- 5.6. Oceania
- 5.7. Rest of Asia Pacific
Girder Regional Market Share
Geographic Coverage of Girder
Girder REPORT HIGHLIGHTS
| Aspects | Details |
|---|---|
| Study Period | 2020-2034 |
| Base Year | 2025 |
| Estimated Year | 2026 |
| Forecast Period | 2026-2034 |
| Historical Period | 2020-2025 |
| Growth Rate | CAGR of 6.7% from 2020-2034 |
| Segmentation |
|
Table of Contents
- 1. Introduction
- 1.1. Research Scope
- 1.2. Market Segmentation
- 1.3. Research Methodology
- 1.4. Definitions and Assumptions
- 2. Executive Summary
- 2.1. Introduction
- 3. Market Dynamics
- 3.1. Introduction
- 3.2. Market Drivers
- 3.3. Market Restrains
- 3.4. Market Trends
- 4. Market Factor Analysis
- 4.1. Porters Five Forces
- 4.2. Supply/Value Chain
- 4.3. PESTEL analysis
- 4.4. Market Entropy
- 4.5. Patent/Trademark Analysis
- 5. Global Girder Analysis, Insights and Forecast, 2020-2032
- 5.1. Market Analysis, Insights and Forecast - by Application
- 5.1.1. Buildings
- 5.1.2. Bridges
- 5.1.3. Others
- 5.2. Market Analysis, Insights and Forecast - by Types
- 5.2.1. Metal Girder
- 5.2.2. Wood Girder
- 5.2.3. Concrete Girder
- 5.3. Market Analysis, Insights and Forecast - by Region
- 5.3.1. North America
- 5.3.2. South America
- 5.3.3. Europe
- 5.3.4. Middle East & Africa
- 5.3.5. Asia Pacific
- 5.1. Market Analysis, Insights and Forecast - by Application
- 6. North America Girder Analysis, Insights and Forecast, 2020-2032
- 6.1. Market Analysis, Insights and Forecast - by Application
- 6.1.1. Buildings
- 6.1.2. Bridges
- 6.1.3. Others
- 6.2. Market Analysis, Insights and Forecast - by Types
- 6.2.1. Metal Girder
- 6.2.2. Wood Girder
- 6.2.3. Concrete Girder
- 6.1. Market Analysis, Insights and Forecast - by Application
- 7. South America Girder Analysis, Insights and Forecast, 2020-2032
- 7.1. Market Analysis, Insights and Forecast - by Application
- 7.1.1. Buildings
- 7.1.2. Bridges
- 7.1.3. Others
- 7.2. Market Analysis, Insights and Forecast - by Types
- 7.2.1. Metal Girder
- 7.2.2. Wood Girder
- 7.2.3. Concrete Girder
- 7.1. Market Analysis, Insights and Forecast - by Application
- 8. Europe Girder Analysis, Insights and Forecast, 2020-2032
- 8.1. Market Analysis, Insights and Forecast - by Application
- 8.1.1. Buildings
- 8.1.2. Bridges
- 8.1.3. Others
- 8.2. Market Analysis, Insights and Forecast - by Types
- 8.2.1. Metal Girder
- 8.2.2. Wood Girder
- 8.2.3. Concrete Girder
- 8.1. Market Analysis, Insights and Forecast - by Application
- 9. Middle East & Africa Girder Analysis, Insights and Forecast, 2020-2032
- 9.1. Market Analysis, Insights and Forecast - by Application
- 9.1.1. Buildings
- 9.1.2. Bridges
- 9.1.3. Others
- 9.2. Market Analysis, Insights and Forecast - by Types
- 9.2.1. Metal Girder
- 9.2.2. Wood Girder
- 9.2.3. Concrete Girder
- 9.1. Market Analysis, Insights and Forecast - by Application
- 10. Asia Pacific Girder Analysis, Insights and Forecast, 2020-2032
- 10.1. Market Analysis, Insights and Forecast - by Application
- 10.1.1. Buildings
- 10.1.2. Bridges
- 10.1.3. Others
- 10.2. Market Analysis, Insights and Forecast - by Types
- 10.2.1. Metal Girder
- 10.2.2. Wood Girder
- 10.2.3. Concrete Girder
- 10.1. Market Analysis, Insights and Forecast - by Application
- 11. Competitive Analysis
- 11.1. Global Market Share Analysis 2025
- 11.2. Company Profiles
- 11.2.1 JFE Holdings
- 11.2.1.1. Overview
- 11.2.1.2. Products
- 11.2.1.3. SWOT Analysis
- 11.2.1.4. Recent Developments
- 11.2.1.5. Financials (Based on Availability)
- 11.2.2 JPW Companies
- 11.2.2.1. Overview
- 11.2.2.2. Products
- 11.2.2.3. SWOT Analysis
- 11.2.2.4. Recent Developments
- 11.2.2.5. Financials (Based on Availability)
- 11.2.3 ArcelorMittal
- 11.2.3.1. Overview
- 11.2.3.2. Products
- 11.2.3.3. SWOT Analysis
- 11.2.3.4. Recent Developments
- 11.2.3.5. Financials (Based on Availability)
- 11.2.4 Nippon Steel
- 11.2.4.1. Overview
- 11.2.4.2. Products
- 11.2.4.3. SWOT Analysis
- 11.2.4.4. Recent Developments
- 11.2.4.5. Financials (Based on Availability)
- 11.2.5 Wuhan Group
- 11.2.5.1. Overview
- 11.2.5.2. Products
- 11.2.5.3. SWOT Analysis
- 11.2.5.4. Recent Developments
- 11.2.5.5. Financials (Based on Availability)
- 11.2.6 High Industries
- 11.2.6.1. Overview
- 11.2.6.2. Products
- 11.2.6.3. SWOT Analysis
- 11.2.6.4. Recent Developments
- 11.2.6.5. Financials (Based on Availability)
- 11.2.7 Emirates Building System
- 11.2.7.1. Overview
- 11.2.7.2. Products
- 11.2.7.3. SWOT Analysis
- 11.2.7.4. Recent Developments
- 11.2.7.5. Financials (Based on Availability)
- 11.2.8 United Engineering Industries
- 11.2.8.1. Overview
- 11.2.8.2. Products
- 11.2.8.3. SWOT Analysis
- 11.2.8.4. Recent Developments
- 11.2.8.5. Financials (Based on Availability)
- 11.2.1 JFE Holdings
List of Figures
- Figure 1: Global Girder Revenue Breakdown (undefined, %) by Region 2025 & 2033
- Figure 2: Global Girder Volume Breakdown (K, %) by Region 2025 & 2033
- Figure 3: North America Girder Revenue (undefined), by Application 2025 & 2033
- Figure 4: North America Girder Volume (K), by Application 2025 & 2033
- Figure 5: North America Girder Revenue Share (%), by Application 2025 & 2033
- Figure 6: North America Girder Volume Share (%), by Application 2025 & 2033
- Figure 7: North America Girder Revenue (undefined), by Types 2025 & 2033
- Figure 8: North America Girder Volume (K), by Types 2025 & 2033
- Figure 9: North America Girder Revenue Share (%), by Types 2025 & 2033
- Figure 10: North America Girder Volume Share (%), by Types 2025 & 2033
- Figure 11: North America Girder Revenue (undefined), by Country 2025 & 2033
- Figure 12: North America Girder Volume (K), by Country 2025 & 2033
- Figure 13: North America Girder Revenue Share (%), by Country 2025 & 2033
- Figure 14: North America Girder Volume Share (%), by Country 2025 & 2033
- Figure 15: South America Girder Revenue (undefined), by Application 2025 & 2033
- Figure 16: South America Girder Volume (K), by Application 2025 & 2033
- Figure 17: South America Girder Revenue Share (%), by Application 2025 & 2033
- Figure 18: South America Girder Volume Share (%), by Application 2025 & 2033
- Figure 19: South America Girder Revenue (undefined), by Types 2025 & 2033
- Figure 20: South America Girder Volume (K), by Types 2025 & 2033
- Figure 21: South America Girder Revenue Share (%), by Types 2025 & 2033
- Figure 22: South America Girder Volume Share (%), by Types 2025 & 2033
- Figure 23: South America Girder Revenue (undefined), by Country 2025 & 2033
- Figure 24: South America Girder Volume (K), by Country 2025 & 2033
- Figure 25: South America Girder Revenue Share (%), by Country 2025 & 2033
- Figure 26: South America Girder Volume Share (%), by Country 2025 & 2033
- Figure 27: Europe Girder Revenue (undefined), by Application 2025 & 2033
- Figure 28: Europe Girder Volume (K), by Application 2025 & 2033
- Figure 29: Europe Girder Revenue Share (%), by Application 2025 & 2033
- Figure 30: Europe Girder Volume Share (%), by Application 2025 & 2033
- Figure 31: Europe Girder Revenue (undefined), by Types 2025 & 2033
- Figure 32: Europe Girder Volume (K), by Types 2025 & 2033
- Figure 33: Europe Girder Revenue Share (%), by Types 2025 & 2033
- Figure 34: Europe Girder Volume Share (%), by Types 2025 & 2033
- Figure 35: Europe Girder Revenue (undefined), by Country 2025 & 2033
- Figure 36: Europe Girder Volume (K), by Country 2025 & 2033
- Figure 37: Europe Girder Revenue Share (%), by Country 2025 & 2033
- Figure 38: Europe Girder Volume Share (%), by Country 2025 & 2033
- Figure 39: Middle East & Africa Girder Revenue (undefined), by Application 2025 & 2033
- Figure 40: Middle East & Africa Girder Volume (K), by Application 2025 & 2033
- Figure 41: Middle East & Africa Girder Revenue Share (%), by Application 2025 & 2033
- Figure 42: Middle East & Africa Girder Volume Share (%), by Application 2025 & 2033
- Figure 43: Middle East & Africa Girder Revenue (undefined), by Types 2025 & 2033
- Figure 44: Middle East & Africa Girder Volume (K), by Types 2025 & 2033
- Figure 45: Middle East & Africa Girder Revenue Share (%), by Types 2025 & 2033
- Figure 46: Middle East & Africa Girder Volume Share (%), by Types 2025 & 2033
- Figure 47: Middle East & Africa Girder Revenue (undefined), by Country 2025 & 2033
- Figure 48: Middle East & Africa Girder Volume (K), by Country 2025 & 2033
- Figure 49: Middle East & Africa Girder Revenue Share (%), by Country 2025 & 2033
- Figure 50: Middle East & Africa Girder Volume Share (%), by Country 2025 & 2033
- Figure 51: Asia Pacific Girder Revenue (undefined), by Application 2025 & 2033
- Figure 52: Asia Pacific Girder Volume (K), by Application 2025 & 2033
- Figure 53: Asia Pacific Girder Revenue Share (%), by Application 2025 & 2033
- Figure 54: Asia Pacific Girder Volume Share (%), by Application 2025 & 2033
- Figure 55: Asia Pacific Girder Revenue (undefined), by Types 2025 & 2033
- Figure 56: Asia Pacific Girder Volume (K), by Types 2025 & 2033
- Figure 57: Asia Pacific Girder Revenue Share (%), by Types 2025 & 2033
- Figure 58: Asia Pacific Girder Volume Share (%), by Types 2025 & 2033
- Figure 59: Asia Pacific Girder Revenue (undefined), by Country 2025 & 2033
- Figure 60: Asia Pacific Girder Volume (K), by Country 2025 & 2033
- Figure 61: Asia Pacific Girder Revenue Share (%), by Country 2025 & 2033
- Figure 62: Asia Pacific Girder Volume Share (%), by Country 2025 & 2033
List of Tables
- Table 1: Global Girder Revenue undefined Forecast, by Application 2020 & 2033
- Table 2: Global Girder Volume K Forecast, by Application 2020 & 2033
- Table 3: Global Girder Revenue undefined Forecast, by Types 2020 & 2033
- Table 4: Global Girder Volume K Forecast, by Types 2020 & 2033
- Table 5: Global Girder Revenue undefined Forecast, by Region 2020 & 2033
- Table 6: Global Girder Volume K Forecast, by Region 2020 & 2033
- Table 7: Global Girder Revenue undefined Forecast, by Application 2020 & 2033
- Table 8: Global Girder Volume K Forecast, by Application 2020 & 2033
- Table 9: Global Girder Revenue undefined Forecast, by Types 2020 & 2033
- Table 10: Global Girder Volume K Forecast, by Types 2020 & 2033
- Table 11: Global Girder Revenue undefined Forecast, by Country 2020 & 2033
- Table 12: Global Girder Volume K Forecast, by Country 2020 & 2033
- Table 13: United States Girder Revenue (undefined) Forecast, by Application 2020 & 2033
- Table 14: United States Girder Volume (K) Forecast, by Application 2020 & 2033
- Table 15: Canada Girder Revenue (undefined) Forecast, by Application 2020 & 2033
- Table 16: Canada Girder Volume (K) Forecast, by Application 2020 & 2033
- Table 17: Mexico Girder Revenue (undefined) Forecast, by Application 2020 & 2033
- Table 18: Mexico Girder Volume (K) Forecast, by Application 2020 & 2033
- Table 19: Global Girder Revenue undefined Forecast, by Application 2020 & 2033
- Table 20: Global Girder Volume K Forecast, by Application 2020 & 2033
- Table 21: Global Girder Revenue undefined Forecast, by Types 2020 & 2033
- Table 22: Global Girder Volume K Forecast, by Types 2020 & 2033
- Table 23: Global Girder Revenue undefined Forecast, by Country 2020 & 2033
- Table 24: Global Girder Volume K Forecast, by Country 2020 & 2033
- Table 25: Brazil Girder Revenue (undefined) Forecast, by Application 2020 & 2033
- Table 26: Brazil Girder Volume (K) Forecast, by Application 2020 & 2033
- Table 27: Argentina Girder Revenue (undefined) Forecast, by Application 2020 & 2033
- Table 28: Argentina Girder Volume (K) Forecast, by Application 2020 & 2033
- Table 29: Rest of South America Girder Revenue (undefined) Forecast, by Application 2020 & 2033
- Table 30: Rest of South America Girder Volume (K) Forecast, by Application 2020 & 2033
- Table 31: Global Girder Revenue undefined Forecast, by Application 2020 & 2033
- Table 32: Global Girder Volume K Forecast, by Application 2020 & 2033
- Table 33: Global Girder Revenue undefined Forecast, by Types 2020 & 2033
- Table 34: Global Girder Volume K Forecast, by Types 2020 & 2033
- Table 35: Global Girder Revenue undefined Forecast, by Country 2020 & 2033
- Table 36: Global Girder Volume K Forecast, by Country 2020 & 2033
- Table 37: United Kingdom Girder Revenue (undefined) Forecast, by Application 2020 & 2033
- Table 38: United Kingdom Girder Volume (K) Forecast, by Application 2020 & 2033
- Table 39: Germany Girder Revenue (undefined) Forecast, by Application 2020 & 2033
- Table 40: Germany Girder Volume (K) Forecast, by Application 2020 & 2033
- Table 41: France Girder Revenue (undefined) Forecast, by Application 2020 & 2033
- Table 42: France Girder Volume (K) Forecast, by Application 2020 & 2033
- Table 43: Italy Girder Revenue (undefined) Forecast, by Application 2020 & 2033
- Table 44: Italy Girder Volume (K) Forecast, by Application 2020 & 2033
- Table 45: Spain Girder Revenue (undefined) Forecast, by Application 2020 & 2033
- Table 46: Spain Girder Volume (K) Forecast, by Application 2020 & 2033
- Table 47: Russia Girder Revenue (undefined) Forecast, by Application 2020 & 2033
- Table 48: Russia Girder Volume (K) Forecast, by Application 2020 & 2033
- Table 49: Benelux Girder Revenue (undefined) Forecast, by Application 2020 & 2033
- Table 50: Benelux Girder Volume (K) Forecast, by Application 2020 & 2033
- Table 51: Nordics Girder Revenue (undefined) Forecast, by Application 2020 & 2033
- Table 52: Nordics Girder Volume (K) Forecast, by Application 2020 & 2033
- Table 53: Rest of Europe Girder Revenue (undefined) Forecast, by Application 2020 & 2033
- Table 54: Rest of Europe Girder Volume (K) Forecast, by Application 2020 & 2033
- Table 55: Global Girder Revenue undefined Forecast, by Application 2020 & 2033
- Table 56: Global Girder Volume K Forecast, by Application 2020 & 2033
- Table 57: Global Girder Revenue undefined Forecast, by Types 2020 & 2033
- Table 58: Global Girder Volume K Forecast, by Types 2020 & 2033
- Table 59: Global Girder Revenue undefined Forecast, by Country 2020 & 2033
- Table 60: Global Girder Volume K Forecast, by Country 2020 & 2033
- Table 61: Turkey Girder Revenue (undefined) Forecast, by Application 2020 & 2033
- Table 62: Turkey Girder Volume (K) Forecast, by Application 2020 & 2033
- Table 63: Israel Girder Revenue (undefined) Forecast, by Application 2020 & 2033
- Table 64: Israel Girder Volume (K) Forecast, by Application 2020 & 2033
- Table 65: GCC Girder Revenue (undefined) Forecast, by Application 2020 & 2033
- Table 66: GCC Girder Volume (K) Forecast, by Application 2020 & 2033
- Table 67: North Africa Girder Revenue (undefined) Forecast, by Application 2020 & 2033
- Table 68: North Africa Girder Volume (K) Forecast, by Application 2020 & 2033
- Table 69: South Africa Girder Revenue (undefined) Forecast, by Application 2020 & 2033
- Table 70: South Africa Girder Volume (K) Forecast, by Application 2020 & 2033
- Table 71: Rest of Middle East & Africa Girder Revenue (undefined) Forecast, by Application 2020 & 2033
- Table 72: Rest of Middle East & Africa Girder Volume (K) Forecast, by Application 2020 & 2033
- Table 73: Global Girder Revenue undefined Forecast, by Application 2020 & 2033
- Table 74: Global Girder Volume K Forecast, by Application 2020 & 2033
- Table 75: Global Girder Revenue undefined Forecast, by Types 2020 & 2033
- Table 76: Global Girder Volume K Forecast, by Types 2020 & 2033
- Table 77: Global Girder Revenue undefined Forecast, by Country 2020 & 2033
- Table 78: Global Girder Volume K Forecast, by Country 2020 & 2033
- Table 79: China Girder Revenue (undefined) Forecast, by Application 2020 & 2033
- Table 80: China Girder Volume (K) Forecast, by Application 2020 & 2033
- Table 81: India Girder Revenue (undefined) Forecast, by Application 2020 & 2033
- Table 82: India Girder Volume (K) Forecast, by Application 2020 & 2033
- Table 83: Japan Girder Revenue (undefined) Forecast, by Application 2020 & 2033
- Table 84: Japan Girder Volume (K) Forecast, by Application 2020 & 2033
- Table 85: South Korea Girder Revenue (undefined) Forecast, by Application 2020 & 2033
- Table 86: South Korea Girder Volume (K) Forecast, by Application 2020 & 2033
- Table 87: ASEAN Girder Revenue (undefined) Forecast, by Application 2020 & 2033
- Table 88: ASEAN Girder Volume (K) Forecast, by Application 2020 & 2033
- Table 89: Oceania Girder Revenue (undefined) Forecast, by Application 2020 & 2033
- Table 90: Oceania Girder Volume (K) Forecast, by Application 2020 & 2033
- Table 91: Rest of Asia Pacific Girder Revenue (undefined) Forecast, by Application 2020 & 2033
- Table 92: Rest of Asia Pacific Girder Volume (K) Forecast, by Application 2020 & 2033
Frequently Asked Questions
1. What is the projected Compound Annual Growth Rate (CAGR) of the Girder?
The projected CAGR is approximately 6.7%.
2. Which companies are prominent players in the Girder?
Key companies in the market include JFE Holdings, JPW Companies, ArcelorMittal, Nippon Steel, Wuhan Group, High Industries, Emirates Building System, United Engineering Industries.
3. What are the main segments of the Girder?
The market segments include Application, Types.
4. Can you provide details about the market size?
The market size is estimated to be USD XXX N/A as of 2022.
5. What are some drivers contributing to market growth?
N/A
6. What are the notable trends driving market growth?
N/A
7. Are there any restraints impacting market growth?
N/A
8. Can you provide examples of recent developments in the market?
N/A
9. What pricing options are available for accessing the report?
Pricing options include single-user, multi-user, and enterprise licenses priced at USD 3950.00, USD 5925.00, and USD 7900.00 respectively.
10. Is the market size provided in terms of value or volume?
The market size is provided in terms of value, measured in N/A and volume, measured in K.
11. Are there any specific market keywords associated with the report?
Yes, the market keyword associated with the report is "Girder," which aids in identifying and referencing the specific market segment covered.
12. How do I determine which pricing option suits my needs best?
The pricing options vary based on user requirements and access needs. Individual users may opt for single-user licenses, while businesses requiring broader access may choose multi-user or enterprise licenses for cost-effective access to the report.
13. Are there any additional resources or data provided in the Girder report?
While the report offers comprehensive insights, it's advisable to review the specific contents or supplementary materials provided to ascertain if additional resources or data are available.
14. How can I stay updated on further developments or reports in the Girder?
To stay informed about further developments, trends, and reports in the Girder, consider subscribing to industry newsletters, following relevant companies and organizations, or regularly checking reputable industry news sources and publications.
Methodology
Step 1 - Identification of Relevant Samples Size from Population Database


Step 2 - Approaches for Defining Global Market Size (Value, Volume* & Price*)

Note*: In applicable scenarios
Step 3 - Data Sources
Primary Research
- Web Analytics
- Survey Reports
- Research Institute
- Latest Research Reports
- Opinion Leaders
Secondary Research
- Annual Reports
- White Paper
- Latest Press Release
- Industry Association
- Paid Database
- Investor Presentations

Step 4 - Data Triangulation
Involves using different sources of information in order to increase the validity of a study
These sources are likely to be stakeholders in a program - participants, other researchers, program staff, other community members, and so on.
Then we put all data in single framework & apply various statistical tools to find out the dynamic on the market.
During the analysis stage, feedback from the stakeholder groups would be compared to determine areas of agreement as well as areas of divergence

