

Key Insights
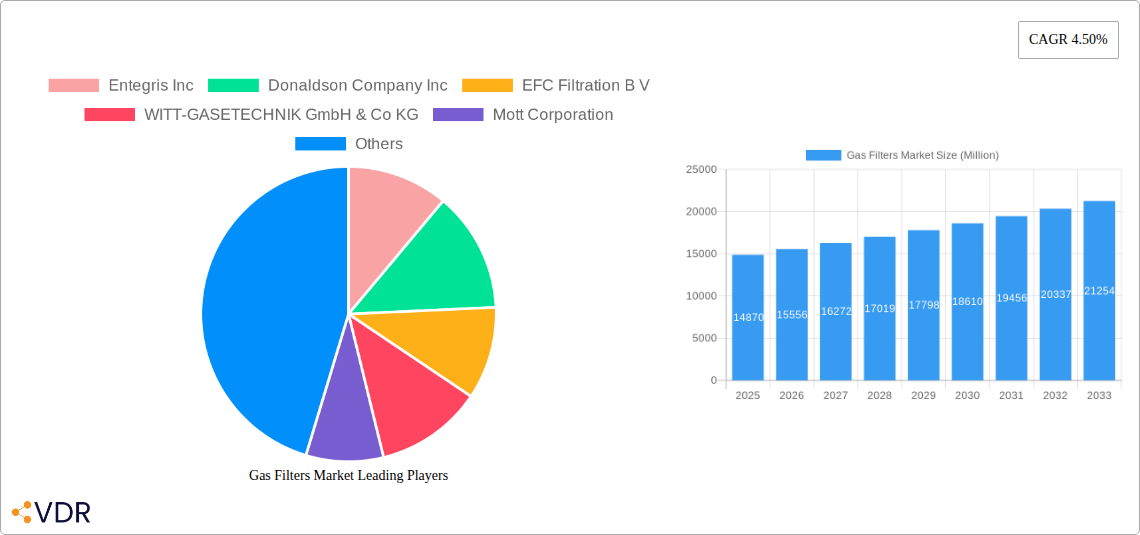
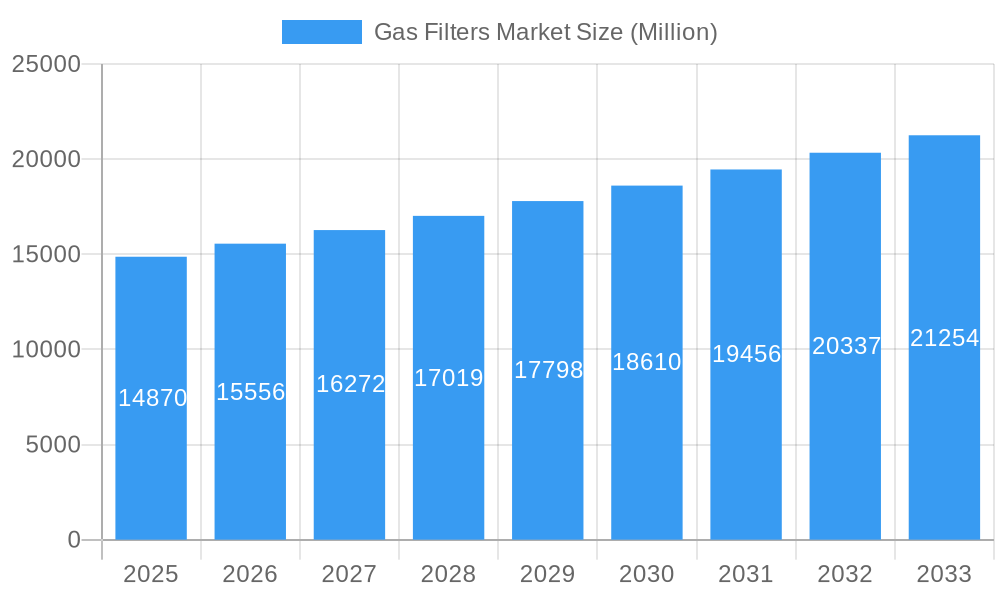
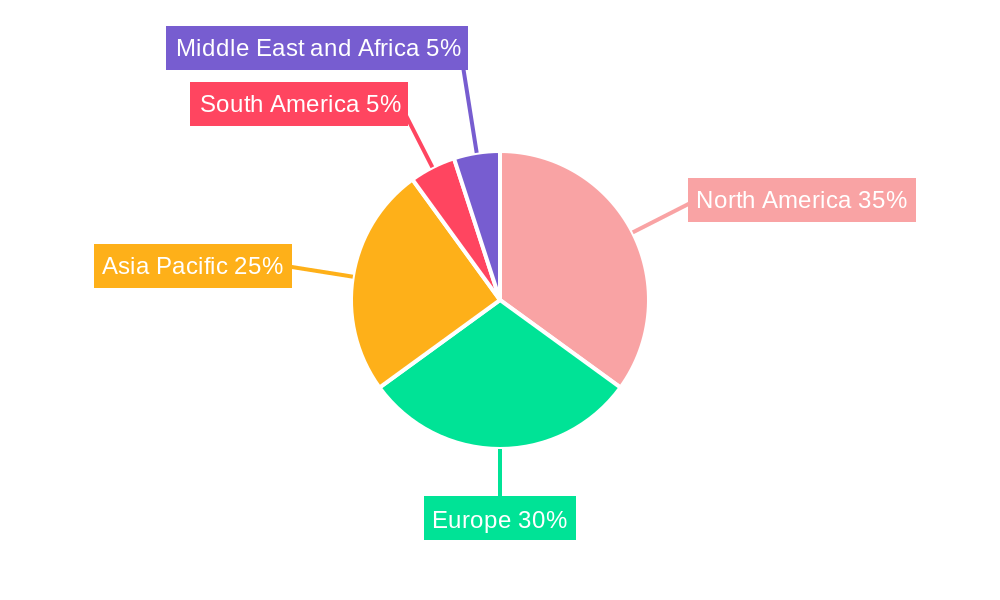
The global gas filters market, valued at $14.87 billion in 2025, is projected to experience robust growth, driven by increasing demand across diverse industries. The Compound Annual Growth Rate (CAGR) of 4.50% from 2025 to 2033 indicates a significant expansion, fueled primarily by the rising adoption of gas filtration technologies in the petroleum, chemical, and pharmaceutical sectors. Stringent environmental regulations and the growing emphasis on process efficiency are key drivers, compelling industries to invest in advanced gas filtration systems. The market is segmented by product type (Natural Gas Filter, Industrial Gas Filter, Compressed Gas Filter, High Purity Gas Filter) and application (Petroleum Industry, Chemical Industry, Food and Beverage, Pharmaceutical, Electronics, Others). North America and Europe currently hold significant market share, owing to established industrial infrastructure and stringent environmental norms. However, the Asia-Pacific region is anticipated to witness the fastest growth, propelled by rapid industrialization and increasing investments in manufacturing facilities. Competitive landscape analysis reveals key players like Entegris Inc., Donaldson Company Inc., and others actively engaged in technological advancements and strategic expansions to maintain their market position.
Gas Filters Market Market Size (In Billion)
The projected growth of the gas filter market is expected to be influenced by several factors. Continued technological innovation will likely lead to the development of more efficient and cost-effective gas filters, further stimulating market demand. Furthermore, the increasing awareness of air and gas quality among consumers and the stringent environmental regulations globally are anticipated to boost market growth. While potential restraints such as fluctuating raw material prices and the need for skilled labor might temporarily impact the market trajectory, the overall positive outlook indicates a promising future for the gas filters industry. The market is likely to see increasing consolidation as larger companies acquire smaller players to expand their product portfolios and geographic reach.
Gas Filters Market Company Market Share
Gas Filters Market: A Comprehensive Report (2019-2033)
This comprehensive report provides a detailed analysis of the Gas Filters Market, encompassing market dynamics, growth trends, regional segmentation, product landscape, key players, and future outlook. The study period covers 2019-2033, with 2025 as the base and estimated year. The report is crucial for industry professionals, investors, and stakeholders seeking a deep understanding of this dynamic market. The total market size in 2025 is estimated at xx Million units, projected to reach xx Million units by 2033.
Gas Filters Market Market Dynamics & Structure
The Gas Filters Market, encompassing parent markets like industrial filtration and child markets like natural gas processing, is characterized by moderate concentration, with key players like Entegris Inc, Donaldson Company Inc, and Parker Hannifin Corporation holding significant market share. Technological innovation, driven by stricter emission regulations and demand for higher purity gases, is a key driver. Regulatory frameworks, varying across regions, significantly impact market growth. Competitive substitutes, such as alternative purification technologies, pose a challenge. End-user demographics are diverse, spanning the petroleum, chemical, pharmaceutical, and electronics industries.
- Market Concentration: Moderately concentrated, with top 5 players holding approximately xx% market share in 2025.
- Technological Innovation: Focus on advanced filtration materials (e.g., nanomaterials) and improved efficiency.
- Regulatory Landscape: Stringent emission standards in developed regions drive demand.
- Competitive Landscape: Presence of alternative purification technologies creates competitive pressure.
- M&A Activity: xx M&A deals recorded between 2019-2024, indicating consolidation trends. (e.g., Rensa Filtration's acquisitions in 2023).
- Innovation Barriers: High R&D costs and stringent regulatory approvals.
Gas Filters Market Growth Trends & Insights
The Gas Filters Market exhibits a steady growth trajectory, driven by increasing industrialization, rising energy consumption, and stringent environmental regulations. The market size experienced a CAGR of xx% during the historical period (2019-2024) and is projected to maintain a CAGR of xx% during the forecast period (2025-2033). Adoption rates are particularly high in regions with robust industrial activity and stringent environmental policies. Technological disruptions, such as the development of more efficient and sustainable filtration technologies, are reshaping the market landscape. Consumer behavior shifts towards environmentally friendly solutions are also influencing market dynamics. Market penetration in emerging economies is expected to increase significantly in the coming years.
Dominant Regions, Countries, or Segments in Gas Filters Market
North America and Europe currently dominate the Gas Filters Market, driven by well-established industrial infrastructure and stringent environmental regulations. However, Asia-Pacific is experiencing rapid growth due to increasing industrialization and energy demand.
Dominant Product Type: Industrial Gas Filters hold the largest market share, owing to widespread application across various industries.
Dominant Application: The Petroleum Industry represents the largest application segment, followed by the Chemical Industry.
- North America: Strong regulatory environment and established industrial base drive market growth.
- Europe: High demand for high-purity gas filters in pharmaceutical and electronics industries.
- Asia-Pacific: Rapid industrialization and growing energy consumption fuel market expansion.
- Key Drivers: Stringent environmental regulations, increasing industrial output, rising energy demands.
Gas Filters Market Product Landscape
The Gas Filters Market offers a diverse range of products, categorized by filter type (natural gas, industrial gas, compressed gas, high-purity gas) and application. Recent innovations focus on improving filtration efficiency, reducing pressure drop, and extending filter life. Unique selling propositions include enhanced durability, customized designs, and integration with advanced monitoring systems. Technological advancements center on the use of novel materials and improved filter designs to achieve superior performance.
Key Drivers, Barriers & Challenges in Gas Filters Market
Key Drivers: Stringent environmental regulations mandating cleaner emissions, increasing demand for high-purity gases in various industries (e.g., electronics, pharmaceuticals), and advancements in filtration technologies.
Key Challenges: Fluctuations in raw material prices, intense competition, and the need for continuous technological innovation to meet evolving industry needs. Supply chain disruptions (e.g., xx% impact in 2022 due to raw material shortages) and regulatory hurdles in certain regions pose significant challenges.
Emerging Opportunities in Gas Filters Market
Emerging opportunities exist in untapped markets (e.g., developing economies), the development of specialized filters for niche applications (e.g., hydrogen purification), and the integration of gas filters with smart monitoring systems for predictive maintenance. Growing demand for sustainable and environmentally friendly filtration solutions also presents significant opportunities.
Growth Accelerators in the Gas Filters Market Industry
Technological advancements in filtration materials, strategic partnerships between filter manufacturers and end-users to develop customized solutions, and the expansion into new geographical markets are key growth accelerators. Government initiatives promoting cleaner energy and industrial emissions reduction further stimulate market growth.
Key Players Shaping the Gas Filters Market Market
- Entegris Inc
- Donaldson Company Inc
- EFC Filtration B V
- WITT-GASETECHNIK GmbH & Co KG
- Mott Corporation
- Parker Hannifin Corporation
Notable Milestones in Gas Filters Market Sector
- September 2023: Rensa Filtration's acquisitions of APC Filtration and R.P. Fedder expand its capabilities in high-tech filtration.
- July 2022: Parker Hannifin secures a contract to supply gas turbine filtration systems for an FPSO vessel, highlighting growth in offshore oil and gas applications.
In-Depth Gas Filters Market Market Outlook
The Gas Filters Market is poised for sustained growth, driven by continuous industrial expansion, stricter environmental regulations, and technological advancements. Strategic partnerships, investments in R&D, and expansion into emerging markets will be crucial for companies to capitalize on future opportunities. The market's long-term outlook remains positive, with significant potential for growth in various segments and regions.
Gas Filters Market Segmentation
-
1. Product Type
- 1.1. Natural Gas Filter
- 1.2. Industrial Gas Filter
- 1.3. Compressed Gas Filter
- 1.4. High Purity Gas Filter
-
2. Application
- 2.1. Petroleum Industry
- 2.2. Chemical Industry
- 2.3. Food and Beverage
- 2.4. Pharmaceutical
- 2.5. Electronics
- 2.6. Others
Gas Filters Market Segmentation By Geography
-
1. North America
- 1.1. United States
- 1.2. Canada
- 1.3. Rest of North America
-
2. Europe
- 2.1. Germany
- 2.2. France
- 2.3. United Kingdom
- 2.4. Rest of Europe
-
3. Asia Pacific
- 3.1. China
- 3.2. India
- 3.3. Japan
- 3.4. South Korea
- 3.5. Rest of Asia Pacific
-
4. South America
- 4.1. Brazil
- 4.2. Argentina
- 4.3. Rest of South America
-
5. Middle East and Africa
- 5.1. Saudi Arabia
- 5.2. United Arab Emirates
- 5.3. South Africa
- 5.4. Rest of Middle East and Africa
Gas Filters Market Regional Market Share
Geographic Coverage of Gas Filters Market
Gas Filters Market REPORT HIGHLIGHTS
| Aspects | Details |
|---|---|
| Study Period | 2020-2034 |
| Base Year | 2025 |
| Estimated Year | 2026 |
| Forecast Period | 2026-2034 |
| Historical Period | 2020-2025 |
| Growth Rate | CAGR of 4.50% from 2020-2034 |
| Segmentation |
|
Table of Contents
- 1. Introduction
- 1.1. Research Scope
- 1.2. Market Segmentation
- 1.3. Research Objective
- 1.4. Definitions and Assumptions
- 2. Executive Summary
- 2.1. Market Snapshot
- 3. Market Dynamics
- 3.1. Market Drivers
- 3.2. Market Restrains
- 3.3. Market Trends
- 3.4. Market Opportunities
- 4. Market Factor Analysis
- 4.1. Porters Five Forces
- 4.1.1. Bargaining Power of Suppliers
- 4.1.2. Bargaining Power of Buyers
- 4.1.3. Threat of New Entrants
- 4.1.4. Threat of Substitutes
- 4.1.5. Competitive Rivalry
- 4.2. PESTEL analysis
- 4.3. BCG Analysis
- 4.3.1. Stars (High Growth, High Market Share)
- 4.3.2. Cash Cows (Low Growth, High Market Share)
- 4.3.3. Question Mark (High Growth, Low Market Share)
- 4.3.4. Dogs (Low Growth, Low Market Share)
- 4.4. Ansoff Matrix Analysis
- 4.5. Supply Chain Analysis
- 4.6. Regulatory Landscape
- 4.7. Current Market Potential and Opportunity Assessment (TAM–SAM–SOM Framework)
- 4.8. VDR Analyst Note
- 4.1. Porters Five Forces
- 5. Market Analysis, Insights and Forecast 2021-2033
- 5.1. Market Analysis, Insights and Forecast - by Product Type
- 5.1.1. Natural Gas Filter
- 5.1.2. Industrial Gas Filter
- 5.1.3. Compressed Gas Filter
- 5.1.4. High Purity Gas Filter
- 5.2. Market Analysis, Insights and Forecast - by Application
- 5.2.1. Petroleum Industry
- 5.2.2. Chemical Industry
- 5.2.3. Food and Beverage
- 5.2.4. Pharmaceutical
- 5.2.5. Electronics
- 5.2.6. Others
- 5.3. Market Analysis, Insights and Forecast - by Region
- 5.3.1. North America
- 5.3.2. Europe
- 5.3.3. Asia Pacific
- 5.3.4. South America
- 5.3.5. Middle East and Africa
- 5.1. Market Analysis, Insights and Forecast - by Product Type
- 6. Global Gas Filters Market Analysis, Insights and Forecast, 2021-2033
- 6.1. Market Analysis, Insights and Forecast - by Product Type
- 6.1.1. Natural Gas Filter
- 6.1.2. Industrial Gas Filter
- 6.1.3. Compressed Gas Filter
- 6.1.4. High Purity Gas Filter
- 6.2. Market Analysis, Insights and Forecast - by Application
- 6.2.1. Petroleum Industry
- 6.2.2. Chemical Industry
- 6.2.3. Food and Beverage
- 6.2.4. Pharmaceutical
- 6.2.5. Electronics
- 6.2.6. Others
- 6.1. Market Analysis, Insights and Forecast - by Product Type
- 7. North America Gas Filters Market Analysis, Insights and Forecast, 2021-2033
- 7.1. Market Analysis, Insights and Forecast - by Product Type
- 7.1.1. Natural Gas Filter
- 7.1.2. Industrial Gas Filter
- 7.1.3. Compressed Gas Filter
- 7.1.4. High Purity Gas Filter
- 7.2. Market Analysis, Insights and Forecast - by Application
- 7.2.1. Petroleum Industry
- 7.2.2. Chemical Industry
- 7.2.3. Food and Beverage
- 7.2.4. Pharmaceutical
- 7.2.5. Electronics
- 7.2.6. Others
- 7.1. Market Analysis, Insights and Forecast - by Product Type
- 8. Europe Gas Filters Market Analysis, Insights and Forecast, 2021-2033
- 8.1. Market Analysis, Insights and Forecast - by Product Type
- 8.1.1. Natural Gas Filter
- 8.1.2. Industrial Gas Filter
- 8.1.3. Compressed Gas Filter
- 8.1.4. High Purity Gas Filter
- 8.2. Market Analysis, Insights and Forecast - by Application
- 8.2.1. Petroleum Industry
- 8.2.2. Chemical Industry
- 8.2.3. Food and Beverage
- 8.2.4. Pharmaceutical
- 8.2.5. Electronics
- 8.2.6. Others
- 8.1. Market Analysis, Insights and Forecast - by Product Type
- 9. Asia Pacific Gas Filters Market Analysis, Insights and Forecast, 2021-2033
- 9.1. Market Analysis, Insights and Forecast - by Product Type
- 9.1.1. Natural Gas Filter
- 9.1.2. Industrial Gas Filter
- 9.1.3. Compressed Gas Filter
- 9.1.4. High Purity Gas Filter
- 9.2. Market Analysis, Insights and Forecast - by Application
- 9.2.1. Petroleum Industry
- 9.2.2. Chemical Industry
- 9.2.3. Food and Beverage
- 9.2.4. Pharmaceutical
- 9.2.5. Electronics
- 9.2.6. Others
- 9.1. Market Analysis, Insights and Forecast - by Product Type
- 10. South America Gas Filters Market Analysis, Insights and Forecast, 2021-2033
- 10.1. Market Analysis, Insights and Forecast - by Product Type
- 10.1.1. Natural Gas Filter
- 10.1.2. Industrial Gas Filter
- 10.1.3. Compressed Gas Filter
- 10.1.4. High Purity Gas Filter
- 10.2. Market Analysis, Insights and Forecast - by Application
- 10.2.1. Petroleum Industry
- 10.2.2. Chemical Industry
- 10.2.3. Food and Beverage
- 10.2.4. Pharmaceutical
- 10.2.5. Electronics
- 10.2.6. Others
- 10.1. Market Analysis, Insights and Forecast - by Product Type
- 11. Middle East and Africa Gas Filters Market Analysis, Insights and Forecast, 2021-2033
- 11.1. Market Analysis, Insights and Forecast - by Product Type
- 11.1.1. Natural Gas Filter
- 11.1.2. Industrial Gas Filter
- 11.1.3. Compressed Gas Filter
- 11.1.4. High Purity Gas Filter
- 11.2. Market Analysis, Insights and Forecast - by Application
- 11.2.1. Petroleum Industry
- 11.2.2. Chemical Industry
- 11.2.3. Food and Beverage
- 11.2.4. Pharmaceutical
- 11.2.5. Electronics
- 11.2.6. Others
- 11.1. Market Analysis, Insights and Forecast - by Product Type
- 12. Competitive Analysis
- 12.1. Company Profiles
- 12.1.1 Entegris Inc
- 12.1.1.1. Company Overview
- 12.1.1.2. Products
- 12.1.1.3. Company Financials
- 12.1.1.4. SWOT Analysis
- 12.1.2 Donaldson Company Inc
- 12.1.2.1. Company Overview
- 12.1.2.2. Products
- 12.1.2.3. Company Financials
- 12.1.2.4. SWOT Analysis
- 12.1.3 EFC Filtration B V
- 12.1.3.1. Company Overview
- 12.1.3.2. Products
- 12.1.3.3. Company Financials
- 12.1.3.4. SWOT Analysis
- 12.1.4 WITT-GASETECHNIK GmbH & Co KG
- 12.1.4.1. Company Overview
- 12.1.4.2. Products
- 12.1.4.3. Company Financials
- 12.1.4.4. SWOT Analysis
- 12.1.5 Mott Corporation
- 12.1.5.1. Company Overview
- 12.1.5.2. Products
- 12.1.5.3. Company Financials
- 12.1.5.4. SWOT Analysis
- 12.1.6 Parker Hannifin Corporation
- 12.1.6.1. Company Overview
- 12.1.6.2. Products
- 12.1.6.3. Company Financials
- 12.1.6.4. SWOT Analysis
- 12.1.1 Entegris Inc
- 12.2. Market Entropy
- 12.2.1 Company's Key Areas Served
- 12.2.2 Recent Developments
- 12.3. Company Market Share Analysis 2025
- 12.3.1 Top 5 Companies Market Share Analysis
- 12.3.2 Top 3 Companies Market Share Analysis
- 12.4. List of Potential Customers
- 13. Research Methodology
List of Figures
- Figure 1: Global Gas Filters Market Revenue Breakdown (Million, %) by Region 2025 & 2033
- Figure 2: Global Gas Filters Market Volume Breakdown (K Unit, %) by Region 2025 & 2033
- Figure 3: North America Gas Filters Market Revenue (Million), by Product Type 2025 & 2033
- Figure 4: North America Gas Filters Market Volume (K Unit), by Product Type 2025 & 2033
- Figure 5: North America Gas Filters Market Revenue Share (%), by Product Type 2025 & 2033
- Figure 6: North America Gas Filters Market Volume Share (%), by Product Type 2025 & 2033
- Figure 7: North America Gas Filters Market Revenue (Million), by Application 2025 & 2033
- Figure 8: North America Gas Filters Market Volume (K Unit), by Application 2025 & 2033
- Figure 9: North America Gas Filters Market Revenue Share (%), by Application 2025 & 2033
- Figure 10: North America Gas Filters Market Volume Share (%), by Application 2025 & 2033
- Figure 11: North America Gas Filters Market Revenue (Million), by Country 2025 & 2033
- Figure 12: North America Gas Filters Market Volume (K Unit), by Country 2025 & 2033
- Figure 13: North America Gas Filters Market Revenue Share (%), by Country 2025 & 2033
- Figure 14: North America Gas Filters Market Volume Share (%), by Country 2025 & 2033
- Figure 15: Europe Gas Filters Market Revenue (Million), by Product Type 2025 & 2033
- Figure 16: Europe Gas Filters Market Volume (K Unit), by Product Type 2025 & 2033
- Figure 17: Europe Gas Filters Market Revenue Share (%), by Product Type 2025 & 2033
- Figure 18: Europe Gas Filters Market Volume Share (%), by Product Type 2025 & 2033
- Figure 19: Europe Gas Filters Market Revenue (Million), by Application 2025 & 2033
- Figure 20: Europe Gas Filters Market Volume (K Unit), by Application 2025 & 2033
- Figure 21: Europe Gas Filters Market Revenue Share (%), by Application 2025 & 2033
- Figure 22: Europe Gas Filters Market Volume Share (%), by Application 2025 & 2033
- Figure 23: Europe Gas Filters Market Revenue (Million), by Country 2025 & 2033
- Figure 24: Europe Gas Filters Market Volume (K Unit), by Country 2025 & 2033
- Figure 25: Europe Gas Filters Market Revenue Share (%), by Country 2025 & 2033
- Figure 26: Europe Gas Filters Market Volume Share (%), by Country 2025 & 2033
- Figure 27: Asia Pacific Gas Filters Market Revenue (Million), by Product Type 2025 & 2033
- Figure 28: Asia Pacific Gas Filters Market Volume (K Unit), by Product Type 2025 & 2033
- Figure 29: Asia Pacific Gas Filters Market Revenue Share (%), by Product Type 2025 & 2033
- Figure 30: Asia Pacific Gas Filters Market Volume Share (%), by Product Type 2025 & 2033
- Figure 31: Asia Pacific Gas Filters Market Revenue (Million), by Application 2025 & 2033
- Figure 32: Asia Pacific Gas Filters Market Volume (K Unit), by Application 2025 & 2033
- Figure 33: Asia Pacific Gas Filters Market Revenue Share (%), by Application 2025 & 2033
- Figure 34: Asia Pacific Gas Filters Market Volume Share (%), by Application 2025 & 2033
- Figure 35: Asia Pacific Gas Filters Market Revenue (Million), by Country 2025 & 2033
- Figure 36: Asia Pacific Gas Filters Market Volume (K Unit), by Country 2025 & 2033
- Figure 37: Asia Pacific Gas Filters Market Revenue Share (%), by Country 2025 & 2033
- Figure 38: Asia Pacific Gas Filters Market Volume Share (%), by Country 2025 & 2033
- Figure 39: South America Gas Filters Market Revenue (Million), by Product Type 2025 & 2033
- Figure 40: South America Gas Filters Market Volume (K Unit), by Product Type 2025 & 2033
- Figure 41: South America Gas Filters Market Revenue Share (%), by Product Type 2025 & 2033
- Figure 42: South America Gas Filters Market Volume Share (%), by Product Type 2025 & 2033
- Figure 43: South America Gas Filters Market Revenue (Million), by Application 2025 & 2033
- Figure 44: South America Gas Filters Market Volume (K Unit), by Application 2025 & 2033
- Figure 45: South America Gas Filters Market Revenue Share (%), by Application 2025 & 2033
- Figure 46: South America Gas Filters Market Volume Share (%), by Application 2025 & 2033
- Figure 47: South America Gas Filters Market Revenue (Million), by Country 2025 & 2033
- Figure 48: South America Gas Filters Market Volume (K Unit), by Country 2025 & 2033
- Figure 49: South America Gas Filters Market Revenue Share (%), by Country 2025 & 2033
- Figure 50: South America Gas Filters Market Volume Share (%), by Country 2025 & 2033
- Figure 51: Middle East and Africa Gas Filters Market Revenue (Million), by Product Type 2025 & 2033
- Figure 52: Middle East and Africa Gas Filters Market Volume (K Unit), by Product Type 2025 & 2033
- Figure 53: Middle East and Africa Gas Filters Market Revenue Share (%), by Product Type 2025 & 2033
- Figure 54: Middle East and Africa Gas Filters Market Volume Share (%), by Product Type 2025 & 2033
- Figure 55: Middle East and Africa Gas Filters Market Revenue (Million), by Application 2025 & 2033
- Figure 56: Middle East and Africa Gas Filters Market Volume (K Unit), by Application 2025 & 2033
- Figure 57: Middle East and Africa Gas Filters Market Revenue Share (%), by Application 2025 & 2033
- Figure 58: Middle East and Africa Gas Filters Market Volume Share (%), by Application 2025 & 2033
- Figure 59: Middle East and Africa Gas Filters Market Revenue (Million), by Country 2025 & 2033
- Figure 60: Middle East and Africa Gas Filters Market Volume (K Unit), by Country 2025 & 2033
- Figure 61: Middle East and Africa Gas Filters Market Revenue Share (%), by Country 2025 & 2033
- Figure 62: Middle East and Africa Gas Filters Market Volume Share (%), by Country 2025 & 2033
List of Tables
- Table 1: Global Gas Filters Market Revenue Million Forecast, by Product Type 2020 & 2033
- Table 2: Global Gas Filters Market Volume K Unit Forecast, by Product Type 2020 & 2033
- Table 3: Global Gas Filters Market Revenue Million Forecast, by Application 2020 & 2033
- Table 4: Global Gas Filters Market Volume K Unit Forecast, by Application 2020 & 2033
- Table 5: Global Gas Filters Market Revenue Million Forecast, by Region 2020 & 2033
- Table 6: Global Gas Filters Market Volume K Unit Forecast, by Region 2020 & 2033
- Table 7: Global Gas Filters Market Revenue Million Forecast, by Product Type 2020 & 2033
- Table 8: Global Gas Filters Market Volume K Unit Forecast, by Product Type 2020 & 2033
- Table 9: Global Gas Filters Market Revenue Million Forecast, by Application 2020 & 2033
- Table 10: Global Gas Filters Market Volume K Unit Forecast, by Application 2020 & 2033
- Table 11: Global Gas Filters Market Revenue Million Forecast, by Country 2020 & 2033
- Table 12: Global Gas Filters Market Volume K Unit Forecast, by Country 2020 & 2033
- Table 13: United States Gas Filters Market Revenue (Million) Forecast, by Application 2020 & 2033
- Table 14: United States Gas Filters Market Volume (K Unit) Forecast, by Application 2020 & 2033
- Table 15: Canada Gas Filters Market Revenue (Million) Forecast, by Application 2020 & 2033
- Table 16: Canada Gas Filters Market Volume (K Unit) Forecast, by Application 2020 & 2033
- Table 17: Rest of North America Gas Filters Market Revenue (Million) Forecast, by Application 2020 & 2033
- Table 18: Rest of North America Gas Filters Market Volume (K Unit) Forecast, by Application 2020 & 2033
- Table 19: Global Gas Filters Market Revenue Million Forecast, by Product Type 2020 & 2033
- Table 20: Global Gas Filters Market Volume K Unit Forecast, by Product Type 2020 & 2033
- Table 21: Global Gas Filters Market Revenue Million Forecast, by Application 2020 & 2033
- Table 22: Global Gas Filters Market Volume K Unit Forecast, by Application 2020 & 2033
- Table 23: Global Gas Filters Market Revenue Million Forecast, by Country 2020 & 2033
- Table 24: Global Gas Filters Market Volume K Unit Forecast, by Country 2020 & 2033
- Table 25: Germany Gas Filters Market Revenue (Million) Forecast, by Application 2020 & 2033
- Table 26: Germany Gas Filters Market Volume (K Unit) Forecast, by Application 2020 & 2033
- Table 27: France Gas Filters Market Revenue (Million) Forecast, by Application 2020 & 2033
- Table 28: France Gas Filters Market Volume (K Unit) Forecast, by Application 2020 & 2033
- Table 29: United Kingdom Gas Filters Market Revenue (Million) Forecast, by Application 2020 & 2033
- Table 30: United Kingdom Gas Filters Market Volume (K Unit) Forecast, by Application 2020 & 2033
- Table 31: Rest of Europe Gas Filters Market Revenue (Million) Forecast, by Application 2020 & 2033
- Table 32: Rest of Europe Gas Filters Market Volume (K Unit) Forecast, by Application 2020 & 2033
- Table 33: Global Gas Filters Market Revenue Million Forecast, by Product Type 2020 & 2033
- Table 34: Global Gas Filters Market Volume K Unit Forecast, by Product Type 2020 & 2033
- Table 35: Global Gas Filters Market Revenue Million Forecast, by Application 2020 & 2033
- Table 36: Global Gas Filters Market Volume K Unit Forecast, by Application 2020 & 2033
- Table 37: Global Gas Filters Market Revenue Million Forecast, by Country 2020 & 2033
- Table 38: Global Gas Filters Market Volume K Unit Forecast, by Country 2020 & 2033
- Table 39: China Gas Filters Market Revenue (Million) Forecast, by Application 2020 & 2033
- Table 40: China Gas Filters Market Volume (K Unit) Forecast, by Application 2020 & 2033
- Table 41: India Gas Filters Market Revenue (Million) Forecast, by Application 2020 & 2033
- Table 42: India Gas Filters Market Volume (K Unit) Forecast, by Application 2020 & 2033
- Table 43: Japan Gas Filters Market Revenue (Million) Forecast, by Application 2020 & 2033
- Table 44: Japan Gas Filters Market Volume (K Unit) Forecast, by Application 2020 & 2033
- Table 45: South Korea Gas Filters Market Revenue (Million) Forecast, by Application 2020 & 2033
- Table 46: South Korea Gas Filters Market Volume (K Unit) Forecast, by Application 2020 & 2033
- Table 47: Rest of Asia Pacific Gas Filters Market Revenue (Million) Forecast, by Application 2020 & 2033
- Table 48: Rest of Asia Pacific Gas Filters Market Volume (K Unit) Forecast, by Application 2020 & 2033
- Table 49: Global Gas Filters Market Revenue Million Forecast, by Product Type 2020 & 2033
- Table 50: Global Gas Filters Market Volume K Unit Forecast, by Product Type 2020 & 2033
- Table 51: Global Gas Filters Market Revenue Million Forecast, by Application 2020 & 2033
- Table 52: Global Gas Filters Market Volume K Unit Forecast, by Application 2020 & 2033
- Table 53: Global Gas Filters Market Revenue Million Forecast, by Country 2020 & 2033
- Table 54: Global Gas Filters Market Volume K Unit Forecast, by Country 2020 & 2033
- Table 55: Brazil Gas Filters Market Revenue (Million) Forecast, by Application 2020 & 2033
- Table 56: Brazil Gas Filters Market Volume (K Unit) Forecast, by Application 2020 & 2033
- Table 57: Argentina Gas Filters Market Revenue (Million) Forecast, by Application 2020 & 2033
- Table 58: Argentina Gas Filters Market Volume (K Unit) Forecast, by Application 2020 & 2033
- Table 59: Rest of South America Gas Filters Market Revenue (Million) Forecast, by Application 2020 & 2033
- Table 60: Rest of South America Gas Filters Market Volume (K Unit) Forecast, by Application 2020 & 2033
- Table 61: Global Gas Filters Market Revenue Million Forecast, by Product Type 2020 & 2033
- Table 62: Global Gas Filters Market Volume K Unit Forecast, by Product Type 2020 & 2033
- Table 63: Global Gas Filters Market Revenue Million Forecast, by Application 2020 & 2033
- Table 64: Global Gas Filters Market Volume K Unit Forecast, by Application 2020 & 2033
- Table 65: Global Gas Filters Market Revenue Million Forecast, by Country 2020 & 2033
- Table 66: Global Gas Filters Market Volume K Unit Forecast, by Country 2020 & 2033
- Table 67: Saudi Arabia Gas Filters Market Revenue (Million) Forecast, by Application 2020 & 2033
- Table 68: Saudi Arabia Gas Filters Market Volume (K Unit) Forecast, by Application 2020 & 2033
- Table 69: United Arab Emirates Gas Filters Market Revenue (Million) Forecast, by Application 2020 & 2033
- Table 70: United Arab Emirates Gas Filters Market Volume (K Unit) Forecast, by Application 2020 & 2033
- Table 71: South Africa Gas Filters Market Revenue (Million) Forecast, by Application 2020 & 2033
- Table 72: South Africa Gas Filters Market Volume (K Unit) Forecast, by Application 2020 & 2033
- Table 73: Rest of Middle East and Africa Gas Filters Market Revenue (Million) Forecast, by Application 2020 & 2033
- Table 74: Rest of Middle East and Africa Gas Filters Market Volume (K Unit) Forecast, by Application 2020 & 2033
Frequently Asked Questions
1. What is the projected Compound Annual Growth Rate (CAGR) of the Gas Filters Market?
The projected CAGR is approximately 4.50%.
2. Which companies are prominent players in the Gas Filters Market?
Key companies in the market include Entegris Inc, Donaldson Company Inc, EFC Filtration B V, WITT-GASETECHNIK GmbH & Co KG, Mott Corporation, Parker Hannifin Corporation.
3. What are the main segments of the Gas Filters Market?
The market segments include Product Type, Application.
4. Can you provide details about the market size?
The market size is estimated to be USD 14.87 Million as of 2022.
5. What are some drivers contributing to market growth?
Rising Industrialization across the Globe4.; Increasing Utilization of Natural Gas.
6. What are the notable trends driving market growth?
Natural Gas Filter Segment to Witness Growth.
7. Are there any restraints impacting market growth?
High Cost of Installation and Maintenance.
8. Can you provide examples of recent developments in the market?
September 2023, Rensa Filtration, a manufacturer of consumable, mission-critical air filtration products, announced that it recently concluded two strategic acquisitions of APC Filtration, in Ontario, Canada, and R.P. Fedder in Rochester, New York. Rensa’s Custom Filter’s capabilities range from HEPA to the highest ULPA grades, molecular/gas phase filtration for medical and high technology applications.
9. What pricing options are available for accessing the report?
Pricing options include single-user, multi-user, and enterprise licenses priced at USD 4750, USD 5250, and USD 8750 respectively.
10. Is the market size provided in terms of value or volume?
The market size is provided in terms of value, measured in Million and volume, measured in K Unit.
11. Are there any specific market keywords associated with the report?
Yes, the market keyword associated with the report is "Gas Filters Market," which aids in identifying and referencing the specific market segment covered.
12. How do I determine which pricing option suits my needs best?
The pricing options vary based on user requirements and access needs. Individual users may opt for single-user licenses, while businesses requiring broader access may choose multi-user or enterprise licenses for cost-effective access to the report.
13. Are there any additional resources or data provided in the Gas Filters Market report?
While the report offers comprehensive insights, it's advisable to review the specific contents or supplementary materials provided to ascertain if additional resources or data are available.
14. How can I stay updated on further developments or reports in the Gas Filters Market?
To stay informed about further developments, trends, and reports in the Gas Filters Market, consider subscribing to industry newsletters, following relevant companies and organizations, or regularly checking reputable industry news sources and publications.
Methodology
Step 1 - Identification of Relevant Samples Size from Population Database


Step 2 - Approaches for Defining Global Market Size (Value, Volume* & Price*)

Note*: In applicable scenarios
Step 3 - Data Sources
Primary Research
- Web Analytics
- Survey Reports
- Research Institute
- Latest Research Reports
- Opinion Leaders
Secondary Research
- Annual Reports
- White Paper
- Latest Press Release
- Industry Association
- Paid Database
- Investor Presentations

Step 4 - Data Triangulation
Involves using different sources of information in order to increase the validity of a study
These sources are likely to be stakeholders in a program - participants, other researchers, program staff, other community members, and so on.
Then we put all data in single framework & apply various statistical tools to find out the dynamic on the market.
During the analysis stage, feedback from the stakeholder groups would be compared to determine areas of agreement as well as areas of divergence