

Key Insights
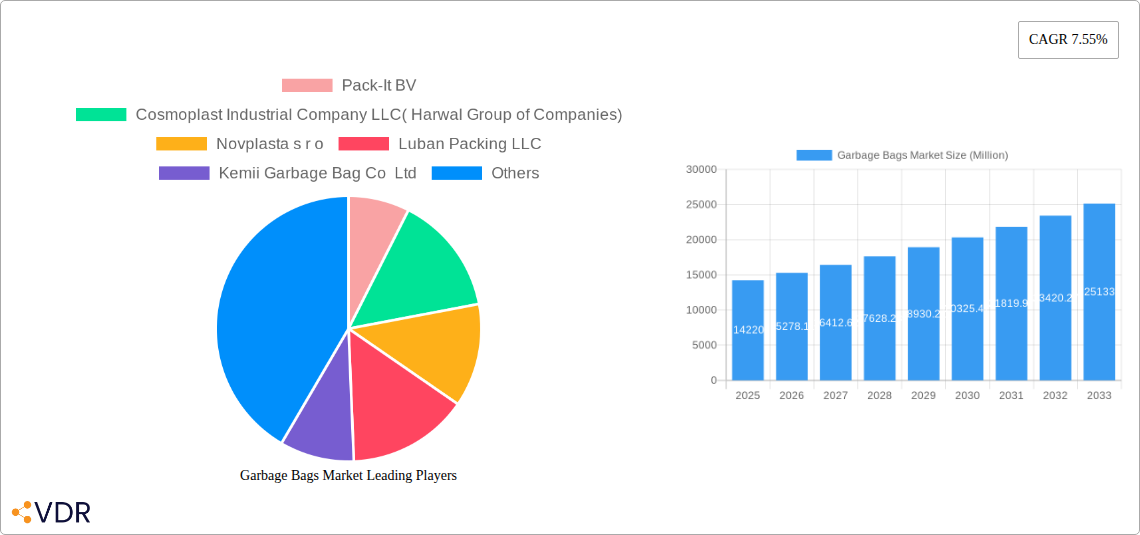
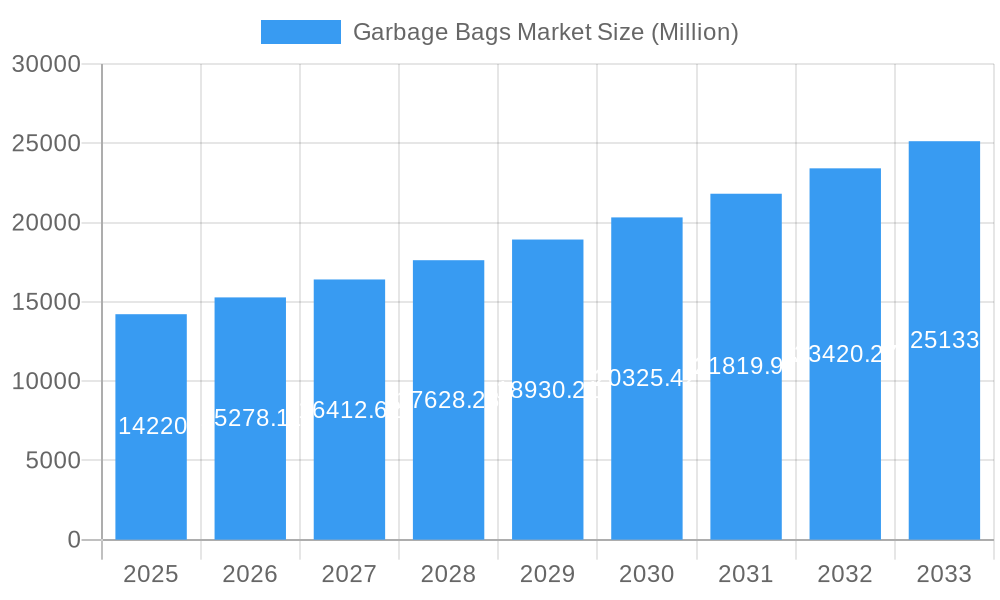
The global garbage bag market, valued at $14.22 billion in 2025, is projected to experience robust growth, driven by a Compound Annual Growth Rate (CAGR) of 7.55% from 2025 to 2033. This expansion is fueled by several key factors. Rising urbanization and increasing waste generation globally are primary drivers, necessitating efficient and hygienic waste disposal solutions. Growing environmental awareness is also pushing demand for biodegradable and eco-friendly garbage bags, a significant trend shaping the market landscape. Furthermore, the rise of e-commerce and online retail contributes to increased packaging waste and subsequently, a higher demand for garbage bags. The retail sector remains a dominant end-user industry, followed by institutional and industrial segments. Competitive pressures from established players like Berry Global Inc., Hefty (Reynolds Consumer Products LLC), and Novolex, alongside emerging regional manufacturers, are shaping market dynamics. However, fluctuations in raw material prices, particularly resin, pose a significant restraint on market growth. Further, stringent government regulations regarding plastic waste management in certain regions present both challenges and opportunities for innovation in sustainable garbage bag production.
Garbage Bags Market Market Size (In Billion)
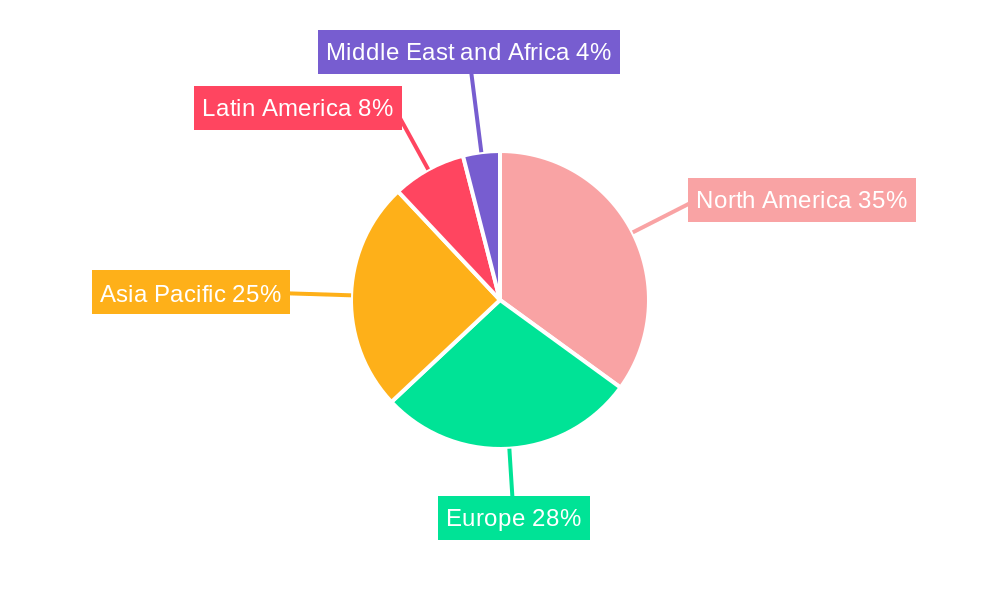
The regional distribution of the market reveals significant variations. North America and Europe currently hold substantial market share, benefiting from established infrastructure and high per capita waste generation. However, the Asia-Pacific region is anticipated to demonstrate the highest growth rate during the forecast period, driven by rapid urbanization, economic development, and rising disposable incomes in countries like India and China. Latin America and the Middle East & Africa also present promising opportunities, though market penetration may be slower due to varying levels of infrastructure development and consumer awareness. The market segmentation by end-user industries (retail, institutional, industrial) highlights distinct growth trajectories, with the retail sector remaining the primary driver due to high volume consumption. Strategic initiatives focusing on sustainable materials, innovative designs, and efficient distribution channels will be crucial for manufacturers seeking to capitalize on the market's growth potential in the coming years.
Garbage Bags Market Company Market Share
Garbage Bags Market: A Comprehensive Report (2019-2033)
This in-depth report provides a comprehensive analysis of the global Garbage Bags Market, covering market dynamics, growth trends, regional insights, and key player strategies. With a focus on the parent market of packaging and the child market of waste management solutions, this report offers invaluable insights for industry professionals, investors, and strategic decision-makers. The study period spans from 2019 to 2033, with 2025 as the base and estimated year. The forecast period is 2025-2033 and the historical period is 2019-2024. The market size is presented in million units.
Garbage Bags Market Dynamics & Structure
This section analyzes the competitive landscape, technological advancements, regulatory influences, and market trends within the garbage bag industry. We delve into market concentration, examining the market share held by leading players such as Pack-It BV, Cosmoplast Industrial Company LLC (Harwal Group of Companies), Novplasta s r o, Luban Packing LLC, Kemii Garbage Bag Co Ltd, Berry Global Inc, International Plastics Inc, Hefty (Reynolds Consumer Products LLC), Novolex, and Terdex GmbH. The report explores the impact of mergers and acquisitions (M&A) activities, quantifying deal volumes where possible and assessing their influence on market structure.
- Market Concentration: xx% controlled by top 5 players in 2024.
- Technological Innovation: Focus on biodegradable and compostable materials driving innovation.
- Regulatory Frameworks: Analysis of environmental regulations impacting material choices and production.
- Competitive Substitutes: Examination of alternative waste disposal solutions and their market impact.
- End-User Demographics: Segmentation by retail, institutional, and industrial end-users.
- M&A Trends: xx M&A deals observed between 2019 and 2024, with a predicted xx increase by 2033.
Garbage Bags Market Growth Trends & Insights
This section provides a detailed analysis of the Garbage Bags Market's growth trajectory, using quantitative data and qualitative insights. We examine the market size evolution from 2019 to 2024, projecting its expansion through 2033. The analysis incorporates factors such as CAGR, market penetration rates across different segments, technological disruptions (e.g., advancements in bioplastic technology), and evolving consumer preferences towards sustainable packaging. The report analyzes the impact of increased environmental awareness and the shift towards eco-friendly alternatives. Specific data on adoption rates and consumer behavior changes will be provided, showing a predicted xx% increase in demand for eco-friendly bags by 2033. The impact of economic fluctuations and their correlation with garbage bag consumption will also be assessed.
Dominant Regions, Countries, or Segments in Garbage Bags Market
This section identifies the leading regions, countries, and segments within the Garbage Bags Market, focusing on the By End-user Industries: Retail, Institutional, and Industrial sectors. The analysis focuses on market share, growth potential, and key drivers specific to each segment. For instance, the Retail segment's growth will be analyzed in relation to factors like consumer spending and packaging preferences. The Institutional segment’s growth drivers will be examined in terms of government policies and waste management initiatives. The Industrial segment will be explored in terms of manufacturing activities and specific industry demands.
- Retail: High growth potential driven by increasing disposable income and consumer packaged goods (CPG) consumption. The retail segment is predicted to hold xx% market share in 2033.
- Institutional: Growth is influenced by government regulations, waste management infrastructure, and public sector spending. The Institutional segment is projected to have xx% market share in 2033.
- Industrial: This segment's growth is tied to industrial production levels and specific packaging needs across various industries. The industrial segment is estimated to have a xx% market share in 2033.
Garbage Bags Market Product Landscape
This section offers a concise overview of the current garbage bag product landscape, including innovative materials (e.g., biodegradable plastics, oxo-biodegradable plastics), various sizes and thicknesses, and the incorporation of features enhancing usability and environmental impact. Key advancements in manufacturing processes and material science that enhance product performance and reduce environmental footprint will be highlighted. The report will also cover the unique selling propositions of various garbage bag types, focusing on their applications and the benefits they offer to end-users.
Key Drivers, Barriers & Challenges in Garbage Bags Market
This section details the forces driving market growth and the obstacles hindering its expansion. Key drivers include increased awareness of waste management, stringent environmental regulations, and rising demand for sustainable packaging. Conversely, challenges include fluctuating raw material prices, competition from alternative waste disposal solutions, and the need for technological breakthroughs in biodegradable materials. Supply chain disruptions and their impact on production and pricing will also be thoroughly assessed. The quantifiable impact of each challenge on market growth will be presented as a percentage in relation to the overall market performance.
Emerging Opportunities in Garbage Bags Market
This section identifies opportunities for growth within the Garbage Bags Market. These opportunities include the development of innovative, sustainable materials, expansion into untapped markets, and catering to the growing demand for customized and specialized garbage bags. The rising popularity of e-commerce and its related packaging needs will also be analyzed as a potential growth driver.
Growth Accelerators in the Garbage Bags Market Industry
Long-term growth in the garbage bags market will be driven by strategic collaborations between manufacturers and waste management companies, technological advancements in biodegradable materials, and the increasing adoption of sustainable packaging practices across various industries. The expansion into new geographic markets will also significantly contribute to long-term growth.
Key Players Shaping the Garbage Bags Market Market
- Pack-It BV
- Cosmoplast Industrial Company LLC (Harwal Group of Companies)
- Novplasta s r o
- Luban Packing LLC
- Kemii Garbage Bag Co Ltd
- Berry Global Inc
- International Plastics Inc
- Hefty (Reynolds Consumer Products LLC)
- Novolex
- Terdex GmbH
Notable Milestones in Garbage Bags Market Sector
- October 2022: ECOSAC launches Ecopath, a line of biodegradable consumer products, including the "Kachra sack" compostable garbage bag. This launch signifies a significant shift towards sustainable alternatives within the market.
In-Depth Garbage Bags Market Market Outlook
The future of the Garbage Bags Market is promising, driven by a combination of factors including increased environmental awareness, stricter regulations, and the innovation of sustainable materials. Strategic partnerships and expansion into emerging economies will further contribute to market growth. The market is expected to experience significant growth in the coming years, driven by the adoption of eco-friendly alternatives and a greater focus on sustainable waste management practices.
Garbage Bags Market Segmentation
-
1. End-user Industries
- 1.1. Residential
- 1.2. Institutional
- 1.3. Industrial and Commercial
Garbage Bags Market Segmentation By Geography
-
1. North America
- 1.1. United States
- 1.2. Canada
-
2. Europe
- 2.1. United Kingdom
- 2.2. Germany
- 2.3. France
- 2.4. Spain
-
3. Asia
- 3.1. India
- 3.2. China
- 3.3. Japan
- 3.4. Australia and New Zealand
- 4. Latin America
- 5. Middle East and Africa
Garbage Bags Market Regional Market Share
Geographic Coverage of Garbage Bags Market
Garbage Bags Market REPORT HIGHLIGHTS
| Aspects | Details |
|---|---|
| Study Period | 2020-2034 |
| Base Year | 2025 |
| Estimated Year | 2026 |
| Forecast Period | 2026-2034 |
| Historical Period | 2020-2025 |
| Growth Rate | CAGR of 7.55% from 2020-2034 |
| Segmentation |
|
Table of Contents
- 1. Introduction
- 1.1. Research Scope
- 1.2. Market Segmentation
- 1.3. Research Objective
- 1.4. Definitions and Assumptions
- 2. Executive Summary
- 2.1. Market Snapshot
- 3. Market Dynamics
- 3.1. Market Drivers
- 3.2. Market Restrains
- 3.3. Market Trends
- 3.4. Market Opportunities
- 4. Market Factor Analysis
- 4.1. Porters Five Forces
- 4.1.1. Bargaining Power of Suppliers
- 4.1.2. Bargaining Power of Buyers
- 4.1.3. Threat of New Entrants
- 4.1.4. Threat of Substitutes
- 4.1.5. Competitive Rivalry
- 4.2. PESTEL analysis
- 4.3. BCG Analysis
- 4.3.1. Stars (High Growth, High Market Share)
- 4.3.2. Cash Cows (Low Growth, High Market Share)
- 4.3.3. Question Mark (High Growth, Low Market Share)
- 4.3.4. Dogs (Low Growth, Low Market Share)
- 4.4. Ansoff Matrix Analysis
- 4.5. Supply Chain Analysis
- 4.6. Regulatory Landscape
- 4.7. Current Market Potential and Opportunity Assessment (TAM–SAM–SOM Framework)
- 4.8. VDR Analyst Note
- 4.1. Porters Five Forces
- 5. Market Analysis, Insights and Forecast 2021-2033
- 5.1. Market Analysis, Insights and Forecast - by End-user Industries
- 5.1.1. Residential
- 5.1.2. Institutional
- 5.1.3. Industrial and Commercial
- 5.2. Market Analysis, Insights and Forecast - by Region
- 5.2.1. North America
- 5.2.2. Europe
- 5.2.3. Asia
- 5.2.4. Latin America
- 5.2.5. Middle East and Africa
- 5.1. Market Analysis, Insights and Forecast - by End-user Industries
- 6. Global Garbage Bags Market Analysis, Insights and Forecast, 2021-2033
- 6.1. Market Analysis, Insights and Forecast - by End-user Industries
- 6.1.1. Residential
- 6.1.2. Institutional
- 6.1.3. Industrial and Commercial
- 6.1. Market Analysis, Insights and Forecast - by End-user Industries
- 7. North America Garbage Bags Market Analysis, Insights and Forecast, 2021-2033
- 7.1. Market Analysis, Insights and Forecast - by End-user Industries
- 7.1.1. Residential
- 7.1.2. Institutional
- 7.1.3. Industrial and Commercial
- 7.1. Market Analysis, Insights and Forecast - by End-user Industries
- 8. Europe Garbage Bags Market Analysis, Insights and Forecast, 2021-2033
- 8.1. Market Analysis, Insights and Forecast - by End-user Industries
- 8.1.1. Residential
- 8.1.2. Institutional
- 8.1.3. Industrial and Commercial
- 8.1. Market Analysis, Insights and Forecast - by End-user Industries
- 9. Asia Garbage Bags Market Analysis, Insights and Forecast, 2021-2033
- 9.1. Market Analysis, Insights and Forecast - by End-user Industries
- 9.1.1. Residential
- 9.1.2. Institutional
- 9.1.3. Industrial and Commercial
- 9.1. Market Analysis, Insights and Forecast - by End-user Industries
- 10. Latin America Garbage Bags Market Analysis, Insights and Forecast, 2021-2033
- 10.1. Market Analysis, Insights and Forecast - by End-user Industries
- 10.1.1. Residential
- 10.1.2. Institutional
- 10.1.3. Industrial and Commercial
- 10.1. Market Analysis, Insights and Forecast - by End-user Industries
- 11. Middle East and Africa Garbage Bags Market Analysis, Insights and Forecast, 2021-2033
- 11.1. Market Analysis, Insights and Forecast - by End-user Industries
- 11.1.1. Residential
- 11.1.2. Institutional
- 11.1.3. Industrial and Commercial
- 11.1. Market Analysis, Insights and Forecast - by End-user Industries
- 12. Competitive Analysis
- 12.1. Company Profiles
- 12.1.1 Pack-It BV
- 12.1.1.1. Company Overview
- 12.1.1.2. Products
- 12.1.1.3. Company Financials
- 12.1.1.4. SWOT Analysis
- 12.1.2 Cosmoplast Industrial Company LLC( Harwal Group of Companies)
- 12.1.2.1. Company Overview
- 12.1.2.2. Products
- 12.1.2.3. Company Financials
- 12.1.2.4. SWOT Analysis
- 12.1.3 Novplasta s r o
- 12.1.3.1. Company Overview
- 12.1.3.2. Products
- 12.1.3.3. Company Financials
- 12.1.3.4. SWOT Analysis
- 12.1.4 Luban Packing LLC
- 12.1.4.1. Company Overview
- 12.1.4.2. Products
- 12.1.4.3. Company Financials
- 12.1.4.4. SWOT Analysis
- 12.1.5 Kemii Garbage Bag Co Ltd
- 12.1.5.1. Company Overview
- 12.1.5.2. Products
- 12.1.5.3. Company Financials
- 12.1.5.4. SWOT Analysis
- 12.1.6 Berry Global Inc *List Not Exhaustive
- 12.1.6.1. Company Overview
- 12.1.6.2. Products
- 12.1.6.3. Company Financials
- 12.1.6.4. SWOT Analysis
- 12.1.7 International Plastics Inc
- 12.1.7.1. Company Overview
- 12.1.7.2. Products
- 12.1.7.3. Company Financials
- 12.1.7.4. SWOT Analysis
- 12.1.8 Hefty(Reynolds Consumer Products LLC)
- 12.1.8.1. Company Overview
- 12.1.8.2. Products
- 12.1.8.3. Company Financials
- 12.1.8.4. SWOT Analysis
- 12.1.9 Novolex
- 12.1.9.1. Company Overview
- 12.1.9.2. Products
- 12.1.9.3. Company Financials
- 12.1.9.4. SWOT Analysis
- 12.1.10 Terdex GmbH
- 12.1.10.1. Company Overview
- 12.1.10.2. Products
- 12.1.10.3. Company Financials
- 12.1.10.4. SWOT Analysis
- 12.1.1 Pack-It BV
- 12.2. Market Entropy
- 12.2.1 Company's Key Areas Served
- 12.2.2 Recent Developments
- 12.3. Company Market Share Analysis 2025
- 12.3.1 Top 5 Companies Market Share Analysis
- 12.3.2 Top 3 Companies Market Share Analysis
- 12.4. List of Potential Customers
- 13. Research Methodology
List of Figures
- Figure 1: Global Garbage Bags Market Revenue Breakdown (Million, %) by Region 2025 & 2033
- Figure 2: Global Garbage Bags Market Volume Breakdown (K Tons, %) by Region 2025 & 2033
- Figure 3: North America Garbage Bags Market Revenue (Million), by End-user Industries 2025 & 2033
- Figure 4: North America Garbage Bags Market Volume (K Tons), by End-user Industries 2025 & 2033
- Figure 5: North America Garbage Bags Market Revenue Share (%), by End-user Industries 2025 & 2033
- Figure 6: North America Garbage Bags Market Volume Share (%), by End-user Industries 2025 & 2033
- Figure 7: North America Garbage Bags Market Revenue (Million), by Country 2025 & 2033
- Figure 8: North America Garbage Bags Market Volume (K Tons), by Country 2025 & 2033
- Figure 9: North America Garbage Bags Market Revenue Share (%), by Country 2025 & 2033
- Figure 10: North America Garbage Bags Market Volume Share (%), by Country 2025 & 2033
- Figure 11: Europe Garbage Bags Market Revenue (Million), by End-user Industries 2025 & 2033
- Figure 12: Europe Garbage Bags Market Volume (K Tons), by End-user Industries 2025 & 2033
- Figure 13: Europe Garbage Bags Market Revenue Share (%), by End-user Industries 2025 & 2033
- Figure 14: Europe Garbage Bags Market Volume Share (%), by End-user Industries 2025 & 2033
- Figure 15: Europe Garbage Bags Market Revenue (Million), by Country 2025 & 2033
- Figure 16: Europe Garbage Bags Market Volume (K Tons), by Country 2025 & 2033
- Figure 17: Europe Garbage Bags Market Revenue Share (%), by Country 2025 & 2033
- Figure 18: Europe Garbage Bags Market Volume Share (%), by Country 2025 & 2033
- Figure 19: Asia Garbage Bags Market Revenue (Million), by End-user Industries 2025 & 2033
- Figure 20: Asia Garbage Bags Market Volume (K Tons), by End-user Industries 2025 & 2033
- Figure 21: Asia Garbage Bags Market Revenue Share (%), by End-user Industries 2025 & 2033
- Figure 22: Asia Garbage Bags Market Volume Share (%), by End-user Industries 2025 & 2033
- Figure 23: Asia Garbage Bags Market Revenue (Million), by Country 2025 & 2033
- Figure 24: Asia Garbage Bags Market Volume (K Tons), by Country 2025 & 2033
- Figure 25: Asia Garbage Bags Market Revenue Share (%), by Country 2025 & 2033
- Figure 26: Asia Garbage Bags Market Volume Share (%), by Country 2025 & 2033
- Figure 27: Latin America Garbage Bags Market Revenue (Million), by End-user Industries 2025 & 2033
- Figure 28: Latin America Garbage Bags Market Volume (K Tons), by End-user Industries 2025 & 2033
- Figure 29: Latin America Garbage Bags Market Revenue Share (%), by End-user Industries 2025 & 2033
- Figure 30: Latin America Garbage Bags Market Volume Share (%), by End-user Industries 2025 & 2033
- Figure 31: Latin America Garbage Bags Market Revenue (Million), by Country 2025 & 2033
- Figure 32: Latin America Garbage Bags Market Volume (K Tons), by Country 2025 & 2033
- Figure 33: Latin America Garbage Bags Market Revenue Share (%), by Country 2025 & 2033
- Figure 34: Latin America Garbage Bags Market Volume Share (%), by Country 2025 & 2033
- Figure 35: Middle East and Africa Garbage Bags Market Revenue (Million), by End-user Industries 2025 & 2033
- Figure 36: Middle East and Africa Garbage Bags Market Volume (K Tons), by End-user Industries 2025 & 2033
- Figure 37: Middle East and Africa Garbage Bags Market Revenue Share (%), by End-user Industries 2025 & 2033
- Figure 38: Middle East and Africa Garbage Bags Market Volume Share (%), by End-user Industries 2025 & 2033
- Figure 39: Middle East and Africa Garbage Bags Market Revenue (Million), by Country 2025 & 2033
- Figure 40: Middle East and Africa Garbage Bags Market Volume (K Tons), by Country 2025 & 2033
- Figure 41: Middle East and Africa Garbage Bags Market Revenue Share (%), by Country 2025 & 2033
- Figure 42: Middle East and Africa Garbage Bags Market Volume Share (%), by Country 2025 & 2033
List of Tables
- Table 1: Global Garbage Bags Market Revenue Million Forecast, by End-user Industries 2020 & 2033
- Table 2: Global Garbage Bags Market Volume K Tons Forecast, by End-user Industries 2020 & 2033
- Table 3: Global Garbage Bags Market Revenue Million Forecast, by Region 2020 & 2033
- Table 4: Global Garbage Bags Market Volume K Tons Forecast, by Region 2020 & 2033
- Table 5: Global Garbage Bags Market Revenue Million Forecast, by End-user Industries 2020 & 2033
- Table 6: Global Garbage Bags Market Volume K Tons Forecast, by End-user Industries 2020 & 2033
- Table 7: Global Garbage Bags Market Revenue Million Forecast, by Country 2020 & 2033
- Table 8: Global Garbage Bags Market Volume K Tons Forecast, by Country 2020 & 2033
- Table 9: United States Garbage Bags Market Revenue (Million) Forecast, by Application 2020 & 2033
- Table 10: United States Garbage Bags Market Volume (K Tons) Forecast, by Application 2020 & 2033
- Table 11: Canada Garbage Bags Market Revenue (Million) Forecast, by Application 2020 & 2033
- Table 12: Canada Garbage Bags Market Volume (K Tons) Forecast, by Application 2020 & 2033
- Table 13: Global Garbage Bags Market Revenue Million Forecast, by End-user Industries 2020 & 2033
- Table 14: Global Garbage Bags Market Volume K Tons Forecast, by End-user Industries 2020 & 2033
- Table 15: Global Garbage Bags Market Revenue Million Forecast, by Country 2020 & 2033
- Table 16: Global Garbage Bags Market Volume K Tons Forecast, by Country 2020 & 2033
- Table 17: United Kingdom Garbage Bags Market Revenue (Million) Forecast, by Application 2020 & 2033
- Table 18: United Kingdom Garbage Bags Market Volume (K Tons) Forecast, by Application 2020 & 2033
- Table 19: Germany Garbage Bags Market Revenue (Million) Forecast, by Application 2020 & 2033
- Table 20: Germany Garbage Bags Market Volume (K Tons) Forecast, by Application 2020 & 2033
- Table 21: France Garbage Bags Market Revenue (Million) Forecast, by Application 2020 & 2033
- Table 22: France Garbage Bags Market Volume (K Tons) Forecast, by Application 2020 & 2033
- Table 23: Spain Garbage Bags Market Revenue (Million) Forecast, by Application 2020 & 2033
- Table 24: Spain Garbage Bags Market Volume (K Tons) Forecast, by Application 2020 & 2033
- Table 25: Global Garbage Bags Market Revenue Million Forecast, by End-user Industries 2020 & 2033
- Table 26: Global Garbage Bags Market Volume K Tons Forecast, by End-user Industries 2020 & 2033
- Table 27: Global Garbage Bags Market Revenue Million Forecast, by Country 2020 & 2033
- Table 28: Global Garbage Bags Market Volume K Tons Forecast, by Country 2020 & 2033
- Table 29: India Garbage Bags Market Revenue (Million) Forecast, by Application 2020 & 2033
- Table 30: India Garbage Bags Market Volume (K Tons) Forecast, by Application 2020 & 2033
- Table 31: China Garbage Bags Market Revenue (Million) Forecast, by Application 2020 & 2033
- Table 32: China Garbage Bags Market Volume (K Tons) Forecast, by Application 2020 & 2033
- Table 33: Japan Garbage Bags Market Revenue (Million) Forecast, by Application 2020 & 2033
- Table 34: Japan Garbage Bags Market Volume (K Tons) Forecast, by Application 2020 & 2033
- Table 35: Australia and New Zealand Garbage Bags Market Revenue (Million) Forecast, by Application 2020 & 2033
- Table 36: Australia and New Zealand Garbage Bags Market Volume (K Tons) Forecast, by Application 2020 & 2033
- Table 37: Global Garbage Bags Market Revenue Million Forecast, by End-user Industries 2020 & 2033
- Table 38: Global Garbage Bags Market Volume K Tons Forecast, by End-user Industries 2020 & 2033
- Table 39: Global Garbage Bags Market Revenue Million Forecast, by Country 2020 & 2033
- Table 40: Global Garbage Bags Market Volume K Tons Forecast, by Country 2020 & 2033
- Table 41: Global Garbage Bags Market Revenue Million Forecast, by End-user Industries 2020 & 2033
- Table 42: Global Garbage Bags Market Volume K Tons Forecast, by End-user Industries 2020 & 2033
- Table 43: Global Garbage Bags Market Revenue Million Forecast, by Country 2020 & 2033
- Table 44: Global Garbage Bags Market Volume K Tons Forecast, by Country 2020 & 2033
Frequently Asked Questions
1. What is the projected Compound Annual Growth Rate (CAGR) of the Garbage Bags Market?
The projected CAGR is approximately 7.55%.
2. Which companies are prominent players in the Garbage Bags Market?
Key companies in the market include Pack-It BV, Cosmoplast Industrial Company LLC( Harwal Group of Companies), Novplasta s r o, Luban Packing LLC, Kemii Garbage Bag Co Ltd, Berry Global Inc *List Not Exhaustive, International Plastics Inc, Hefty(Reynolds Consumer Products LLC), Novolex, Terdex GmbH.
3. What are the main segments of the Garbage Bags Market?
The market segments include End-user Industries.
4. Can you provide details about the market size?
The market size is estimated to be USD 14.22 Million as of 2022.
5. What are some drivers contributing to market growth?
Rapid Urbanization; Growing Awareness for Hygiene.
6. What are the notable trends driving market growth?
Growing Concern Of Sustainablity and Demand for Sustainable Solution..
7. Are there any restraints impacting market growth?
Increasing Plastic Bans.
8. Can you provide examples of recent developments in the market?
October 2022 - ECOSAC launches Ecopath- A Line of Biodegradable Consumer Products. Ecopath offers eco-friendly alternatives for daily use consumer products to 'Ecopaths,' who believe in environmentalism. These products made using responsibly sourced natural, and biodegradable raw materials range from coir dishwashing scrub pads, paper stem cotton buds, wooden toothbrushes, tongue cleaners, wooden combs, bamboo straws, wooden shaving brushes, and razors to compostable garbage bags named Kachra sack (which are widely available in all major supermarkets).
9. What pricing options are available for accessing the report?
Pricing options include single-user, multi-user, and enterprise licenses priced at USD 4750, USD 5250, and USD 8750 respectively.
10. Is the market size provided in terms of value or volume?
The market size is provided in terms of value, measured in Million and volume, measured in K Tons.
11. Are there any specific market keywords associated with the report?
Yes, the market keyword associated with the report is "Garbage Bags Market," which aids in identifying and referencing the specific market segment covered.
12. How do I determine which pricing option suits my needs best?
The pricing options vary based on user requirements and access needs. Individual users may opt for single-user licenses, while businesses requiring broader access may choose multi-user or enterprise licenses for cost-effective access to the report.
13. Are there any additional resources or data provided in the Garbage Bags Market report?
While the report offers comprehensive insights, it's advisable to review the specific contents or supplementary materials provided to ascertain if additional resources or data are available.
14. How can I stay updated on further developments or reports in the Garbage Bags Market?
To stay informed about further developments, trends, and reports in the Garbage Bags Market, consider subscribing to industry newsletters, following relevant companies and organizations, or regularly checking reputable industry news sources and publications.
Methodology
Step 1 - Identification of Relevant Samples Size from Population Database


Step 2 - Approaches for Defining Global Market Size (Value, Volume* & Price*)

Note*: In applicable scenarios
Step 3 - Data Sources
Primary Research
- Web Analytics
- Survey Reports
- Research Institute
- Latest Research Reports
- Opinion Leaders
Secondary Research
- Annual Reports
- White Paper
- Latest Press Release
- Industry Association
- Paid Database
- Investor Presentations

Step 4 - Data Triangulation
Involves using different sources of information in order to increase the validity of a study
These sources are likely to be stakeholders in a program - participants, other researchers, program staff, other community members, and so on.
Then we put all data in single framework & apply various statistical tools to find out the dynamic on the market.
During the analysis stage, feedback from the stakeholder groups would be compared to determine areas of agreement as well as areas of divergence