

Key Insights
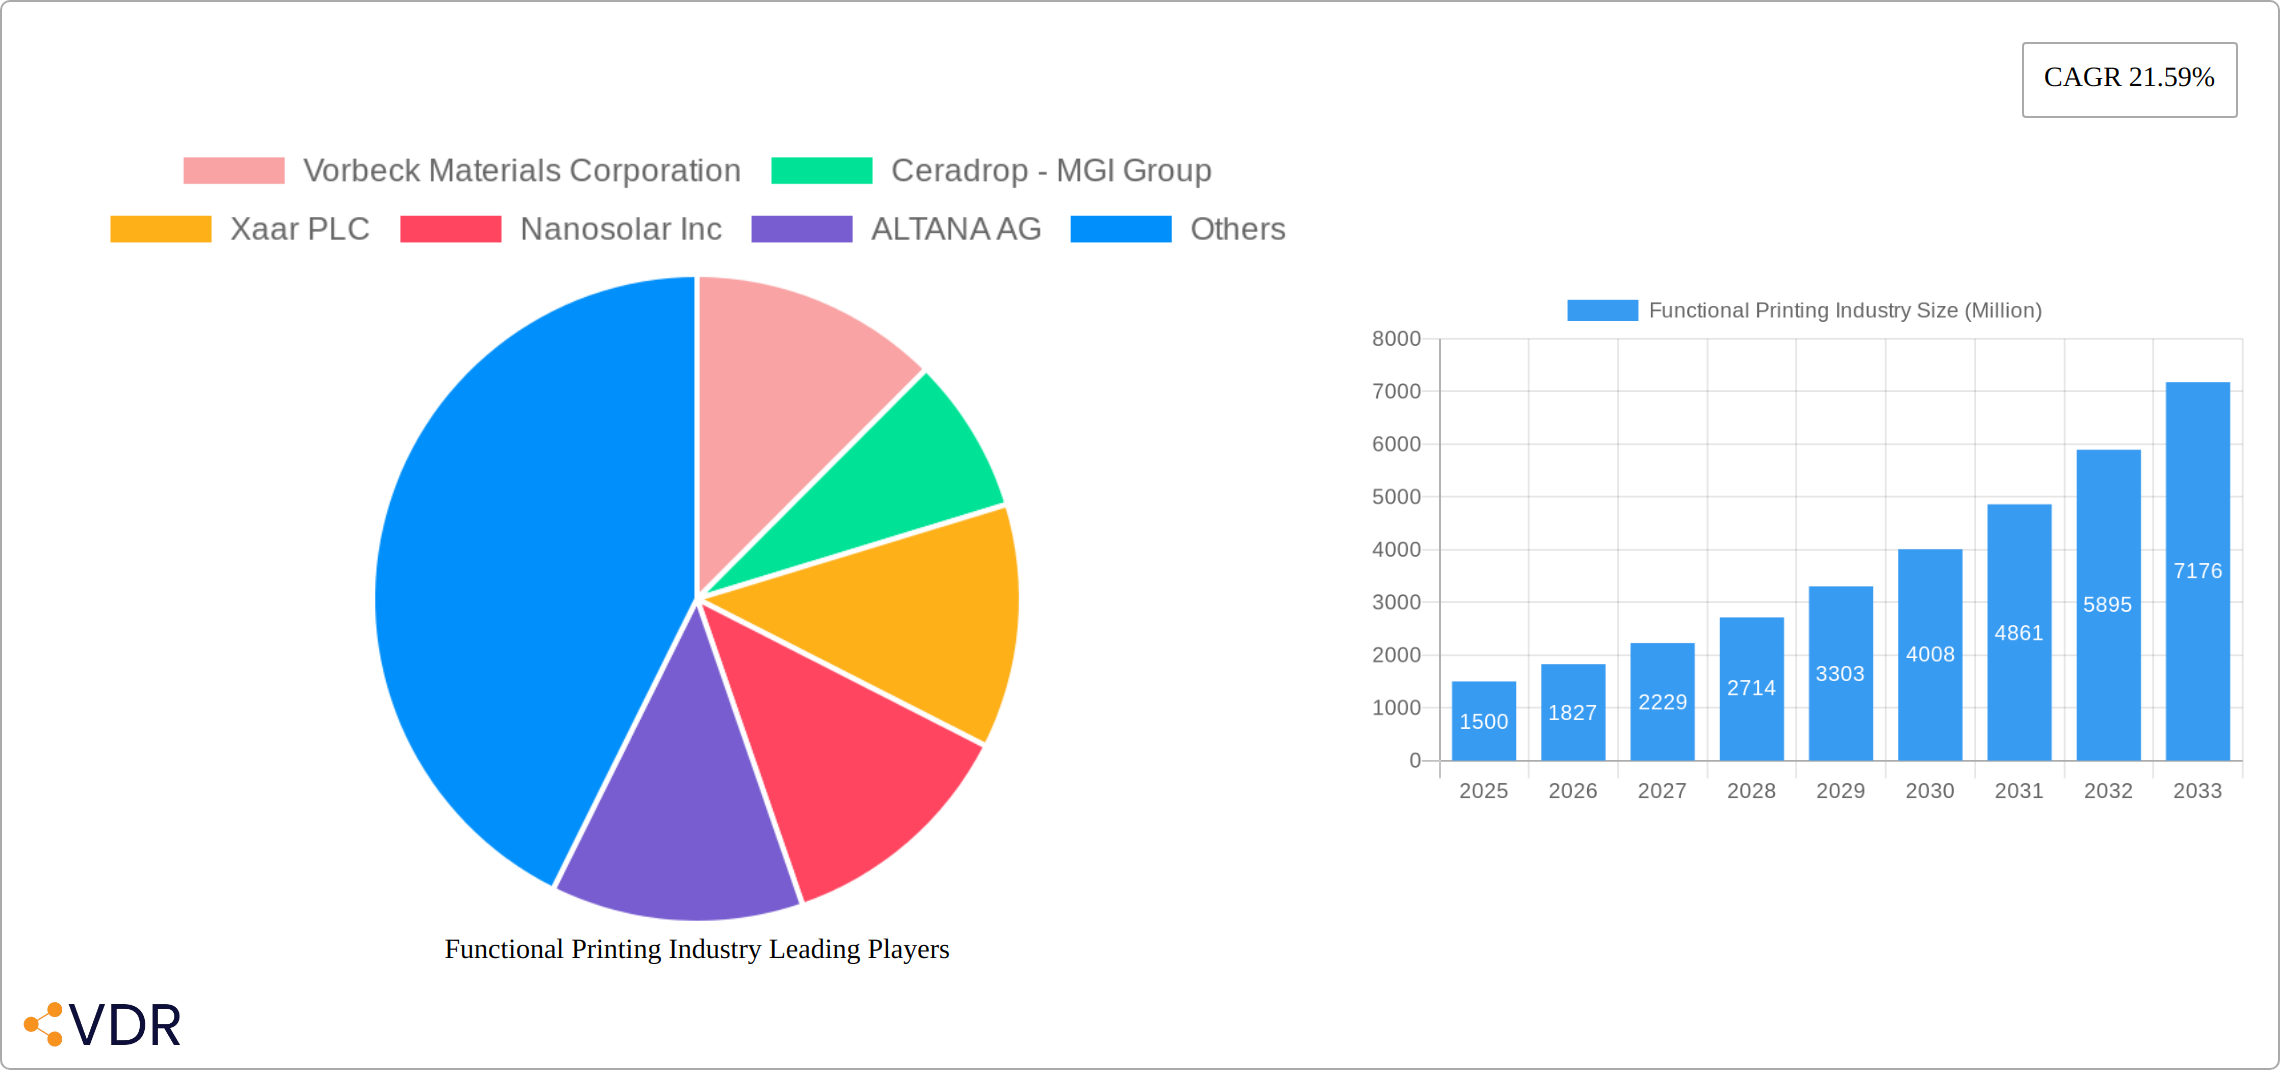
The functional printing market, valued at approximately 36.1 billion in 2025, is projected to expand at a compound annual growth rate (CAGR) of 19.3% from 2025 to 2033. This growth is propelled by escalating demand for flexible and lightweight electronics across consumer electronics, automotive, and healthcare sectors. Technological advancements in inkjet and screen printing are enabling cost-effective production of high-resolution functional components. The increasing adoption of printed sensors for environmental monitoring, biomedical diagnostics, and industrial automation further fuels market expansion. Additionally, a growing emphasis on sustainable manufacturing processes positions functional printing as an eco-friendly alternative to traditional methods. The market's segmentation by material (substrates, inks), printing technology (inkjet, screen, gravure, flexography), and application (sensors, displays, lighting, batteries, photovoltaics, RFID tags) underscores its diverse and dynamic nature, revealing numerous niche opportunities.
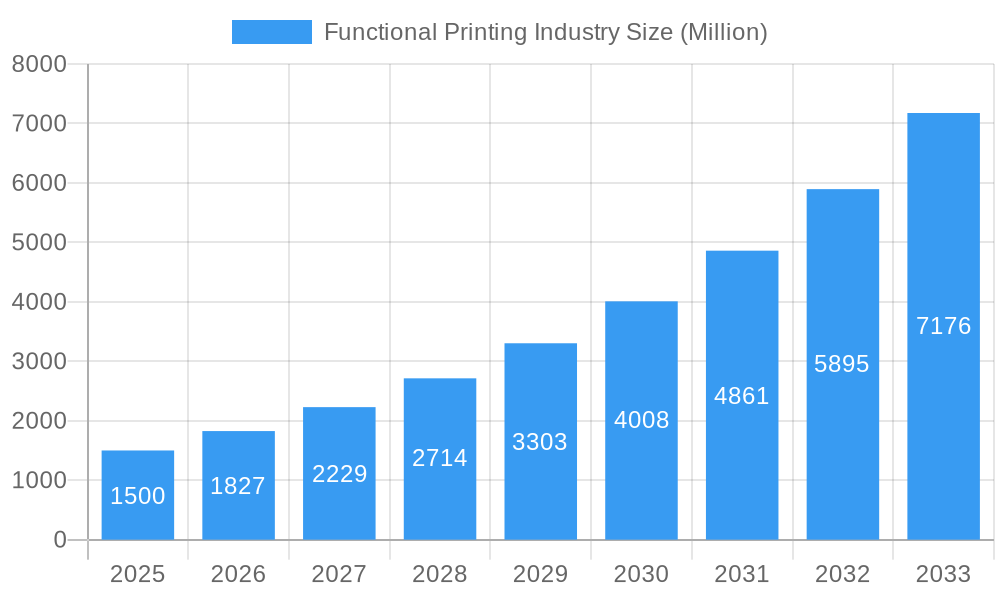
Functional Printing Industry Market Size (In Billion)
Regional market dynamics vary significantly. While North America and Europe currently command substantial market shares, the Asia-Pacific region is anticipated to experience rapid growth, driven by its expanding electronics manufacturing base and increased R&D investments. These regional disparities offer strategic avenues for businesses to customize their offerings and distribution strategies. Key challenges include high initial investment costs for advanced functional printing infrastructure and the ongoing need for technological advancements to improve the durability, reliability, and performance of printed components. Despite these challenges, the functional printing market presents a highly promising outlook and a significant investment opportunity for all stakeholders in the value chain, from material suppliers to equipment manufacturers and end-users.
Functional Printing Industry Company Market Share
Functional Printing Industry Market Report: 2019-2033
This comprehensive report provides a detailed analysis of the Functional Printing Industry, encompassing market dynamics, growth trends, regional analysis, competitive landscape, and future outlook. The study period spans from 2019 to 2033, with 2025 as the base and estimated year. This report is invaluable for industry professionals, investors, and strategic decision-makers seeking a deep understanding of this rapidly evolving sector. The report leverages extensive primary and secondary research, providing both quantitative and qualitative insights into the market's current state and future trajectory. Parent markets include advanced materials and printing technologies, while child markets are diverse applications like sensors, displays, and batteries. The global functional printing market size is estimated at xx Million units in 2025.
Functional Printing Industry Market Dynamics & Structure
The functional printing market exhibits a moderately fragmented structure with several key players competing fiercely. Technological innovation is a primary driver, particularly in inkjet and screen printing technologies. Stringent regulatory frameworks regarding material safety and environmental impact significantly influence market dynamics. Competitive substitutes, such as traditional manufacturing methods, pose challenges. End-user demographics are diverse, spanning various industries. M&A activity has been relatively moderate in recent years but is expected to increase as the market matures.
- Market Concentration: Moderately fragmented, with no single dominant player commanding over 30% market share in 2025.
- Technological Innovation: Inkjet printing and advancements in conductive inks are major drivers.
- Regulatory Framework: Compliance with RoHS and REACH regulations is crucial, impacting material selection.
- Competitive Substitutes: Traditional manufacturing processes, particularly for smaller-scale production.
- End-User Demographics: Diverse, including electronics, automotive, healthcare, and packaging industries.
- M&A Trends: xx M&A deals recorded between 2019-2024, with an anticipated increase to xx deals by 2033.
Functional Printing Industry Growth Trends & Insights
The functional printing market has witnessed robust growth over the past few years, driven by increasing demand for customized and high-performance products across various applications. The adoption rate of functional printing technologies is steadily increasing, particularly in electronics and healthcare sectors. Technological disruptions, such as the development of novel inks and printing processes, are further accelerating market expansion. Shifting consumer preferences towards sustainable and innovative products also contribute to growth. The market is projected to experience a CAGR of xx% during the forecast period (2025-2033), reaching an estimated size of xx Million units by 2033. Market penetration is expected to increase from xx% in 2025 to xx% by 2033.
Dominant Regions, Countries, or Segments in Functional Printing Industry
North America currently leads the functional printing industry, propelled by robust technological advancements and high adoption rates in critical sectors such as electronics and automotive. Concurrently, the Asia-Pacific region is projected to experience the most rapid growth, fueled by burgeoning demand from developing economies and increasing investments in cutting-edge manufacturing capabilities. Within specific segments, inkjet printing remains the dominant technology, while applications in electronics and sensors exhibit the highest growth potential, signaling a dynamic and evolving market landscape.
-
Key Regional Drivers:
- North America: Characterized by substantial R&D investments, early adoption of emerging technologies, and highly developed supply chain networks.
- Asia-Pacific: Driven by swift industrialization, a burgeoning consumer electronics market, and supportive government initiatives promoting technological growth.
- Europe: Emphasizing innovation in sustainable materials and the development of environmentally conscious printing technologies.
-
Dominant Segments:
- Printing Technology: Inkjet printing is expected to maintain its lead, projected to hold approximately [Insert specific XX]% of the market share by 2025.
- Application: Sensors are anticipated to be the leading application, capturing an estimated [Insert specific XX]% of the market share by 2025, followed closely by advancements in displays and batteries.
- Material: Inks are projected to dominate the material segment, accounting for around [Insert specific XX]% of the market share by 2025, with conductive inks showcasing the highest growth trajectory.
Functional Printing Industry Product Landscape
The functional printing industry encompasses a wide array of innovative products, including highly conductive inks, specialized substrates tailored for diverse applications, and sophisticated printing equipment. Recent breakthroughs are primarily focused on achieving unprecedented print resolution, enhancing material conductivity for superior performance, and broadening the spectrum of printable substrates to accommodate new functionalities. The core value proposition for these products lies in their ability to enable the cost-effective production of customized, high-precision functional components. Emerging advancements in nanomaterials and ultra-precision printing techniques are continuously driving improvements in overall product performance and application possibilities.
Key Drivers, Barriers & Challenges in Functional Printing Industry
Key Drivers: Increasing demand for miniaturized electronics, rising adoption of flexible electronics, and the need for cost-effective manufacturing processes. Government initiatives promoting sustainable manufacturing practices and the development of advanced materials also contribute positively.
Key Challenges: High initial investment costs for equipment, technical complexities in achieving high-precision printing, and limitations in scalability for mass production. Supply chain disruptions and the need for skilled labor also pose challenges. In 2024, supply chain issues resulted in a xx% increase in production costs for some key materials.
Emerging Opportunities in Functional Printing Industry
The emerging opportunities lie in the development of novel applications, such as wearable electronics, biosensors, and advanced packaging. Untapped markets include personalized medicine and smart textiles. The increasing demand for sustainable and eco-friendly solutions further creates opportunities for bio-based inks and recyclable substrates.
Growth Accelerators in the Functional Printing Industry Industry
The functional printing market is experiencing significant growth acceleration driven by continuous technological breakthroughs, particularly in materials science. The development of high-performance inks and advanced substrates is a key catalyst, enabling new functionalities and improved performance. Furthermore, strategic collaborations between leading printing technology providers and material suppliers are fostering a fertile ground for innovation and product development. The expansion of functional printing into novel applications, with notable growth anticipated in the healthcare and renewable energy sectors, is also a crucial factor driving market growth and unlocking new opportunities.
Key Players Shaping the Functional Printing Industry Market
- Vorbeck Materials Corporation
- Ceradrop - MGI Group
- Xaar PLC
- Nanosolar Inc
- ALTANA AG
- Toyo Ink Sc Holding Co Ltd
- GSI Technologies LLC
- Blue Spark Technologies
- Eastman Kodak Company Ltd
- Optomec Inc
- Toppan Forms Co Ltd
- Xennia Technology Limited
- Isorg
- BASF SE
- Avery Dennison Corporation
- AGFA - Gevaent Corporation
- CEMITEC (Multidisciplinary Centre of Technology for Industry)
- E Ink Holdings Inc
- Novaled AG
- Enfucell Oy
- Mark Andy Inc
Notable Milestones in Functional Printing Industry Sector
- 2020: Development of a new high-conductivity silver nanoink by Vorbeck Materials.
- 2022: Launch of a new inkjet printer specifically designed for functional printing by Xaar PLC.
- 2023: Strategic partnership between BASF and a major electronics manufacturer to develop new functional printing materials.
In-Depth Functional Printing Industry Market Outlook
The functional printing market is strategically positioned for sustained and robust growth. This expansion is primarily driven by ongoing technological innovations, a burgeoning demand for highly customized and performance-driven products, and the successful penetration into new and emerging application areas. Strategic alliances and significant investments in research and development are pivotal elements that will shape the future trajectory of this dynamic industry. The market presents substantial opportunities for companies that demonstrate proficiency in developing groundbreaking materials, pioneering advanced printing processes, and creating novel applications. The market is projected to reach an impressive [Insert specific XX] Million units by 2033, signaling significant growth potential for all active market participants.
Functional Printing Industry Segmentation
-
1. Material
- 1.1. Substrates
- 1.2. Inks
-
2. Printing Technology
- 2.1. Inkjet Printing
- 2.2. Screen Printing
- 2.3. Gravure Printing
- 2.4. Flexography
- 2.5. Other Printing Technologies
-
3. Application
- 3.1. Sensor
- 3.2. Display
- 3.3. Lighting
- 3.4. Battery
- 3.5. Photovoltaic
- 3.6. RFID Tags
- 3.7. Other Applications
Functional Printing Industry Segmentation By Geography
- 1. North America
- 2. Europe
- 3. Asia Pacific
- 4. South America
- 5. Middle East and Africa
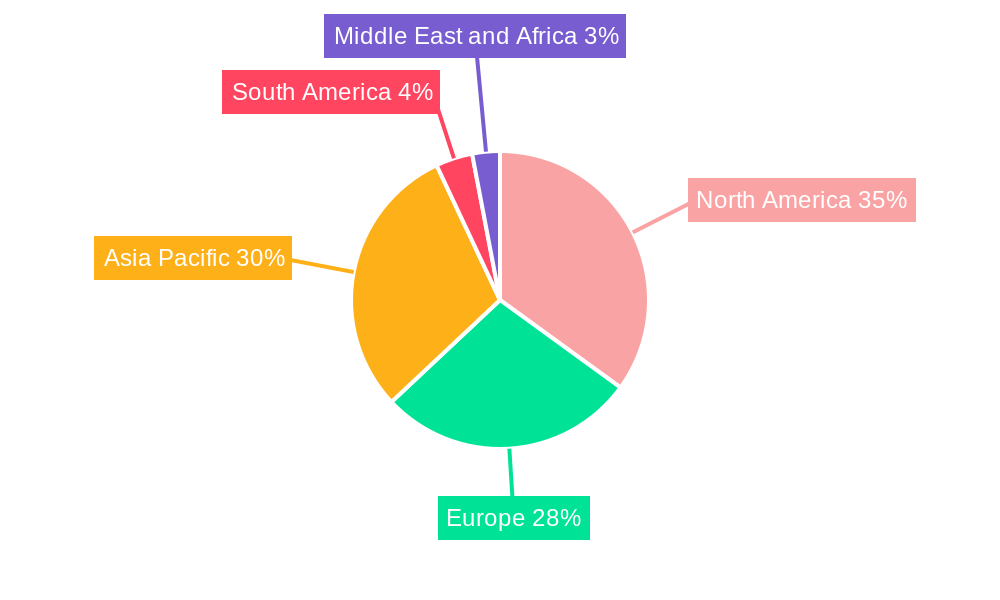
Functional Printing Industry Regional Market Share
Geographic Coverage of Functional Printing Industry
Functional Printing Industry REPORT HIGHLIGHTS
| Aspects | Details |
|---|---|
| Study Period | 2020-2034 |
| Base Year | 2025 |
| Estimated Year | 2026 |
| Forecast Period | 2026-2034 |
| Historical Period | 2020-2025 |
| Growth Rate | CAGR of 19.3% from 2020-2034 |
| Segmentation |
|
Table of Contents
- 1. Introduction
- 1.1. Research Scope
- 1.2. Market Segmentation
- 1.3. Research Objective
- 1.4. Definitions and Assumptions
- 2. Executive Summary
- 2.1. Market Snapshot
- 3. Market Dynamics
- 3.1. Market Drivers
- 3.2. Market Restrains
- 3.3. Market Trends
- 3.4. Market Opportunities
- 4. Market Factor Analysis
- 4.1. Porters Five Forces
- 4.1.1. Bargaining Power of Suppliers
- 4.1.2. Bargaining Power of Buyers
- 4.1.3. Threat of New Entrants
- 4.1.4. Threat of Substitutes
- 4.1.5. Competitive Rivalry
- 4.2. PESTEL analysis
- 4.3. BCG Analysis
- 4.3.1. Stars (High Growth, High Market Share)
- 4.3.2. Cash Cows (Low Growth, High Market Share)
- 4.3.3. Question Mark (High Growth, Low Market Share)
- 4.3.4. Dogs (Low Growth, Low Market Share)
- 4.4. Ansoff Matrix Analysis
- 4.5. Supply Chain Analysis
- 4.6. Regulatory Landscape
- 4.7. Current Market Potential and Opportunity Assessment (TAM–SAM–SOM Framework)
- 4.8. VDR Analyst Note
- 4.1. Porters Five Forces
- 5. Market Analysis, Insights and Forecast 2021-2033
- 5.1. Market Analysis, Insights and Forecast - by Material
- 5.1.1. Substrates
- 5.1.2. Inks
- 5.2. Market Analysis, Insights and Forecast - by Printing Technology
- 5.2.1. Inkjet Printing
- 5.2.2. Screen Printing
- 5.2.3. Gravure Printing
- 5.2.4. Flexography
- 5.2.5. Other Printing Technologies
- 5.3. Market Analysis, Insights and Forecast - by Application
- 5.3.1. Sensor
- 5.3.2. Display
- 5.3.3. Lighting
- 5.3.4. Battery
- 5.3.5. Photovoltaic
- 5.3.6. RFID Tags
- 5.3.7. Other Applications
- 5.4. Market Analysis, Insights and Forecast - by Region
- 5.4.1. North America
- 5.4.2. Europe
- 5.4.3. Asia Pacific
- 5.4.4. South America
- 5.4.5. Middle East and Africa
- 5.1. Market Analysis, Insights and Forecast - by Material
- 6. Global Functional Printing Industry Analysis, Insights and Forecast, 2021-2033
- 6.1. Market Analysis, Insights and Forecast - by Material
- 6.1.1. Substrates
- 6.1.2. Inks
- 6.2. Market Analysis, Insights and Forecast - by Printing Technology
- 6.2.1. Inkjet Printing
- 6.2.2. Screen Printing
- 6.2.3. Gravure Printing
- 6.2.4. Flexography
- 6.2.5. Other Printing Technologies
- 6.3. Market Analysis, Insights and Forecast - by Application
- 6.3.1. Sensor
- 6.3.2. Display
- 6.3.3. Lighting
- 6.3.4. Battery
- 6.3.5. Photovoltaic
- 6.3.6. RFID Tags
- 6.3.7. Other Applications
- 6.1. Market Analysis, Insights and Forecast - by Material
- 7. North America Functional Printing Industry Analysis, Insights and Forecast, 2021-2033
- 7.1. Market Analysis, Insights and Forecast - by Material
- 7.1.1. Substrates
- 7.1.2. Inks
- 7.2. Market Analysis, Insights and Forecast - by Printing Technology
- 7.2.1. Inkjet Printing
- 7.2.2. Screen Printing
- 7.2.3. Gravure Printing
- 7.2.4. Flexography
- 7.2.5. Other Printing Technologies
- 7.3. Market Analysis, Insights and Forecast - by Application
- 7.3.1. Sensor
- 7.3.2. Display
- 7.3.3. Lighting
- 7.3.4. Battery
- 7.3.5. Photovoltaic
- 7.3.6. RFID Tags
- 7.3.7. Other Applications
- 7.1. Market Analysis, Insights and Forecast - by Material
- 8. Europe Functional Printing Industry Analysis, Insights and Forecast, 2021-2033
- 8.1. Market Analysis, Insights and Forecast - by Material
- 8.1.1. Substrates
- 8.1.2. Inks
- 8.2. Market Analysis, Insights and Forecast - by Printing Technology
- 8.2.1. Inkjet Printing
- 8.2.2. Screen Printing
- 8.2.3. Gravure Printing
- 8.2.4. Flexography
- 8.2.5. Other Printing Technologies
- 8.3. Market Analysis, Insights and Forecast - by Application
- 8.3.1. Sensor
- 8.3.2. Display
- 8.3.3. Lighting
- 8.3.4. Battery
- 8.3.5. Photovoltaic
- 8.3.6. RFID Tags
- 8.3.7. Other Applications
- 8.1. Market Analysis, Insights and Forecast - by Material
- 9. Asia Pacific Functional Printing Industry Analysis, Insights and Forecast, 2021-2033
- 9.1. Market Analysis, Insights and Forecast - by Material
- 9.1.1. Substrates
- 9.1.2. Inks
- 9.2. Market Analysis, Insights and Forecast - by Printing Technology
- 9.2.1. Inkjet Printing
- 9.2.2. Screen Printing
- 9.2.3. Gravure Printing
- 9.2.4. Flexography
- 9.2.5. Other Printing Technologies
- 9.3. Market Analysis, Insights and Forecast - by Application
- 9.3.1. Sensor
- 9.3.2. Display
- 9.3.3. Lighting
- 9.3.4. Battery
- 9.3.5. Photovoltaic
- 9.3.6. RFID Tags
- 9.3.7. Other Applications
- 9.1. Market Analysis, Insights and Forecast - by Material
- 10. South America Functional Printing Industry Analysis, Insights and Forecast, 2021-2033
- 10.1. Market Analysis, Insights and Forecast - by Material
- 10.1.1. Substrates
- 10.1.2. Inks
- 10.2. Market Analysis, Insights and Forecast - by Printing Technology
- 10.2.1. Inkjet Printing
- 10.2.2. Screen Printing
- 10.2.3. Gravure Printing
- 10.2.4. Flexography
- 10.2.5. Other Printing Technologies
- 10.3. Market Analysis, Insights and Forecast - by Application
- 10.3.1. Sensor
- 10.3.2. Display
- 10.3.3. Lighting
- 10.3.4. Battery
- 10.3.5. Photovoltaic
- 10.3.6. RFID Tags
- 10.3.7. Other Applications
- 10.1. Market Analysis, Insights and Forecast - by Material
- 11. Middle East and Africa Functional Printing Industry Analysis, Insights and Forecast, 2021-2033
- 11.1. Market Analysis, Insights and Forecast - by Material
- 11.1.1. Substrates
- 11.1.2. Inks
- 11.2. Market Analysis, Insights and Forecast - by Printing Technology
- 11.2.1. Inkjet Printing
- 11.2.2. Screen Printing
- 11.2.3. Gravure Printing
- 11.2.4. Flexography
- 11.2.5. Other Printing Technologies
- 11.3. Market Analysis, Insights and Forecast - by Application
- 11.3.1. Sensor
- 11.3.2. Display
- 11.3.3. Lighting
- 11.3.4. Battery
- 11.3.5. Photovoltaic
- 11.3.6. RFID Tags
- 11.3.7. Other Applications
- 11.1. Market Analysis, Insights and Forecast - by Material
- 12. Competitive Analysis
- 12.1. Company Profiles
- 12.1.1 Vorbeck Materials Corporation
- 12.1.1.1. Company Overview
- 12.1.1.2. Products
- 12.1.1.3. Company Financials
- 12.1.1.4. SWOT Analysis
- 12.1.2 Ceradrop - MGI Group
- 12.1.2.1. Company Overview
- 12.1.2.2. Products
- 12.1.2.3. Company Financials
- 12.1.2.4. SWOT Analysis
- 12.1.3 Xaar PLC
- 12.1.3.1. Company Overview
- 12.1.3.2. Products
- 12.1.3.3. Company Financials
- 12.1.3.4. SWOT Analysis
- 12.1.4 Nanosolar Inc
- 12.1.4.1. Company Overview
- 12.1.4.2. Products
- 12.1.4.3. Company Financials
- 12.1.4.4. SWOT Analysis
- 12.1.5 ALTANA AG
- 12.1.5.1. Company Overview
- 12.1.5.2. Products
- 12.1.5.3. Company Financials
- 12.1.5.4. SWOT Analysis
- 12.1.6 Toyo Ink Sc Holding Co Ltd
- 12.1.6.1. Company Overview
- 12.1.6.2. Products
- 12.1.6.3. Company Financials
- 12.1.6.4. SWOT Analysis
- 12.1.7 GSI Technologies LLC
- 12.1.7.1. Company Overview
- 12.1.7.2. Products
- 12.1.7.3. Company Financials
- 12.1.7.4. SWOT Analysis
- 12.1.8 Blue Spark Technologies
- 12.1.8.1. Company Overview
- 12.1.8.2. Products
- 12.1.8.3. Company Financials
- 12.1.8.4. SWOT Analysis
- 12.1.9 Eastman Kodak Company Ltd
- 12.1.9.1. Company Overview
- 12.1.9.2. Products
- 12.1.9.3. Company Financials
- 12.1.9.4. SWOT Analysis
- 12.1.10 Optomec Inc
- 12.1.10.1. Company Overview
- 12.1.10.2. Products
- 12.1.10.3. Company Financials
- 12.1.10.4. SWOT Analysis
- 12.1.11 Toppan Forms Co Ltd
- 12.1.11.1. Company Overview
- 12.1.11.2. Products
- 12.1.11.3. Company Financials
- 12.1.11.4. SWOT Analysis
- 12.1.12 Xennia Technology Limited
- 12.1.12.1. Company Overview
- 12.1.12.2. Products
- 12.1.12.3. Company Financials
- 12.1.12.4. SWOT Analysis
- 12.1.13 Isorg
- 12.1.13.1. Company Overview
- 12.1.13.2. Products
- 12.1.13.3. Company Financials
- 12.1.13.4. SWOT Analysis
- 12.1.14 BASF SE
- 12.1.14.1. Company Overview
- 12.1.14.2. Products
- 12.1.14.3. Company Financials
- 12.1.14.4. SWOT Analysis
- 12.1.15 Avery Dennison Corporation
- 12.1.15.1. Company Overview
- 12.1.15.2. Products
- 12.1.15.3. Company Financials
- 12.1.15.4. SWOT Analysis
- 12.1.16 AGFA - Gevaent Corporation
- 12.1.16.1. Company Overview
- 12.1.16.2. Products
- 12.1.16.3. Company Financials
- 12.1.16.4. SWOT Analysis
- 12.1.17 CEMITEC (Multidisciplinary Centre of Technology for Industry)*List Not Exhaustive
- 12.1.17.1. Company Overview
- 12.1.17.2. Products
- 12.1.17.3. Company Financials
- 12.1.17.4. SWOT Analysis
- 12.1.18 E Ink Holdings Inc
- 12.1.18.1. Company Overview
- 12.1.18.2. Products
- 12.1.18.3. Company Financials
- 12.1.18.4. SWOT Analysis
- 12.1.19 Novaled AG
- 12.1.19.1. Company Overview
- 12.1.19.2. Products
- 12.1.19.3. Company Financials
- 12.1.19.4. SWOT Analysis
- 12.1.20 Enfucell Oy
- 12.1.20.1. Company Overview
- 12.1.20.2. Products
- 12.1.20.3. Company Financials
- 12.1.20.4. SWOT Analysis
- 12.1.21 Mark Andy Inc
- 12.1.21.1. Company Overview
- 12.1.21.2. Products
- 12.1.21.3. Company Financials
- 12.1.21.4. SWOT Analysis
- 12.1.1 Vorbeck Materials Corporation
- 12.2. Market Entropy
- 12.2.1 Company's Key Areas Served
- 12.2.2 Recent Developments
- 12.3. Company Market Share Analysis 2025
- 12.3.1 Top 5 Companies Market Share Analysis
- 12.3.2 Top 3 Companies Market Share Analysis
- 12.4. List of Potential Customers
- 13. Research Methodology
List of Figures
- Figure 1: Global Functional Printing Industry Revenue Breakdown (billion, %) by Region 2025 & 2033
- Figure 2: North America Functional Printing Industry Revenue (billion), by Material 2025 & 2033
- Figure 3: North America Functional Printing Industry Revenue Share (%), by Material 2025 & 2033
- Figure 4: North America Functional Printing Industry Revenue (billion), by Printing Technology 2025 & 2033
- Figure 5: North America Functional Printing Industry Revenue Share (%), by Printing Technology 2025 & 2033
- Figure 6: North America Functional Printing Industry Revenue (billion), by Application 2025 & 2033
- Figure 7: North America Functional Printing Industry Revenue Share (%), by Application 2025 & 2033
- Figure 8: North America Functional Printing Industry Revenue (billion), by Country 2025 & 2033
- Figure 9: North America Functional Printing Industry Revenue Share (%), by Country 2025 & 2033
- Figure 10: Europe Functional Printing Industry Revenue (billion), by Material 2025 & 2033
- Figure 11: Europe Functional Printing Industry Revenue Share (%), by Material 2025 & 2033
- Figure 12: Europe Functional Printing Industry Revenue (billion), by Printing Technology 2025 & 2033
- Figure 13: Europe Functional Printing Industry Revenue Share (%), by Printing Technology 2025 & 2033
- Figure 14: Europe Functional Printing Industry Revenue (billion), by Application 2025 & 2033
- Figure 15: Europe Functional Printing Industry Revenue Share (%), by Application 2025 & 2033
- Figure 16: Europe Functional Printing Industry Revenue (billion), by Country 2025 & 2033
- Figure 17: Europe Functional Printing Industry Revenue Share (%), by Country 2025 & 2033
- Figure 18: Asia Pacific Functional Printing Industry Revenue (billion), by Material 2025 & 2033
- Figure 19: Asia Pacific Functional Printing Industry Revenue Share (%), by Material 2025 & 2033
- Figure 20: Asia Pacific Functional Printing Industry Revenue (billion), by Printing Technology 2025 & 2033
- Figure 21: Asia Pacific Functional Printing Industry Revenue Share (%), by Printing Technology 2025 & 2033
- Figure 22: Asia Pacific Functional Printing Industry Revenue (billion), by Application 2025 & 2033
- Figure 23: Asia Pacific Functional Printing Industry Revenue Share (%), by Application 2025 & 2033
- Figure 24: Asia Pacific Functional Printing Industry Revenue (billion), by Country 2025 & 2033
- Figure 25: Asia Pacific Functional Printing Industry Revenue Share (%), by Country 2025 & 2033
- Figure 26: South America Functional Printing Industry Revenue (billion), by Material 2025 & 2033
- Figure 27: South America Functional Printing Industry Revenue Share (%), by Material 2025 & 2033
- Figure 28: South America Functional Printing Industry Revenue (billion), by Printing Technology 2025 & 2033
- Figure 29: South America Functional Printing Industry Revenue Share (%), by Printing Technology 2025 & 2033
- Figure 30: South America Functional Printing Industry Revenue (billion), by Application 2025 & 2033
- Figure 31: South America Functional Printing Industry Revenue Share (%), by Application 2025 & 2033
- Figure 32: South America Functional Printing Industry Revenue (billion), by Country 2025 & 2033
- Figure 33: South America Functional Printing Industry Revenue Share (%), by Country 2025 & 2033
- Figure 34: Middle East and Africa Functional Printing Industry Revenue (billion), by Material 2025 & 2033
- Figure 35: Middle East and Africa Functional Printing Industry Revenue Share (%), by Material 2025 & 2033
- Figure 36: Middle East and Africa Functional Printing Industry Revenue (billion), by Printing Technology 2025 & 2033
- Figure 37: Middle East and Africa Functional Printing Industry Revenue Share (%), by Printing Technology 2025 & 2033
- Figure 38: Middle East and Africa Functional Printing Industry Revenue (billion), by Application 2025 & 2033
- Figure 39: Middle East and Africa Functional Printing Industry Revenue Share (%), by Application 2025 & 2033
- Figure 40: Middle East and Africa Functional Printing Industry Revenue (billion), by Country 2025 & 2033
- Figure 41: Middle East and Africa Functional Printing Industry Revenue Share (%), by Country 2025 & 2033
List of Tables
- Table 1: Global Functional Printing Industry Revenue billion Forecast, by Material 2020 & 2033
- Table 2: Global Functional Printing Industry Revenue billion Forecast, by Printing Technology 2020 & 2033
- Table 3: Global Functional Printing Industry Revenue billion Forecast, by Application 2020 & 2033
- Table 4: Global Functional Printing Industry Revenue billion Forecast, by Region 2020 & 2033
- Table 5: Global Functional Printing Industry Revenue billion Forecast, by Material 2020 & 2033
- Table 6: Global Functional Printing Industry Revenue billion Forecast, by Printing Technology 2020 & 2033
- Table 7: Global Functional Printing Industry Revenue billion Forecast, by Application 2020 & 2033
- Table 8: Global Functional Printing Industry Revenue billion Forecast, by Country 2020 & 2033
- Table 9: Global Functional Printing Industry Revenue billion Forecast, by Material 2020 & 2033
- Table 10: Global Functional Printing Industry Revenue billion Forecast, by Printing Technology 2020 & 2033
- Table 11: Global Functional Printing Industry Revenue billion Forecast, by Application 2020 & 2033
- Table 12: Global Functional Printing Industry Revenue billion Forecast, by Country 2020 & 2033
- Table 13: Global Functional Printing Industry Revenue billion Forecast, by Material 2020 & 2033
- Table 14: Global Functional Printing Industry Revenue billion Forecast, by Printing Technology 2020 & 2033
- Table 15: Global Functional Printing Industry Revenue billion Forecast, by Application 2020 & 2033
- Table 16: Global Functional Printing Industry Revenue billion Forecast, by Country 2020 & 2033
- Table 17: Global Functional Printing Industry Revenue billion Forecast, by Material 2020 & 2033
- Table 18: Global Functional Printing Industry Revenue billion Forecast, by Printing Technology 2020 & 2033
- Table 19: Global Functional Printing Industry Revenue billion Forecast, by Application 2020 & 2033
- Table 20: Global Functional Printing Industry Revenue billion Forecast, by Country 2020 & 2033
- Table 21: Global Functional Printing Industry Revenue billion Forecast, by Material 2020 & 2033
- Table 22: Global Functional Printing Industry Revenue billion Forecast, by Printing Technology 2020 & 2033
- Table 23: Global Functional Printing Industry Revenue billion Forecast, by Application 2020 & 2033
- Table 24: Global Functional Printing Industry Revenue billion Forecast, by Country 2020 & 2033
Frequently Asked Questions
1. What is the projected Compound Annual Growth Rate (CAGR) of the Functional Printing Industry?
The projected CAGR is approximately 19.3%.
2. Which companies are prominent players in the Functional Printing Industry?
Key companies in the market include Vorbeck Materials Corporation, Ceradrop - MGI Group, Xaar PLC, Nanosolar Inc, ALTANA AG, Toyo Ink Sc Holding Co Ltd, GSI Technologies LLC, Blue Spark Technologies, Eastman Kodak Company Ltd, Optomec Inc, Toppan Forms Co Ltd, Xennia Technology Limited, Isorg, BASF SE, Avery Dennison Corporation, AGFA - Gevaent Corporation, CEMITEC (Multidisciplinary Centre of Technology for Industry)*List Not Exhaustive, E Ink Holdings Inc, Novaled AG, Enfucell Oy, Mark Andy Inc.
3. What are the main segments of the Functional Printing Industry?
The market segments include Material, Printing Technology, Application.
4. Can you provide details about the market size?
The market size is estimated to be USD 36.1 billion as of 2022.
5. What are some drivers contributing to market growth?
; Increasing Demand for Low Cost and High-speed Manufacturing; Simplified Additive Manufacturing and a Wide Range of Substrates.
6. What are the notable trends driving market growth?
Inkjet Printing to Significantly Drive the Market Growth.
7. Are there any restraints impacting market growth?
; Existing Technologies are not Suitable for Electronic Printing.
8. Can you provide examples of recent developments in the market?
N/A
9. What pricing options are available for accessing the report?
Pricing options include single-user, multi-user, and enterprise licenses priced at USD 4750, USD 5250, and USD 8750 respectively.
10. Is the market size provided in terms of value or volume?
The market size is provided in terms of value, measured in billion.
11. Are there any specific market keywords associated with the report?
Yes, the market keyword associated with the report is "Functional Printing Industry," which aids in identifying and referencing the specific market segment covered.
12. How do I determine which pricing option suits my needs best?
The pricing options vary based on user requirements and access needs. Individual users may opt for single-user licenses, while businesses requiring broader access may choose multi-user or enterprise licenses for cost-effective access to the report.
13. Are there any additional resources or data provided in the Functional Printing Industry report?
While the report offers comprehensive insights, it's advisable to review the specific contents or supplementary materials provided to ascertain if additional resources or data are available.
14. How can I stay updated on further developments or reports in the Functional Printing Industry?
To stay informed about further developments, trends, and reports in the Functional Printing Industry, consider subscribing to industry newsletters, following relevant companies and organizations, or regularly checking reputable industry news sources and publications.
Methodology
Step 1 - Identification of Relevant Samples Size from Population Database


Step 2 - Approaches for Defining Global Market Size (Value, Volume* & Price*)

Note*: In applicable scenarios
Step 3 - Data Sources
Primary Research
- Web Analytics
- Survey Reports
- Research Institute
- Latest Research Reports
- Opinion Leaders
Secondary Research
- Annual Reports
- White Paper
- Latest Press Release
- Industry Association
- Paid Database
- Investor Presentations

Step 4 - Data Triangulation
Involves using different sources of information in order to increase the validity of a study
These sources are likely to be stakeholders in a program - participants, other researchers, program staff, other community members, and so on.
Then we put all data in single framework & apply various statistical tools to find out the dynamic on the market.
During the analysis stage, feedback from the stakeholder groups would be compared to determine areas of agreement as well as areas of divergence