


Key Insights
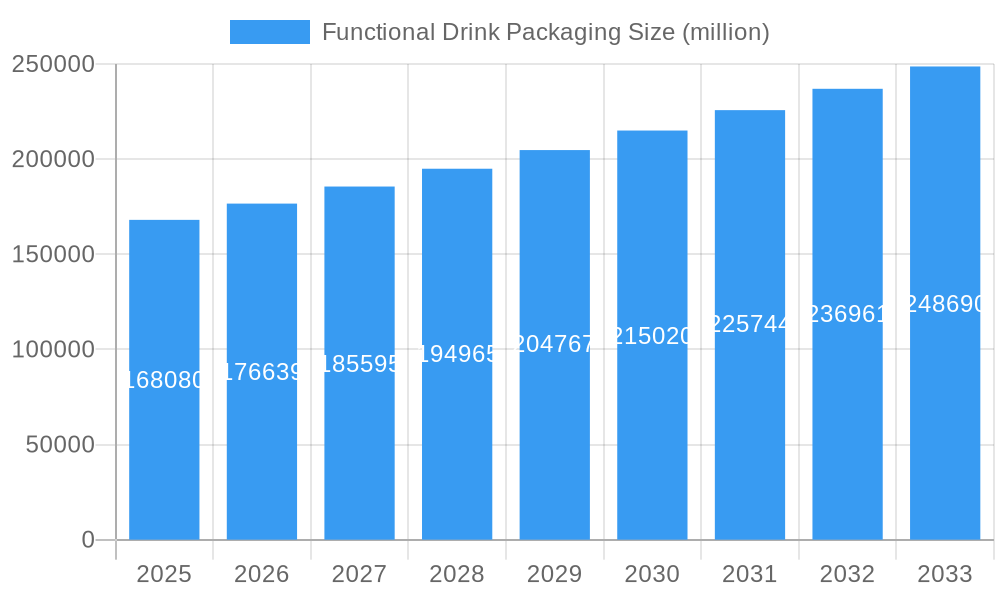
The global Functional Drink Packaging market is projected to reach an estimated $168.08 billion in 2025, exhibiting a robust compound annual growth rate (CAGR) of 5.05% throughout the forecast period of 2025-2033. This significant expansion is primarily propelled by escalating consumer demand for healthier beverage options, including energy drinks, functional fruit and vegetable juices, and sports beverages. The increasing awareness of the health benefits associated with probiotics and prebiotics further fuels the growth of specialized packaging solutions for these innovative drinks. Furthermore, the market is being shaped by a discernible shift towards sustainable and eco-friendly packaging materials, driven by both regulatory pressures and a growing consumer consciousness regarding environmental impact. Brands are actively investing in innovative packaging designs that not only preserve product integrity and extend shelf life but also enhance consumer appeal and convenience.
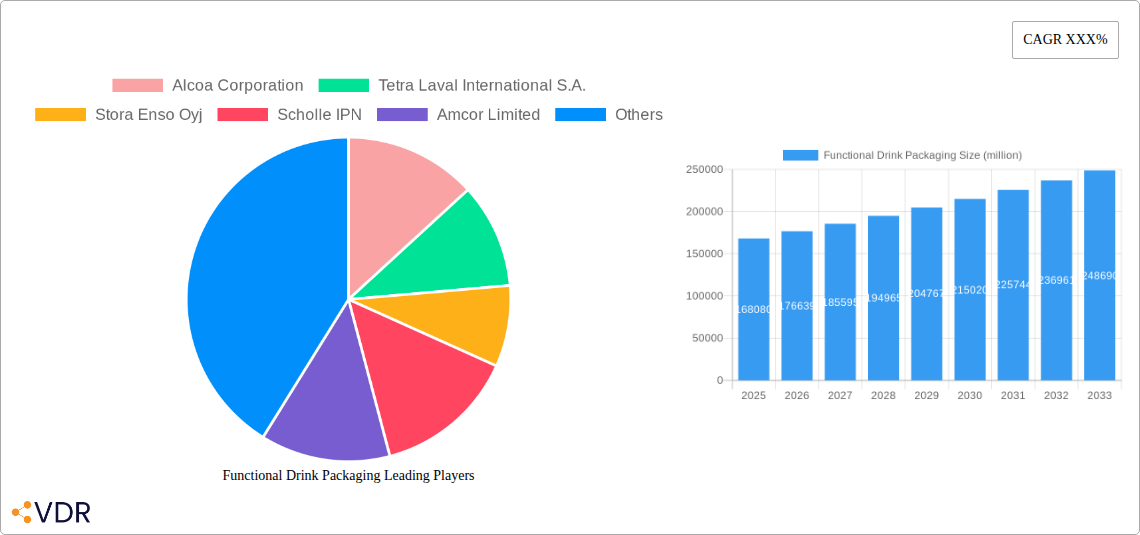
Functional Drink Packaging Market Size (In Billion)

However, the market also faces certain restraints, such as the increasing cost of raw materials and sophisticated manufacturing technologies required for advanced packaging solutions. Stringent government regulations concerning packaging waste and recycling can also pose challenges, necessitating continuous adaptation and investment in compliant alternatives. Despite these hurdles, the overarching trend towards premiumization and the growing popularity of on-the-go consumption continue to drive innovation in flexible, lightweight, and aesthetically pleasing packaging. Key players are focusing on developing advanced barrier properties and smart packaging features to maintain product freshness and provide enhanced consumer experience, thereby solidifying the market's upward trajectory.
Functional Drink Packaging Company Market Share
Comprehensive Report: Functional Drink Packaging Market Analysis (2019-2033)
This in-depth report provides a critical analysis of the global Functional Drink Packaging market, covering its current state, historical trends, and future trajectory. With a study period from 2019 to 2033, including a base year of 2025 and a forecast period extending to 2033, this report offers invaluable insights for industry stakeholders. We delve into market dynamics, growth trends, regional dominance, product innovations, key drivers, challenges, and emerging opportunities, all supported by quantitative data and qualitative analysis. The report also highlights key players and notable milestones, culminating in a forward-looking market outlook.
Functional Drink Packaging Market Dynamics & Structure
The functional drink packaging market is characterized by a moderate to high level of concentration, with key players like Alcoa Corporation, Tetra Laval International S.A., and Amcor Limited holding significant market shares. Technological innovation is a primary driver, with ongoing advancements in barrier properties, lightweighting, and sustainable materials. Regulatory frameworks, particularly those pertaining to food contact materials and environmental impact, are shaping manufacturing processes and material choices. Competitive product substitutes, such as cartons and flexible pouches, present a dynamic competitive landscape against traditional rigid containers. End-user demographics, including a growing health-conscious and on-the-go consumer base, are influencing packaging design and functionality. Mergers and acquisitions (M&A) activity has been steady, with companies seeking to expand their product portfolios and geographical reach. For instance, the last three years have seen an average of 15-20 significant M&A deals, indicating a consolidation trend. Barriers to innovation include the high cost of R&D for novel materials and the stringent approval processes for food-grade packaging.
- Market Concentration: Moderate to High, with leading players investing heavily in R&D.
- Technological Innovation: Focus on sustainable materials, advanced barrier technologies, and smart packaging.
- Regulatory Frameworks: Strict compliance with food safety and environmental standards is paramount.
- Competitive Substitutes: Rise of flexible packaging and multi-layer solutions challenging traditional materials.
- End-User Demographics: Increasing demand for convenience, health benefits, and eco-friendly options.
- M&A Trends: Strategic acquisitions to enhance market position and technological capabilities.
Functional Drink Packaging Growth Trends & Insights
The functional drink packaging market is projected to experience robust growth, driven by escalating consumer demand for beverages that offer enhanced health and wellness benefits. The global market size for functional drink packaging is estimated to reach approximately USD 65.2 billion in 2025, with a projected Compound Annual Growth Rate (CAGR) of 5.8% from 2025 to 2033, bringing the market value to an estimated USD 102.7 billion by 2033. This expansion is fueled by an increasing awareness of the link between diet and health, leading consumers to actively seek out drinks fortified with vitamins, minerals, probiotics, and other functional ingredients. Adoption rates for innovative packaging solutions are rising, as brands aim to differentiate themselves in a crowded marketplace and cater to the evolving preferences of health-conscious consumers.
Technological disruptions are playing a pivotal role, with the development of materials offering superior shelf-life extension, improved recyclability, and enhanced consumer convenience. Innovations such as lightweighting of plastics, the use of recycled content, and the development of biodegradable and compostable packaging materials are gaining traction. Furthermore, the integration of smart technologies, like QR codes for traceability and interactive labels, is enhancing consumer engagement. Consumer behavior shifts are undeniably central to this growth. The demand for on-the-go consumption, driven by increasingly busy lifestyles, necessitates packaging that is portable, resealable, and easy to handle. The rising popularity of sports beverages, energy drinks, and functional fruit and vegetable juices, all of which typically require specialized packaging to maintain product integrity and appeal, is a significant market enabler.
The market penetration of functional drinks themselves is also a key indicator. As more functional beverages enter the market across diverse categories like prebiotic and probiotic drinks, the corresponding demand for their specialized packaging solutions increases proportionally. This creates a direct correlation between beverage innovation and packaging market growth. The market is observing a steady increase in the adoption of advanced packaging formats that not only protect the product but also enhance its perceived value and functionality. For example, the growing preference for single-serve, resealable containers for sports beverages and the development of advanced multi-layer structures for extended shelf-life functional juices are indicative of these trends. The overall outlook suggests a dynamic market where innovation in both beverage formulation and packaging technology will continue to drive significant expansion in the coming years.
Dominant Regions, Countries, or Segments in Functional Drink Packaging
North America currently stands as the dominant region in the functional drink packaging market, with an estimated market share of 32.5% in 2025. This dominance is propelled by a confluence of factors, including a well-established functional beverage industry, high consumer disposable income, and a strong emphasis on health and wellness. The United States, in particular, is a leading consumer of energy beverages and functional fruit and vegetable juices, driving substantial demand for sophisticated packaging solutions. Furthermore, stringent regulations promoting sustainable packaging and waste reduction initiatives are indirectly fostering innovation and the adoption of advanced materials like PET and advanced composites in the region.
From an Application perspective, Energy Beverages represent a major growth driver within the functional drink packaging market. The segment is expected to account for approximately 28% of the total functional drink packaging market in 2025, valued at USD 17.9 billion. This segment's growth is fueled by a young, active demographic seeking performance enhancement and an alternative to traditional caffeinated beverages. Packaging for energy drinks often prioritizes convenience, portability, and eye-catching designs that convey dynamism and efficacy.
By Material Type, Plastic packaging, particularly PET (Polyethylene Terephthalate), is the most dominant segment, holding an estimated 45% market share in 2025, valued at USD 29.3 billion. PET offers excellent clarity, lightweight properties, and recyclability, making it a preferred choice for a wide range of functional beverages. Its versatility allows for various form factors, from small single-serve bottles to larger multi-pack containers.
By Capacity Type, Less than 250 ml is a significant and growing segment, driven by the rise of single-serve functional drinks such as shots and small-format probiotic beverages. This segment is projected to hold around 30% of the market in 2025, valued at USD 19.6 billion, reflecting the consumer preference for convenient, portion-controlled options.
- North America's Dominance: Driven by high consumer spending, health consciousness, and advanced beverage industry.
- United States: A key market for energy drinks and functional juices, influencing packaging trends.
- Energy Beverages Application: Significant growth due to increasing demand for performance and wellness drinks.
- Plastic (PET) Material Type: Preferred for its versatility, recyclability, and cost-effectiveness.
- Less than 250 ml Capacity Type: Growing demand for single-serve, convenient functional drink formats.
Functional Drink Packaging Product Landscape
The functional drink packaging market is witnessing continuous product innovation, focusing on enhancing shelf-life, convenience, and sustainability. Key advancements include the development of advanced barrier coatings for plastic bottles, preserving the efficacy of sensitive ingredients like probiotics and antioxidants. Lightweighting initiatives are prominent, reducing material usage and transportation costs without compromising structural integrity. Innovations in resealable closures and ergonomic designs are catering to the on-the-go consumer. Furthermore, the integration of antimicrobial additives and UV-blocking materials ensures optimal product protection. Unique selling propositions often revolve around tamper-evident features, enhanced recyclability, and the use of post-consumer recycled (PCR) content.
Key Drivers, Barriers & Challenges in Functional Drink Packaging
Key Drivers:
- Growing Health and Wellness Consciousness: Consumers actively seeking beverages with functional benefits like immunity support, energy boost, and gut health.
- Rising Disposable Incomes: Enabling consumers to spend more on premium and health-oriented functional drinks.
- Technological Advancements: Innovations in materials science, barrier technologies, and sustainable packaging solutions.
- Convenience and On-the-Go Lifestyles: Demand for portable, easy-to-open, and resealable packaging.
- Evolving Beverage Trends: Proliferation of sports drinks, energy drinks, probiotic beverages, and enhanced juices.
Barriers & Challenges:
- High Cost of Sustainable Materials: Eco-friendly packaging solutions can be more expensive than conventional options.
- Complex Supply Chains: Ensuring consistent quality and availability of specialized packaging materials.
- Regulatory Hurdles: Stringent food contact regulations and varying environmental policies across regions.
- Consumer Perception of Recyclability: Educating consumers on proper disposal and recycling practices.
- Competition from Traditional Packaging: Established and cost-effective packaging formats still hold market share.
Emerging Opportunities in Functional Drink Packaging
Emerging opportunities in the functional drink packaging market lie in the expansion of sustainable packaging solutions, including compostable and biodegradable materials, to meet growing consumer and regulatory demand for eco-friendly options. The development of smart packaging, featuring embedded sensors or indicators for product freshness and authenticity, presents a significant avenue for differentiation. Untapped markets in developing economies, with increasing disposable incomes and a growing awareness of health benefits, offer substantial growth potential. Innovative applications for prebiotic and probiotic drinks, requiring specialized oxygen-barrier properties, are creating demand for advanced multi-layer films and bottle designs.
Growth Accelerators in the Functional Drink Packaging Industry
The functional drink packaging industry's long-term growth is being accelerated by strategic partnerships between beverage manufacturers and packaging suppliers to co-develop innovative solutions. Technological breakthroughs in material science, leading to the creation of high-performance, sustainable, and cost-effective packaging, are key catalysts. Market expansion strategies, particularly targeting emerging economies with growing health consciousness, are further propelling growth. The increasing focus on circular economy principles and the development of robust recycling infrastructure are also acting as significant growth accelerators, encouraging the adoption of recyclable and reusable packaging formats.
Key Players Shaping the Functional Drink Packaging Market
- Alcoa Corporation
- Tetra Laval International S.A.
- Stora Enso Oyj
- Scholle IPN
- Amcor Limited
- Saint-Gobain S.A
- Sonoco Products Company
- Mondi plc
- Crown Holdings Inc
- Ardagh Group Inc
- Graham Packaging Company
- Owens-Illinois, Inc
- Ball Corporation
- Allied Glass Containers
- CANPACK Group
- CKS Packaging, Inc
- AptarGroup Inc
Notable Milestones in Functional Drink Packaging Sector
- 2019: Increased adoption of rPET (recycled PET) in beverage bottles, driven by corporate sustainability goals.
- 2020: Launch of novel barrier coatings for plastics, extending shelf-life of sensitive functional ingredients.
- 2021: Significant investments in advanced recycling technologies by major packaging manufacturers.
- 2022: Growing consumer preference for lightweight and easily recyclable packaging materials.
- 2023: Introduction of plant-based and compostable packaging alternatives gaining traction.
- 2024: Development of smart packaging solutions with enhanced traceability and consumer engagement features.
In-Depth Functional Drink Packaging Market Outlook
The functional drink packaging market is poised for sustained growth, driven by ongoing consumer prioritization of health and wellness, coupled with significant advancements in sustainable and intelligent packaging technologies. Strategic partnerships and market expansion into emerging economies will continue to be key growth accelerators. The industry's ability to innovate and adapt to evolving consumer preferences for convenience and environmental responsibility will define its future success, presenting substantial opportunities for stakeholders.
Functional Drink Packaging Segmentation
-
1. Application
- 1.1. Energy Beverages
- 1.2. Functional Fruit and Vegetable Juices
- 1.3. Sports Beverages
- 1.4. Prebiotic and Probiotic Drinks
- 1.5. Others
-
2. Type
- 2.1. By Material Type
- 2.2. By Capacity Type
Functional Drink Packaging Segmentation By Geography
-
1. North America
- 1.1. United States
- 1.2. Canada
- 1.3. Mexico
-
2. South America
- 2.1. Brazil
- 2.2. Argentina
- 2.3. Rest of South America
-
3. Europe
- 3.1. United Kingdom
- 3.2. Germany
- 3.3. France
- 3.4. Italy
- 3.5. Spain
- 3.6. Russia
- 3.7. Benelux
- 3.8. Nordics
- 3.9. Rest of Europe
-
4. Middle East & Africa
- 4.1. Turkey
- 4.2. Israel
- 4.3. GCC
- 4.4. North Africa
- 4.5. South Africa
- 4.6. Rest of Middle East & Africa
-
5. Asia Pacific
- 5.1. China
- 5.2. India
- 5.3. Japan
- 5.4. South Korea
- 5.5. ASEAN
- 5.6. Oceania
- 5.7. Rest of Asia Pacific
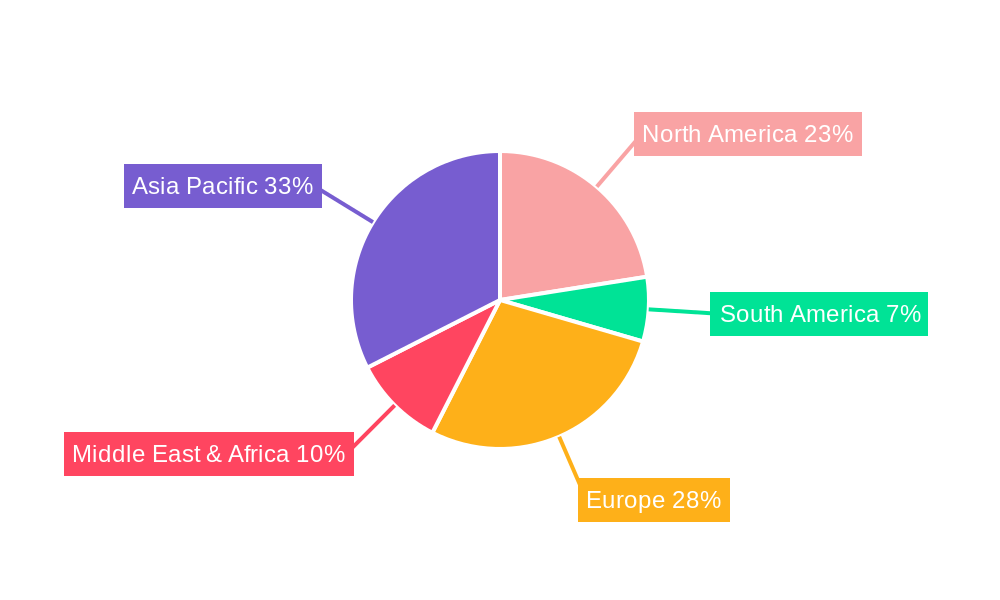
Functional Drink Packaging Regional Market Share
Geographic Coverage of Functional Drink Packaging
Functional Drink Packaging REPORT HIGHLIGHTS
| Aspects | Details |
|---|---|
| Study Period | 2020-2034 |
| Base Year | 2025 |
| Estimated Year | 2026 |
| Forecast Period | 2026-2034 |
| Historical Period | 2020-2025 |
| Growth Rate | CAGR of 5.05% from 2020-2034 |
| Segmentation |
|
Table of Contents
- 1. Introduction
- 1.1. Research Scope
- 1.2. Market Segmentation
- 1.3. Research Objective
- 1.4. Definitions and Assumptions
- 2. Executive Summary
- 2.1. Market Snapshot
- 3. Market Dynamics
- 3.1. Market Drivers
- 3.2. Market Restrains
- 3.3. Market Trends
- 3.4. Market Opportunities
- 4. Market Factor Analysis
- 4.1. Porters Five Forces
- 4.1.1. Bargaining Power of Suppliers
- 4.1.2. Bargaining Power of Buyers
- 4.1.3. Threat of New Entrants
- 4.1.4. Threat of Substitutes
- 4.1.5. Competitive Rivalry
- 4.2. PESTEL analysis
- 4.3. BCG Analysis
- 4.3.1. Stars (High Growth, High Market Share)
- 4.3.2. Cash Cows (Low Growth, High Market Share)
- 4.3.3. Question Mark (High Growth, Low Market Share)
- 4.3.4. Dogs (Low Growth, Low Market Share)
- 4.4. Ansoff Matrix Analysis
- 4.5. Supply Chain Analysis
- 4.6. Regulatory Landscape
- 4.7. Current Market Potential and Opportunity Assessment (TAM–SAM–SOM Framework)
- 4.8. VDR Analyst Note
- 4.1. Porters Five Forces
- 5. Market Analysis, Insights and Forecast 2021-2033
- 5.1. Market Analysis, Insights and Forecast - by Application
- 5.1.1. Energy Beverages
- 5.1.2. Functional Fruit and Vegetable Juices
- 5.1.3. Sports Beverages
- 5.1.4. Prebiotic and Probiotic Drinks
- 5.1.5. Others
- 5.2. Market Analysis, Insights and Forecast - by Type
- 5.2.1. By Material Type
- 5.2.2. By Capacity Type
- 5.3. Market Analysis, Insights and Forecast - by Region
- 5.3.1. North America
- 5.3.2. South America
- 5.3.3. Europe
- 5.3.4. Middle East & Africa
- 5.3.5. Asia Pacific
- 5.1. Market Analysis, Insights and Forecast - by Application
- 6. Global Functional Drink Packaging Analysis, Insights and Forecast, 2021-2033
- 6.1. Market Analysis, Insights and Forecast - by Application
- 6.1.1. Energy Beverages
- 6.1.2. Functional Fruit and Vegetable Juices
- 6.1.3. Sports Beverages
- 6.1.4. Prebiotic and Probiotic Drinks
- 6.1.5. Others
- 6.2. Market Analysis, Insights and Forecast - by Type
- 6.2.1. By Material Type
- 6.2.2. By Capacity Type
- 6.1. Market Analysis, Insights and Forecast - by Application
- 7. North America Functional Drink Packaging Analysis, Insights and Forecast, 2021-2033
- 7.1. Market Analysis, Insights and Forecast - by Application
- 7.1.1. Energy Beverages
- 7.1.2. Functional Fruit and Vegetable Juices
- 7.1.3. Sports Beverages
- 7.1.4. Prebiotic and Probiotic Drinks
- 7.1.5. Others
- 7.2. Market Analysis, Insights and Forecast - by Type
- 7.2.1. By Material Type
- 7.2.2. By Capacity Type
- 7.1. Market Analysis, Insights and Forecast - by Application
- 8. South America Functional Drink Packaging Analysis, Insights and Forecast, 2021-2033
- 8.1. Market Analysis, Insights and Forecast - by Application
- 8.1.1. Energy Beverages
- 8.1.2. Functional Fruit and Vegetable Juices
- 8.1.3. Sports Beverages
- 8.1.4. Prebiotic and Probiotic Drinks
- 8.1.5. Others
- 8.2. Market Analysis, Insights and Forecast - by Type
- 8.2.1. By Material Type
- 8.2.2. By Capacity Type
- 8.1. Market Analysis, Insights and Forecast - by Application
- 9. Europe Functional Drink Packaging Analysis, Insights and Forecast, 2021-2033
- 9.1. Market Analysis, Insights and Forecast - by Application
- 9.1.1. Energy Beverages
- 9.1.2. Functional Fruit and Vegetable Juices
- 9.1.3. Sports Beverages
- 9.1.4. Prebiotic and Probiotic Drinks
- 9.1.5. Others
- 9.2. Market Analysis, Insights and Forecast - by Type
- 9.2.1. By Material Type
- 9.2.2. By Capacity Type
- 9.1. Market Analysis, Insights and Forecast - by Application
- 10. Middle East & Africa Functional Drink Packaging Analysis, Insights and Forecast, 2021-2033
- 10.1. Market Analysis, Insights and Forecast - by Application
- 10.1.1. Energy Beverages
- 10.1.2. Functional Fruit and Vegetable Juices
- 10.1.3. Sports Beverages
- 10.1.4. Prebiotic and Probiotic Drinks
- 10.1.5. Others
- 10.2. Market Analysis, Insights and Forecast - by Type
- 10.2.1. By Material Type
- 10.2.2. By Capacity Type
- 10.1. Market Analysis, Insights and Forecast - by Application
- 11. Asia Pacific Functional Drink Packaging Analysis, Insights and Forecast, 2021-2033
- 11.1. Market Analysis, Insights and Forecast - by Application
- 11.1.1. Energy Beverages
- 11.1.2. Functional Fruit and Vegetable Juices
- 11.1.3. Sports Beverages
- 11.1.4. Prebiotic and Probiotic Drinks
- 11.1.5. Others
- 11.2. Market Analysis, Insights and Forecast - by Type
- 11.2.1. By Material Type
- 11.2.2. By Capacity Type
- 11.1. Market Analysis, Insights and Forecast - by Application
- 12. Competitive Analysis
- 12.1. Company Profiles
- 12.1.1 Alcoa Corporation
- 12.1.1.1. Company Overview
- 12.1.1.2. Products
- 12.1.1.3. Company Financials
- 12.1.1.4. SWOT Analysis
- 12.1.2 Tetra Laval International S.A.
- 12.1.2.1. Company Overview
- 12.1.2.2. Products
- 12.1.2.3. Company Financials
- 12.1.2.4. SWOT Analysis
- 12.1.3 Stora Enso Oyj
- 12.1.3.1. Company Overview
- 12.1.3.2. Products
- 12.1.3.3. Company Financials
- 12.1.3.4. SWOT Analysis
- 12.1.4 Scholle IPN
- 12.1.4.1. Company Overview
- 12.1.4.2. Products
- 12.1.4.3. Company Financials
- 12.1.4.4. SWOT Analysis
- 12.1.5 Amcor Limited
- 12.1.5.1. Company Overview
- 12.1.5.2. Products
- 12.1.5.3. Company Financials
- 12.1.5.4. SWOT Analysis
- 12.1.6 Saint-Gobain S.A
- 12.1.6.1. Company Overview
- 12.1.6.2. Products
- 12.1.6.3. Company Financials
- 12.1.6.4. SWOT Analysis
- 12.1.7 Sonoco Products Company
- 12.1.7.1. Company Overview
- 12.1.7.2. Products
- 12.1.7.3. Company Financials
- 12.1.7.4. SWOT Analysis
- 12.1.8 Mondi plc
- 12.1.8.1. Company Overview
- 12.1.8.2. Products
- 12.1.8.3. Company Financials
- 12.1.8.4. SWOT Analysis
- 12.1.9 Crown Holdings Inc
- 12.1.9.1. Company Overview
- 12.1.9.2. Products
- 12.1.9.3. Company Financials
- 12.1.9.4. SWOT Analysis
- 12.1.10 Ardagh Group Inc
- 12.1.10.1. Company Overview
- 12.1.10.2. Products
- 12.1.10.3. Company Financials
- 12.1.10.4. SWOT Analysis
- 12.1.11 Graham Packaging Company
- 12.1.11.1. Company Overview
- 12.1.11.2. Products
- 12.1.11.3. Company Financials
- 12.1.11.4. SWOT Analysis
- 12.1.12 Owens-Illinois Inc
- 12.1.12.1. Company Overview
- 12.1.12.2. Products
- 12.1.12.3. Company Financials
- 12.1.12.4. SWOT Analysis
- 12.1.13 Ball Corporation
- 12.1.13.1. Company Overview
- 12.1.13.2. Products
- 12.1.13.3. Company Financials
- 12.1.13.4. SWOT Analysis
- 12.1.14 Allied Glass Containers
- 12.1.14.1. Company Overview
- 12.1.14.2. Products
- 12.1.14.3. Company Financials
- 12.1.14.4. SWOT Analysis
- 12.1.15 CANPACK Group
- 12.1.15.1. Company Overview
- 12.1.15.2. Products
- 12.1.15.3. Company Financials
- 12.1.15.4. SWOT Analysis
- 12.1.16 CKS Packaging Inc
- 12.1.16.1. Company Overview
- 12.1.16.2. Products
- 12.1.16.3. Company Financials
- 12.1.16.4. SWOT Analysis
- 12.1.17 AptarGroup Inc
- 12.1.17.1. Company Overview
- 12.1.17.2. Products
- 12.1.17.3. Company Financials
- 12.1.17.4. SWOT Analysis
- 12.1.1 Alcoa Corporation
- 12.2. Market Entropy
- 12.2.1 Company's Key Areas Served
- 12.2.2 Recent Developments
- 12.3. Company Market Share Analysis 2025
- 12.3.1 Top 5 Companies Market Share Analysis
- 12.3.2 Top 3 Companies Market Share Analysis
- 12.4. List of Potential Customers
- 13. Research Methodology
List of Figures
- Figure 1: Global Functional Drink Packaging Revenue Breakdown (billion, %) by Region 2025 & 2033
- Figure 2: North America Functional Drink Packaging Revenue (billion), by Application 2025 & 2033
- Figure 3: North America Functional Drink Packaging Revenue Share (%), by Application 2025 & 2033
- Figure 4: North America Functional Drink Packaging Revenue (billion), by Type 2025 & 2033
- Figure 5: North America Functional Drink Packaging Revenue Share (%), by Type 2025 & 2033
- Figure 6: North America Functional Drink Packaging Revenue (billion), by Country 2025 & 2033
- Figure 7: North America Functional Drink Packaging Revenue Share (%), by Country 2025 & 2033
- Figure 8: South America Functional Drink Packaging Revenue (billion), by Application 2025 & 2033
- Figure 9: South America Functional Drink Packaging Revenue Share (%), by Application 2025 & 2033
- Figure 10: South America Functional Drink Packaging Revenue (billion), by Type 2025 & 2033
- Figure 11: South America Functional Drink Packaging Revenue Share (%), by Type 2025 & 2033
- Figure 12: South America Functional Drink Packaging Revenue (billion), by Country 2025 & 2033
- Figure 13: South America Functional Drink Packaging Revenue Share (%), by Country 2025 & 2033
- Figure 14: Europe Functional Drink Packaging Revenue (billion), by Application 2025 & 2033
- Figure 15: Europe Functional Drink Packaging Revenue Share (%), by Application 2025 & 2033
- Figure 16: Europe Functional Drink Packaging Revenue (billion), by Type 2025 & 2033
- Figure 17: Europe Functional Drink Packaging Revenue Share (%), by Type 2025 & 2033
- Figure 18: Europe Functional Drink Packaging Revenue (billion), by Country 2025 & 2033
- Figure 19: Europe Functional Drink Packaging Revenue Share (%), by Country 2025 & 2033
- Figure 20: Middle East & Africa Functional Drink Packaging Revenue (billion), by Application 2025 & 2033
- Figure 21: Middle East & Africa Functional Drink Packaging Revenue Share (%), by Application 2025 & 2033
- Figure 22: Middle East & Africa Functional Drink Packaging Revenue (billion), by Type 2025 & 2033
- Figure 23: Middle East & Africa Functional Drink Packaging Revenue Share (%), by Type 2025 & 2033
- Figure 24: Middle East & Africa Functional Drink Packaging Revenue (billion), by Country 2025 & 2033
- Figure 25: Middle East & Africa Functional Drink Packaging Revenue Share (%), by Country 2025 & 2033
- Figure 26: Asia Pacific Functional Drink Packaging Revenue (billion), by Application 2025 & 2033
- Figure 27: Asia Pacific Functional Drink Packaging Revenue Share (%), by Application 2025 & 2033
- Figure 28: Asia Pacific Functional Drink Packaging Revenue (billion), by Type 2025 & 2033
- Figure 29: Asia Pacific Functional Drink Packaging Revenue Share (%), by Type 2025 & 2033
- Figure 30: Asia Pacific Functional Drink Packaging Revenue (billion), by Country 2025 & 2033
- Figure 31: Asia Pacific Functional Drink Packaging Revenue Share (%), by Country 2025 & 2033
List of Tables
- Table 1: Global Functional Drink Packaging Revenue billion Forecast, by Application 2020 & 2033
- Table 2: Global Functional Drink Packaging Revenue billion Forecast, by Type 2020 & 2033
- Table 3: Global Functional Drink Packaging Revenue billion Forecast, by Region 2020 & 2033
- Table 4: Global Functional Drink Packaging Revenue billion Forecast, by Application 2020 & 2033
- Table 5: Global Functional Drink Packaging Revenue billion Forecast, by Type 2020 & 2033
- Table 6: Global Functional Drink Packaging Revenue billion Forecast, by Country 2020 & 2033
- Table 7: United States Functional Drink Packaging Revenue (billion) Forecast, by Application 2020 & 2033
- Table 8: Canada Functional Drink Packaging Revenue (billion) Forecast, by Application 2020 & 2033
- Table 9: Mexico Functional Drink Packaging Revenue (billion) Forecast, by Application 2020 & 2033
- Table 10: Global Functional Drink Packaging Revenue billion Forecast, by Application 2020 & 2033
- Table 11: Global Functional Drink Packaging Revenue billion Forecast, by Type 2020 & 2033
- Table 12: Global Functional Drink Packaging Revenue billion Forecast, by Country 2020 & 2033
- Table 13: Brazil Functional Drink Packaging Revenue (billion) Forecast, by Application 2020 & 2033
- Table 14: Argentina Functional Drink Packaging Revenue (billion) Forecast, by Application 2020 & 2033
- Table 15: Rest of South America Functional Drink Packaging Revenue (billion) Forecast, by Application 2020 & 2033
- Table 16: Global Functional Drink Packaging Revenue billion Forecast, by Application 2020 & 2033
- Table 17: Global Functional Drink Packaging Revenue billion Forecast, by Type 2020 & 2033
- Table 18: Global Functional Drink Packaging Revenue billion Forecast, by Country 2020 & 2033
- Table 19: United Kingdom Functional Drink Packaging Revenue (billion) Forecast, by Application 2020 & 2033
- Table 20: Germany Functional Drink Packaging Revenue (billion) Forecast, by Application 2020 & 2033
- Table 21: France Functional Drink Packaging Revenue (billion) Forecast, by Application 2020 & 2033
- Table 22: Italy Functional Drink Packaging Revenue (billion) Forecast, by Application 2020 & 2033
- Table 23: Spain Functional Drink Packaging Revenue (billion) Forecast, by Application 2020 & 2033
- Table 24: Russia Functional Drink Packaging Revenue (billion) Forecast, by Application 2020 & 2033
- Table 25: Benelux Functional Drink Packaging Revenue (billion) Forecast, by Application 2020 & 2033
- Table 26: Nordics Functional Drink Packaging Revenue (billion) Forecast, by Application 2020 & 2033
- Table 27: Rest of Europe Functional Drink Packaging Revenue (billion) Forecast, by Application 2020 & 2033
- Table 28: Global Functional Drink Packaging Revenue billion Forecast, by Application 2020 & 2033
- Table 29: Global Functional Drink Packaging Revenue billion Forecast, by Type 2020 & 2033
- Table 30: Global Functional Drink Packaging Revenue billion Forecast, by Country 2020 & 2033
- Table 31: Turkey Functional Drink Packaging Revenue (billion) Forecast, by Application 2020 & 2033
- Table 32: Israel Functional Drink Packaging Revenue (billion) Forecast, by Application 2020 & 2033
- Table 33: GCC Functional Drink Packaging Revenue (billion) Forecast, by Application 2020 & 2033
- Table 34: North Africa Functional Drink Packaging Revenue (billion) Forecast, by Application 2020 & 2033
- Table 35: South Africa Functional Drink Packaging Revenue (billion) Forecast, by Application 2020 & 2033
- Table 36: Rest of Middle East & Africa Functional Drink Packaging Revenue (billion) Forecast, by Application 2020 & 2033
- Table 37: Global Functional Drink Packaging Revenue billion Forecast, by Application 2020 & 2033
- Table 38: Global Functional Drink Packaging Revenue billion Forecast, by Type 2020 & 2033
- Table 39: Global Functional Drink Packaging Revenue billion Forecast, by Country 2020 & 2033
- Table 40: China Functional Drink Packaging Revenue (billion) Forecast, by Application 2020 & 2033
- Table 41: India Functional Drink Packaging Revenue (billion) Forecast, by Application 2020 & 2033
- Table 42: Japan Functional Drink Packaging Revenue (billion) Forecast, by Application 2020 & 2033
- Table 43: South Korea Functional Drink Packaging Revenue (billion) Forecast, by Application 2020 & 2033
- Table 44: ASEAN Functional Drink Packaging Revenue (billion) Forecast, by Application 2020 & 2033
- Table 45: Oceania Functional Drink Packaging Revenue (billion) Forecast, by Application 2020 & 2033
- Table 46: Rest of Asia Pacific Functional Drink Packaging Revenue (billion) Forecast, by Application 2020 & 2033
Frequently Asked Questions
1. What is the projected Compound Annual Growth Rate (CAGR) of the Functional Drink Packaging?
The projected CAGR is approximately 5.05%.
2. Which companies are prominent players in the Functional Drink Packaging?
Key companies in the market include Alcoa Corporation, Tetra Laval International S.A., Stora Enso Oyj, Scholle IPN, Amcor Limited, Saint-Gobain S.A, Sonoco Products Company, Mondi plc, Crown Holdings Inc, Ardagh Group Inc, Graham Packaging Company, Owens-Illinois, Inc, Ball Corporation, Allied Glass Containers, CANPACK Group, CKS Packaging, Inc, AptarGroup Inc.
3. What are the main segments of the Functional Drink Packaging?
The market segments include Application, Type.
4. Can you provide details about the market size?
The market size is estimated to be USD 168.08 billion as of 2022.
5. What are some drivers contributing to market growth?
N/A
6. What are the notable trends driving market growth?
N/A
7. Are there any restraints impacting market growth?
N/A
8. Can you provide examples of recent developments in the market?
N/A
9. What pricing options are available for accessing the report?
Pricing options include single-user, multi-user, and enterprise licenses priced at USD 2900.00, USD 4350.00, and USD 5800.00 respectively.
10. Is the market size provided in terms of value or volume?
The market size is provided in terms of value, measured in billion.
11. Are there any specific market keywords associated with the report?
Yes, the market keyword associated with the report is "Functional Drink Packaging," which aids in identifying and referencing the specific market segment covered.
12. How do I determine which pricing option suits my needs best?
The pricing options vary based on user requirements and access needs. Individual users may opt for single-user licenses, while businesses requiring broader access may choose multi-user or enterprise licenses for cost-effective access to the report.
13. Are there any additional resources or data provided in the Functional Drink Packaging report?
While the report offers comprehensive insights, it's advisable to review the specific contents or supplementary materials provided to ascertain if additional resources or data are available.
14. How can I stay updated on further developments or reports in the Functional Drink Packaging?
To stay informed about further developments, trends, and reports in the Functional Drink Packaging, consider subscribing to industry newsletters, following relevant companies and organizations, or regularly checking reputable industry news sources and publications.
Methodology
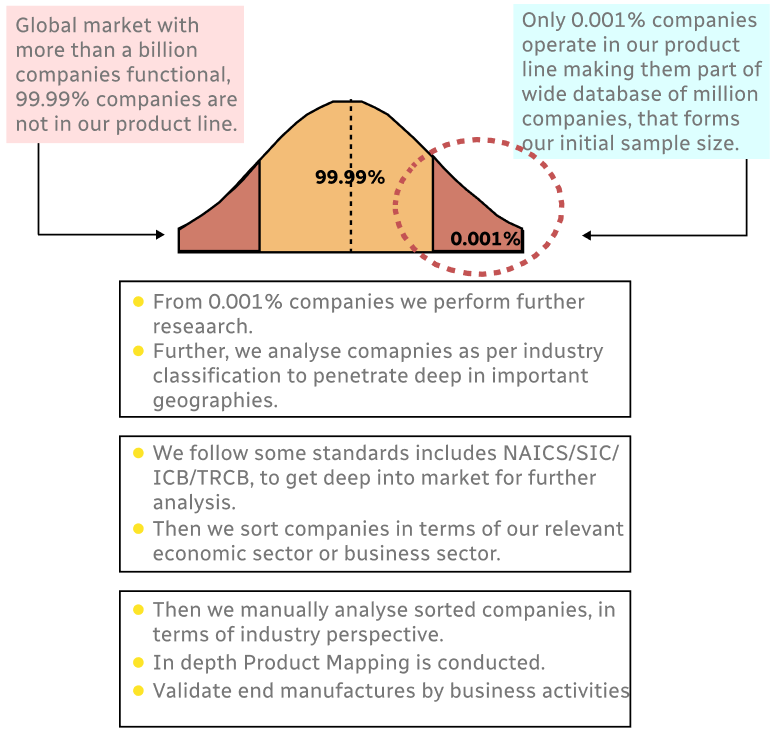
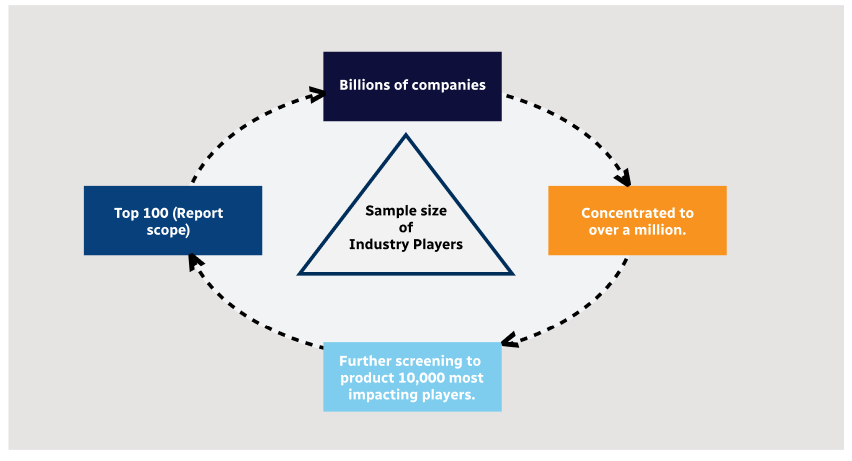
Step 1 - Identification of Relevant Samples Size from Population Database
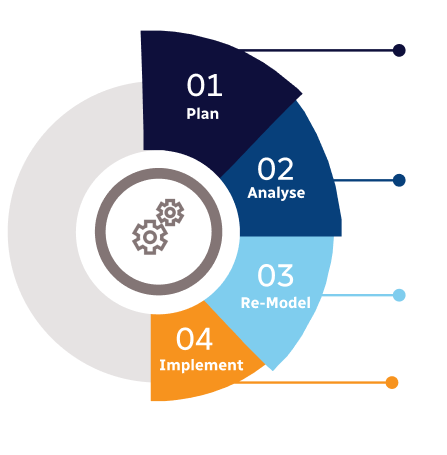
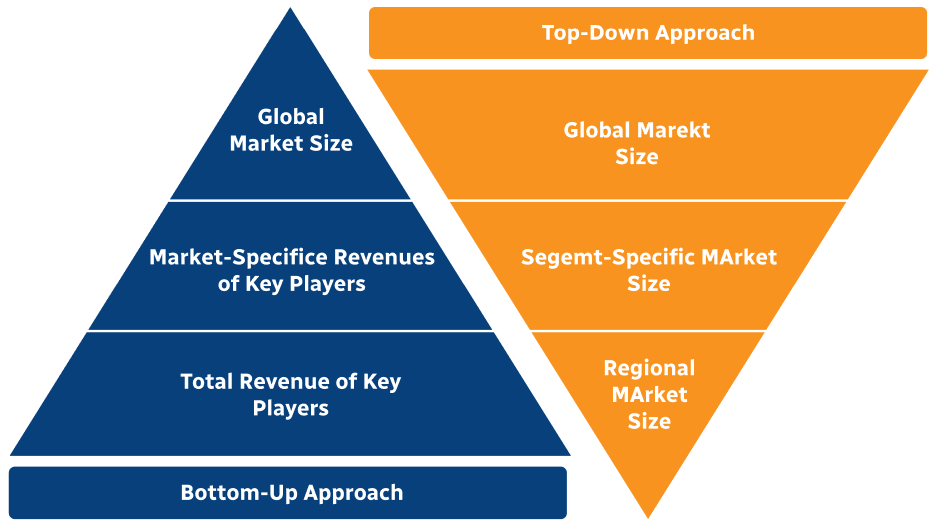
Step 2 - Approaches for Defining Global Market Size (Value, Volume* & Price*)
Note*: In applicable scenarios
Step 3 - Data Sources
Primary Research
- Web Analytics
- Survey Reports
- Research Institute
- Latest Research Reports
- Opinion Leaders
Secondary Research
- Annual Reports
- White Paper
- Latest Press Release
- Industry Association
- Paid Database
- Investor Presentations
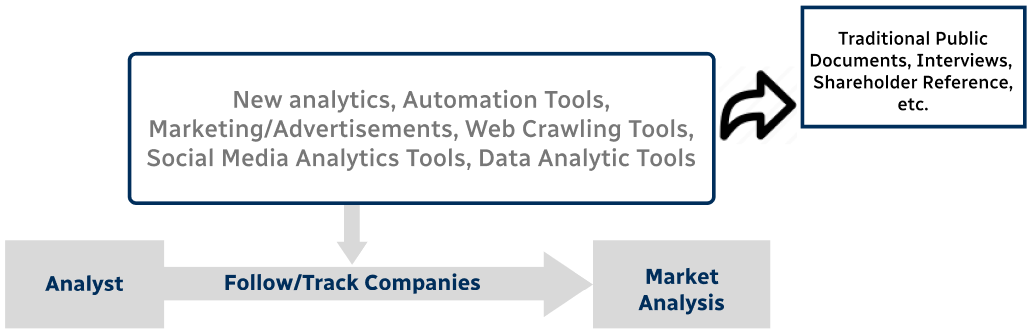
Step 4 - Data Triangulation
Involves using different sources of information in order to increase the validity of a study
These sources are likely to be stakeholders in a program - participants, other researchers, program staff, other community members, and so on.
Then we put all data in single framework & apply various statistical tools to find out the dynamic on the market.
During the analysis stage, feedback from the stakeholder groups would be compared to determine areas of agreement as well as areas of divergence