

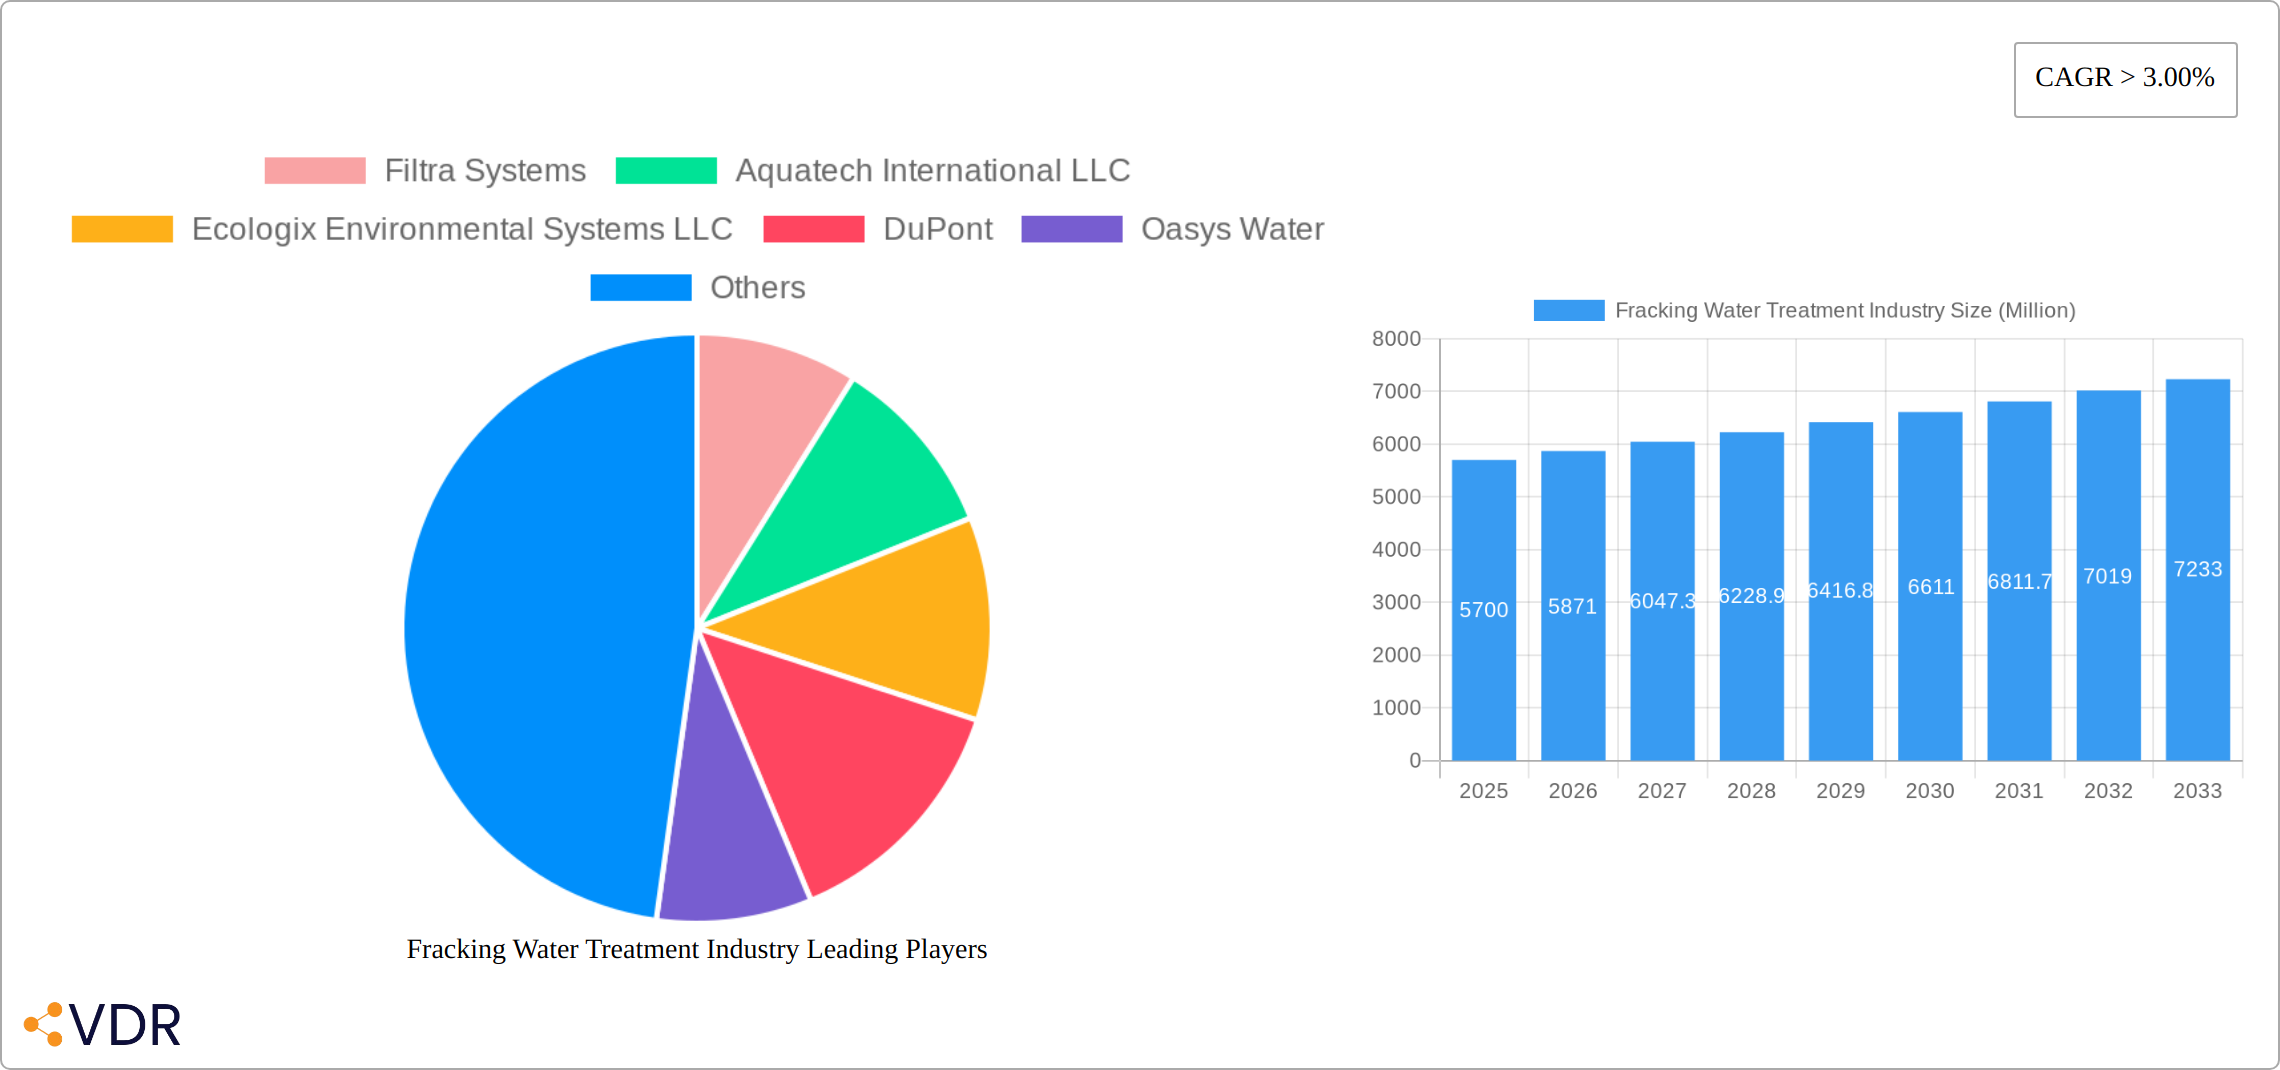
Key Insights
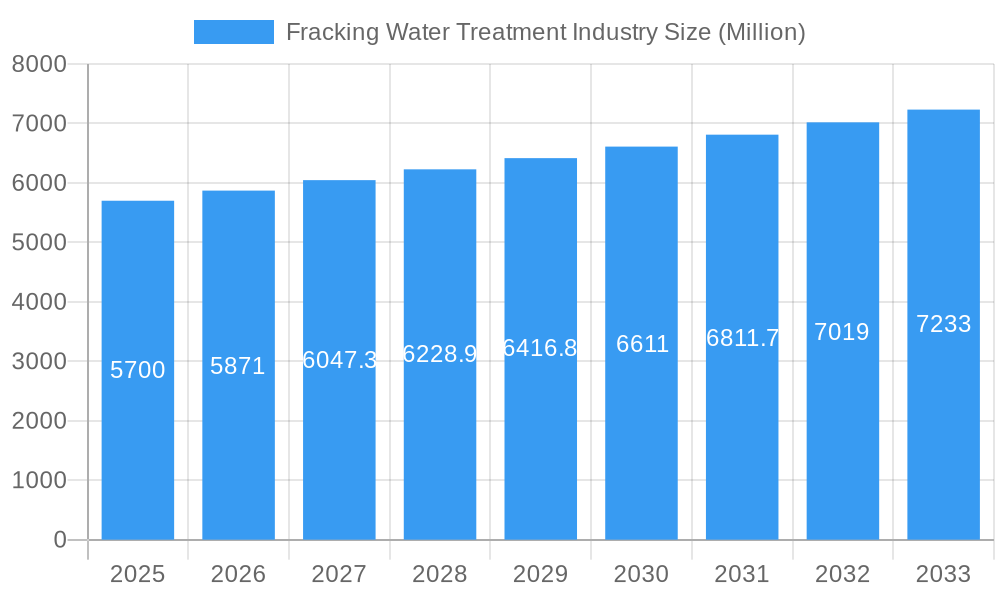
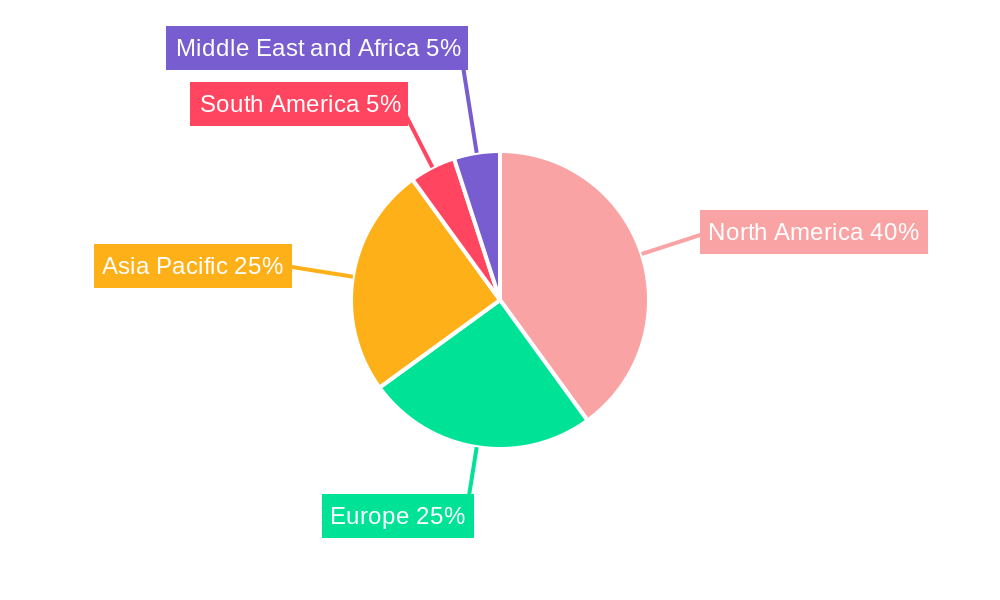
The fracking water treatment market, valued at $5.7 billion in 2025, is experiencing robust growth, projected to expand at a CAGR exceeding 3% from 2025 to 2033. This growth is driven by increasing fracking activities globally, stringent environmental regulations demanding effective wastewater treatment, and the rising adoption of advanced treatment technologies like membrane filtration and advanced oxidation processes. The industry is segmented into two primary application areas: treatment and recycle, which currently dominates due to the cost-effectiveness and environmental benefits of reusing treated water, and deep well injection, which remains a significant segment, particularly in regions with limited alternative disposal options. Key players like Filtra Systems, Aquatech International, and Halliburton are driving innovation and expanding their market share through technological advancements and strategic partnerships. Regional growth is uneven, with North America and Asia Pacific expected to lead, driven by high shale gas production in North America and rapidly developing energy infrastructure in Asia. However, challenges such as fluctuating oil and gas prices, and the ongoing debate surrounding the environmental impact of fracking, could potentially moderate market growth in the coming years.
Fracking Water Treatment Industry Market Size (In Billion)
The market's future trajectory hinges on several factors. Technological advancements, particularly in cost-effective and efficient treatment solutions capable of handling increasingly complex wastewater compositions, will be crucial. Regulatory landscape changes, both nationally and internationally, will significantly impact the demand for various treatment methods. Furthermore, industry efforts focused on sustainability and responsible waste management, including public perception and acceptance of fracking practices, will play a crucial role in shaping market growth in the long term. Companies will need to prioritize innovation, efficient operations, and strategic partnerships to maintain a competitive edge in this dynamic and evolving market. The growing focus on water scarcity and responsible resource management is further bolstering the importance of effective and sustainable water treatment solutions within the fracking industry.
Fracking Water Treatment Industry Company Market Share
Fracking Water Treatment Industry Market Report: 2019-2033
This comprehensive report provides a detailed analysis of the Fracking Water Treatment industry, encompassing market dynamics, growth trends, regional insights, and key player profiles. The study period covers 2019-2033, with a base year of 2025 and a forecast period of 2025-2033. The report is crucial for investors, industry professionals, and strategic decision-makers seeking to understand and capitalize on opportunities within this rapidly evolving market. The parent market is the broader water treatment industry, while the child market is specifically focused on the treatment of wastewater generated from hydraulic fracturing (fracking) operations.
Keywords: Fracking Water Treatment, Wastewater Treatment, Oil & Gas Wastewater, Membrane Technology, Water Recycling, Deep Well Injection, Hydraulic Fracturing, Filtra Systems, Aquatech International, Ecologix Environmental, DuPont, Oasys Water, Halliburton, Schlumberger, Agua Dulce Technologies, Veolia Water Technologies, Market Size, CAGR, Market Share, Growth Opportunities, Industry Trends.
Fracking Water Treatment Industry Market Dynamics & Structure
The fracking water treatment market is a dynamic and evolving landscape, characterized by a moderate level of industry concentration. This segment features a blend of established, large-scale providers and a growing number of agile, specialized firms focusing on niche technologies. A significant impetus for market growth stems from relentless technological innovation, with a particular emphasis on next-generation membrane filtration systems and highly effective advanced oxidation processes (AOPs). These technologies are crucial for meeting stringent effluent standards and enabling water reuse. Regulatory frameworks, which exhibit considerable regional variation, play a pivotal role in shaping market dynamics, influencing treatment methodologies, operational costs, and investment decisions. While competitive substitutes like evaporation ponds and land application exist, they are increasingly facing heightened environmental scrutiny and limitations, making advanced treatment solutions more attractive. The primary end-users remain oil and gas exploration and production companies, although service providers are demonstrating a growing strategic involvement in optimizing water management operations. Mergers and acquisitions (M&A) activity has been a consistent feature, primarily driven by larger entities seeking to acquire innovative technologies and expand their comprehensive service portfolios.
- Market Concentration: Moderately concentrated, with a few dominant players collectively holding approximately 60-70% market share, while numerous smaller, specialized firms cater to specific regional or technological needs.
- Technological Innovation: Intense focus on optimizing and deploying advanced membrane filtration (e.g., reverse osmosis, nanofiltration), advanced oxidation processes (e.g., ozone, UV, Fenton), and sophisticated biological treatment systems.
- Regulatory Framework: Highly variable across jurisdictions, leading to diverse treatment requirements, cost structures, and market access challenges. Strict regulations are a primary catalyst for advanced treatment adoption.
- Competitive Substitutes: Evaporation ponds and land application are facing increasing environmental opposition due to land use, potential groundwater contamination, and air quality concerns, driving demand for closed-loop systems.
- End-User Demographics: Predominantly oil and gas exploration and production (E&P) companies, with an increasing number of specialized oilfield service companies also playing a significant role in managing water treatment operations.
- M&A Trends: Moderate to active M&A activity, characterized by strategic acquisitions of technology developers and service providers aiming to enhance capabilities, expand geographical reach, and offer integrated solutions. Approximately 15-25 M&A deals were recorded between 2019 and 2024, focusing on technological advancements.
Fracking Water Treatment Industry Growth Trends & Insights
The fracking water treatment market experienced significant growth during the historical period (2019-2024), driven by increasing fracking activity and stricter environmental regulations. Market size reached approximately $xx million in 2024, exhibiting a CAGR of xx% during the historical period. Adoption rates of advanced treatment technologies are increasing, particularly membrane filtration. Technological disruptions, such as the development of more efficient and cost-effective treatment processes, continue to reshape the market landscape. Consumer behavior shifts toward sustainable and environmentally friendly solutions are driving demand for advanced recycling and reuse technologies. The forecast period (2025-2033) is expected to witness sustained growth, driven by several factors, including a projected increase in fracking activity, stringent regulatory compliance, and technological advancements. Market penetration of advanced technologies is expected to increase significantly, leading to further market expansion. We project the market to reach $xx million by 2033, with a CAGR of xx% during the forecast period.
Dominant Regions, Countries, or Segments in Fracking Water Treatment Industry
North America, particularly the United States, currently commands the largest market share within the global fracking water treatment industry. This dominance is directly attributable to its extensive hydraulic fracturing activities and a robust, albeit complex, regulatory environment that mandates stringent wastewater management. The "Treatment & Recycle" segment stands out as the largest application area, projected to account for approximately 55-65% of the market value in 2024. This leadership is propelled by the escalating costs associated with freshwater acquisition and the critical imperative to reduce the environmental footprint of the oil and gas sector through water reuse and minimization of freshwater withdrawal.
- Key Drivers in North America: Pervasive stringent environmental regulations, substantial and ongoing hydraulic fracturing operations, and well-established infrastructure supporting advanced water treatment and recycling capabilities.
- Treatment & Recycle Segment Dominance: Fueled by the increasing economic burden of freshwater procurement and the growing environmental imperative to minimize wastewater discharge and promote water conservation within oil and gas operations.
- Deep Well Injection Segment Growth: Expected to exhibit moderate but steady growth, supported by the availability of suitable geological formations for safe and compliant disposal, especially in regions where recycling is less economically viable.
- Market Share: North America currently holds an estimated 50-60% of the global fracking water treatment market, with the United States contributing the most significant portion of this share.
- Growth Potential: Emerging markets in Asia (particularly China) and South America are poised for substantial growth in the forecast period, driven by expanding unconventional oil and gas exploration and increasing adoption of advanced treatment technologies.
Fracking Water Treatment Industry Product Landscape
The fracking water treatment product landscape is characterized by a wide range of technologies, including membrane filtration (microfiltration, ultrafiltration, reverse osmosis), advanced oxidation processes (AOPs), and biological treatment. Innovations focus on enhancing efficiency, reducing costs, and improving water quality for reuse or disposal. Unique selling propositions include reduced chemical usage, lower energy consumption, and higher water recovery rates. Recent technological advancements include the development of more durable and fouling-resistant membranes, and the integration of automation and digitalization for optimized operation.
Key Drivers, Barriers & Challenges in Fracking Water Treatment Industry
Key Drivers:
- Escalating global hydraulic fracturing activity, leading to increased volumes of produced water requiring treatment.
- The continuous tightening of environmental regulations globally, strongly incentivizing water recycling, reuse, and responsible disposal practices.
- Rapid advancements in treatment technologies, including more efficient membrane filtration, enhanced oxidation processes (AOPs), and innovative separation techniques.
- Growing industry and societal awareness regarding water scarcity and its profound impact on the sustainability and long-term viability of the oil and gas sector.
Challenges & Restraints:
- Significant upfront capital investment requirements for advanced and highly effective treatment technologies, posing a barrier for some operators.
- The inherent variability in the composition of produced water from different well sites, often necessitating complex, customized, and adaptable treatment solutions.
- Ongoing regulatory uncertainty and the dynamic nature of evolving environmental standards, which can lead to compliance challenges and investment risks.
- Disruptions in global supply chains, impacting the availability and cost of critical components and raw materials. This has led to an approximate 15-25% increase in raw material costs between 2021 and 2023, affecting project economics.
Emerging Opportunities in Fracking Water Treatment Industry
Emerging opportunities lie in the development of cost-effective and sustainable water treatment solutions tailored to specific wastewater compositions. Untapped markets in emerging economies with growing fracking activities present significant potential. Innovative applications, such as the integration of renewable energy sources for powering treatment plants, offer further opportunities. The development of closed-loop water systems for fracking operations represents a key growth area.
Growth Accelerators in the Fracking Water Treatment Industry
Technological breakthroughs in membrane technology and AOPs, along with the increasing adoption of automation and digitalization, will significantly accelerate market growth. Strategic partnerships between technology providers, oil and gas companies, and water treatment specialists are fostering innovation and market expansion. Government incentives and funding for research and development of sustainable water treatment solutions will also play a crucial role.
Key Players Shaping the Fracking Water Treatment Industry Market
- Filtra Systems
- Aquatech International LLC
- Ecologix Environmental Systems LLC
- DuPont (now part of Dow)
- Oasys Water (acquired by Veolia)
- Halliburton
- Schlumberger Limited
- Agua Dulce Technologies LLC
- Veolia Water Technologies
- Natronix
Notable Milestones in Fracking Water Treatment Industry Sector
- 2020: Several leading companies within the sector announced substantial strategic investments in research and development initiatives focused on next-generation membrane technologies and advanced water purification techniques.
- 2021: Numerous governments launched significant funding programs and incentives aimed at promoting the development and adoption of sustainable and innovative water treatment solutions for the energy sector.
- 2022: A noticeable surge in the integration of automated control systems and advanced digital monitoring tools across a wide array of water treatment facilities, enhancing operational efficiency and data-driven decision-making.
- 2023: The formation of several key strategic partnerships and collaborations between major oil and gas companies and specialized water treatment technology providers, fostering innovation and integrated service offerings.
In-Depth Fracking Water Treatment Industry Market Outlook
The fracking water treatment market is poised for continued robust growth, driven by increasing fracking activity, stricter environmental regulations, and technological advancements. Strategic opportunities exist for companies focusing on sustainable, cost-effective, and technologically advanced solutions. The market's future potential hinges on adapting to evolving regulatory landscapes and addressing the challenges of variable wastewater compositions. Companies that can effectively integrate innovative technologies and forge strong partnerships will be best positioned to capitalize on the considerable growth opportunities in this sector.
Fracking Water Treatment Industry Segmentation
-
1. Application
- 1.1. Treatment & Recycle
- 1.2. Deep well Injection
Fracking Water Treatment Industry Segmentation By Geography
-
1. Asia Pacific
- 1.1. China
- 1.2. India
- 1.3. Japan
- 1.4. South Korea
- 1.5. Rest of Asia Pacific
-
2. North America
- 2.1. United States
- 2.2. Canada
- 2.3. Mexico
-
3. Europe
- 3.1. Germany
- 3.2. United Kingdom
- 3.3. France
- 3.4. Italy
- 3.5. Rest of Europe
-
4. South America
- 4.1. Brazil
- 4.2. Argentina
- 4.3. Rest of South America
-
5. Middle East and Africa
- 5.1. Saudi Arabia
- 5.2. South Africa
- 5.3. Rest of Middle East and Africa
Fracking Water Treatment Industry Regional Market Share
Geographic Coverage of Fracking Water Treatment Industry
Fracking Water Treatment Industry REPORT HIGHLIGHTS
| Aspects | Details |
|---|---|
| Study Period | 2020-2034 |
| Base Year | 2025 |
| Estimated Year | 2026 |
| Forecast Period | 2026-2034 |
| Historical Period | 2020-2025 |
| Growth Rate | CAGR of > 3.00% from 2020-2034 |
| Segmentation |
|
Table of Contents
- 1. Introduction
- 1.1. Research Scope
- 1.2. Market Segmentation
- 1.3. Research Objective
- 1.4. Definitions and Assumptions
- 2. Executive Summary
- 2.1. Market Snapshot
- 3. Market Dynamics
- 3.1. Market Drivers
- 3.2. Market Restrains
- 3.3. Market Trends
- 3.4. Market Opportunities
- 4. Market Factor Analysis
- 4.1. Porters Five Forces
- 4.1.1. Bargaining Power of Suppliers
- 4.1.2. Bargaining Power of Buyers
- 4.1.3. Threat of New Entrants
- 4.1.4. Threat of Substitutes
- 4.1.5. Competitive Rivalry
- 4.2. PESTEL analysis
- 4.3. BCG Analysis
- 4.3.1. Stars (High Growth, High Market Share)
- 4.3.2. Cash Cows (Low Growth, High Market Share)
- 4.3.3. Question Mark (High Growth, Low Market Share)
- 4.3.4. Dogs (Low Growth, Low Market Share)
- 4.4. Ansoff Matrix Analysis
- 4.5. Supply Chain Analysis
- 4.6. Regulatory Landscape
- 4.7. Current Market Potential and Opportunity Assessment (TAM–SAM–SOM Framework)
- 4.8. VDR Analyst Note
- 4.1. Porters Five Forces
- 5. Market Analysis, Insights and Forecast 2021-2033
- 5.1. Market Analysis, Insights and Forecast - by Application
- 5.1.1. Treatment & Recycle
- 5.1.2. Deep well Injection
- 5.2. Market Analysis, Insights and Forecast - by Region
- 5.2.1. Asia Pacific
- 5.2.2. North America
- 5.2.3. Europe
- 5.2.4. South America
- 5.2.5. Middle East and Africa
- 5.1. Market Analysis, Insights and Forecast - by Application
- 6. Global Fracking Water Treatment Industry Analysis, Insights and Forecast, 2021-2033
- 6.1. Market Analysis, Insights and Forecast - by Application
- 6.1.1. Treatment & Recycle
- 6.1.2. Deep well Injection
- 6.1. Market Analysis, Insights and Forecast - by Application
- 7. Asia Pacific Fracking Water Treatment Industry Analysis, Insights and Forecast, 2021-2033
- 7.1. Market Analysis, Insights and Forecast - by Application
- 7.1.1. Treatment & Recycle
- 7.1.2. Deep well Injection
- 7.1. Market Analysis, Insights and Forecast - by Application
- 8. North America Fracking Water Treatment Industry Analysis, Insights and Forecast, 2021-2033
- 8.1. Market Analysis, Insights and Forecast - by Application
- 8.1.1. Treatment & Recycle
- 8.1.2. Deep well Injection
- 8.1. Market Analysis, Insights and Forecast - by Application
- 9. Europe Fracking Water Treatment Industry Analysis, Insights and Forecast, 2021-2033
- 9.1. Market Analysis, Insights and Forecast - by Application
- 9.1.1. Treatment & Recycle
- 9.1.2. Deep well Injection
- 9.1. Market Analysis, Insights and Forecast - by Application
- 10. South America Fracking Water Treatment Industry Analysis, Insights and Forecast, 2021-2033
- 10.1. Market Analysis, Insights and Forecast - by Application
- 10.1.1. Treatment & Recycle
- 10.1.2. Deep well Injection
- 10.1. Market Analysis, Insights and Forecast - by Application
- 11. Middle East and Africa Fracking Water Treatment Industry Analysis, Insights and Forecast, 2021-2033
- 11.1. Market Analysis, Insights and Forecast - by Application
- 11.1.1. Treatment & Recycle
- 11.1.2. Deep well Injection
- 11.1. Market Analysis, Insights and Forecast - by Application
- 12. Competitive Analysis
- 12.1. Company Profiles
- 12.1.1 Filtra Systems
- 12.1.1.1. Company Overview
- 12.1.1.2. Products
- 12.1.1.3. Company Financials
- 12.1.1.4. SWOT Analysis
- 12.1.2 Aquatech International LLC
- 12.1.2.1. Company Overview
- 12.1.2.2. Products
- 12.1.2.3. Company Financials
- 12.1.2.4. SWOT Analysis
- 12.1.3 Ecologix Environmental Systems LLC
- 12.1.3.1. Company Overview
- 12.1.3.2. Products
- 12.1.3.3. Company Financials
- 12.1.3.4. SWOT Analysis
- 12.1.4 DuPont
- 12.1.4.1. Company Overview
- 12.1.4.2. Products
- 12.1.4.3. Company Financials
- 12.1.4.4. SWOT Analysis
- 12.1.5 Oasys Water
- 12.1.5.1. Company Overview
- 12.1.5.2. Products
- 12.1.5.3. Company Financials
- 12.1.5.4. SWOT Analysis
- 12.1.6 Halliburton
- 12.1.6.1. Company Overview
- 12.1.6.2. Products
- 12.1.6.3. Company Financials
- 12.1.6.4. SWOT Analysis
- 12.1.7 Schlumberger Limited
- 12.1.7.1. Company Overview
- 12.1.7.2. Products
- 12.1.7.3. Company Financials
- 12.1.7.4. SWOT Analysis
- 12.1.8 Agua Dulce Technologies LLC
- 12.1.8.1. Company Overview
- 12.1.8.2. Products
- 12.1.8.3. Company Financials
- 12.1.8.4. SWOT Analysis
- 12.1.9 Veolia Water Technologies*List Not Exhaustive
- 12.1.9.1. Company Overview
- 12.1.9.2. Products
- 12.1.9.3. Company Financials
- 12.1.9.4. SWOT Analysis
- 12.1.10 Filtra Systems
- 12.1.10.1. Company Overview
- 12.1.10.2. Products
- 12.1.10.3. Company Financials
- 12.1.10.4. SWOT Analysis
- 12.1.1 Filtra Systems
- 12.2. Market Entropy
- 12.2.1 Company's Key Areas Served
- 12.2.2 Recent Developments
- 12.3. Company Market Share Analysis 2025
- 12.3.1 Top 5 Companies Market Share Analysis
- 12.3.2 Top 3 Companies Market Share Analysis
- 12.4. List of Potential Customers
- 13. Research Methodology
List of Figures
- Figure 1: Global Fracking Water Treatment Industry Revenue Breakdown (Million, %) by Region 2025 & 2033
- Figure 2: Global Fracking Water Treatment Industry Volume Breakdown (liter , %) by Region 2025 & 2033
- Figure 3: Asia Pacific Fracking Water Treatment Industry Revenue (Million), by Application 2025 & 2033
- Figure 4: Asia Pacific Fracking Water Treatment Industry Volume (liter ), by Application 2025 & 2033
- Figure 5: Asia Pacific Fracking Water Treatment Industry Revenue Share (%), by Application 2025 & 2033
- Figure 6: Asia Pacific Fracking Water Treatment Industry Volume Share (%), by Application 2025 & 2033
- Figure 7: Asia Pacific Fracking Water Treatment Industry Revenue (Million), by Country 2025 & 2033
- Figure 8: Asia Pacific Fracking Water Treatment Industry Volume (liter ), by Country 2025 & 2033
- Figure 9: Asia Pacific Fracking Water Treatment Industry Revenue Share (%), by Country 2025 & 2033
- Figure 10: Asia Pacific Fracking Water Treatment Industry Volume Share (%), by Country 2025 & 2033
- Figure 11: North America Fracking Water Treatment Industry Revenue (Million), by Application 2025 & 2033
- Figure 12: North America Fracking Water Treatment Industry Volume (liter ), by Application 2025 & 2033
- Figure 13: North America Fracking Water Treatment Industry Revenue Share (%), by Application 2025 & 2033
- Figure 14: North America Fracking Water Treatment Industry Volume Share (%), by Application 2025 & 2033
- Figure 15: North America Fracking Water Treatment Industry Revenue (Million), by Country 2025 & 2033
- Figure 16: North America Fracking Water Treatment Industry Volume (liter ), by Country 2025 & 2033
- Figure 17: North America Fracking Water Treatment Industry Revenue Share (%), by Country 2025 & 2033
- Figure 18: North America Fracking Water Treatment Industry Volume Share (%), by Country 2025 & 2033
- Figure 19: Europe Fracking Water Treatment Industry Revenue (Million), by Application 2025 & 2033
- Figure 20: Europe Fracking Water Treatment Industry Volume (liter ), by Application 2025 & 2033
- Figure 21: Europe Fracking Water Treatment Industry Revenue Share (%), by Application 2025 & 2033
- Figure 22: Europe Fracking Water Treatment Industry Volume Share (%), by Application 2025 & 2033
- Figure 23: Europe Fracking Water Treatment Industry Revenue (Million), by Country 2025 & 2033
- Figure 24: Europe Fracking Water Treatment Industry Volume (liter ), by Country 2025 & 2033
- Figure 25: Europe Fracking Water Treatment Industry Revenue Share (%), by Country 2025 & 2033
- Figure 26: Europe Fracking Water Treatment Industry Volume Share (%), by Country 2025 & 2033
- Figure 27: South America Fracking Water Treatment Industry Revenue (Million), by Application 2025 & 2033
- Figure 28: South America Fracking Water Treatment Industry Volume (liter ), by Application 2025 & 2033
- Figure 29: South America Fracking Water Treatment Industry Revenue Share (%), by Application 2025 & 2033
- Figure 30: South America Fracking Water Treatment Industry Volume Share (%), by Application 2025 & 2033
- Figure 31: South America Fracking Water Treatment Industry Revenue (Million), by Country 2025 & 2033
- Figure 32: South America Fracking Water Treatment Industry Volume (liter ), by Country 2025 & 2033
- Figure 33: South America Fracking Water Treatment Industry Revenue Share (%), by Country 2025 & 2033
- Figure 34: South America Fracking Water Treatment Industry Volume Share (%), by Country 2025 & 2033
- Figure 35: Middle East and Africa Fracking Water Treatment Industry Revenue (Million), by Application 2025 & 2033
- Figure 36: Middle East and Africa Fracking Water Treatment Industry Volume (liter ), by Application 2025 & 2033
- Figure 37: Middle East and Africa Fracking Water Treatment Industry Revenue Share (%), by Application 2025 & 2033
- Figure 38: Middle East and Africa Fracking Water Treatment Industry Volume Share (%), by Application 2025 & 2033
- Figure 39: Middle East and Africa Fracking Water Treatment Industry Revenue (Million), by Country 2025 & 2033
- Figure 40: Middle East and Africa Fracking Water Treatment Industry Volume (liter ), by Country 2025 & 2033
- Figure 41: Middle East and Africa Fracking Water Treatment Industry Revenue Share (%), by Country 2025 & 2033
- Figure 42: Middle East and Africa Fracking Water Treatment Industry Volume Share (%), by Country 2025 & 2033
List of Tables
- Table 1: Global Fracking Water Treatment Industry Revenue Million Forecast, by Application 2020 & 2033
- Table 2: Global Fracking Water Treatment Industry Volume liter Forecast, by Application 2020 & 2033
- Table 3: Global Fracking Water Treatment Industry Revenue Million Forecast, by Region 2020 & 2033
- Table 4: Global Fracking Water Treatment Industry Volume liter Forecast, by Region 2020 & 2033
- Table 5: Global Fracking Water Treatment Industry Revenue Million Forecast, by Application 2020 & 2033
- Table 6: Global Fracking Water Treatment Industry Volume liter Forecast, by Application 2020 & 2033
- Table 7: Global Fracking Water Treatment Industry Revenue Million Forecast, by Country 2020 & 2033
- Table 8: Global Fracking Water Treatment Industry Volume liter Forecast, by Country 2020 & 2033
- Table 9: China Fracking Water Treatment Industry Revenue (Million) Forecast, by Application 2020 & 2033
- Table 10: China Fracking Water Treatment Industry Volume (liter ) Forecast, by Application 2020 & 2033
- Table 11: India Fracking Water Treatment Industry Revenue (Million) Forecast, by Application 2020 & 2033
- Table 12: India Fracking Water Treatment Industry Volume (liter ) Forecast, by Application 2020 & 2033
- Table 13: Japan Fracking Water Treatment Industry Revenue (Million) Forecast, by Application 2020 & 2033
- Table 14: Japan Fracking Water Treatment Industry Volume (liter ) Forecast, by Application 2020 & 2033
- Table 15: South Korea Fracking Water Treatment Industry Revenue (Million) Forecast, by Application 2020 & 2033
- Table 16: South Korea Fracking Water Treatment Industry Volume (liter ) Forecast, by Application 2020 & 2033
- Table 17: Rest of Asia Pacific Fracking Water Treatment Industry Revenue (Million) Forecast, by Application 2020 & 2033
- Table 18: Rest of Asia Pacific Fracking Water Treatment Industry Volume (liter ) Forecast, by Application 2020 & 2033
- Table 19: Global Fracking Water Treatment Industry Revenue Million Forecast, by Application 2020 & 2033
- Table 20: Global Fracking Water Treatment Industry Volume liter Forecast, by Application 2020 & 2033
- Table 21: Global Fracking Water Treatment Industry Revenue Million Forecast, by Country 2020 & 2033
- Table 22: Global Fracking Water Treatment Industry Volume liter Forecast, by Country 2020 & 2033
- Table 23: United States Fracking Water Treatment Industry Revenue (Million) Forecast, by Application 2020 & 2033
- Table 24: United States Fracking Water Treatment Industry Volume (liter ) Forecast, by Application 2020 & 2033
- Table 25: Canada Fracking Water Treatment Industry Revenue (Million) Forecast, by Application 2020 & 2033
- Table 26: Canada Fracking Water Treatment Industry Volume (liter ) Forecast, by Application 2020 & 2033
- Table 27: Mexico Fracking Water Treatment Industry Revenue (Million) Forecast, by Application 2020 & 2033
- Table 28: Mexico Fracking Water Treatment Industry Volume (liter ) Forecast, by Application 2020 & 2033
- Table 29: Global Fracking Water Treatment Industry Revenue Million Forecast, by Application 2020 & 2033
- Table 30: Global Fracking Water Treatment Industry Volume liter Forecast, by Application 2020 & 2033
- Table 31: Global Fracking Water Treatment Industry Revenue Million Forecast, by Country 2020 & 2033
- Table 32: Global Fracking Water Treatment Industry Volume liter Forecast, by Country 2020 & 2033
- Table 33: Germany Fracking Water Treatment Industry Revenue (Million) Forecast, by Application 2020 & 2033
- Table 34: Germany Fracking Water Treatment Industry Volume (liter ) Forecast, by Application 2020 & 2033
- Table 35: United Kingdom Fracking Water Treatment Industry Revenue (Million) Forecast, by Application 2020 & 2033
- Table 36: United Kingdom Fracking Water Treatment Industry Volume (liter ) Forecast, by Application 2020 & 2033
- Table 37: France Fracking Water Treatment Industry Revenue (Million) Forecast, by Application 2020 & 2033
- Table 38: France Fracking Water Treatment Industry Volume (liter ) Forecast, by Application 2020 & 2033
- Table 39: Italy Fracking Water Treatment Industry Revenue (Million) Forecast, by Application 2020 & 2033
- Table 40: Italy Fracking Water Treatment Industry Volume (liter ) Forecast, by Application 2020 & 2033
- Table 41: Rest of Europe Fracking Water Treatment Industry Revenue (Million) Forecast, by Application 2020 & 2033
- Table 42: Rest of Europe Fracking Water Treatment Industry Volume (liter ) Forecast, by Application 2020 & 2033
- Table 43: Global Fracking Water Treatment Industry Revenue Million Forecast, by Application 2020 & 2033
- Table 44: Global Fracking Water Treatment Industry Volume liter Forecast, by Application 2020 & 2033
- Table 45: Global Fracking Water Treatment Industry Revenue Million Forecast, by Country 2020 & 2033
- Table 46: Global Fracking Water Treatment Industry Volume liter Forecast, by Country 2020 & 2033
- Table 47: Brazil Fracking Water Treatment Industry Revenue (Million) Forecast, by Application 2020 & 2033
- Table 48: Brazil Fracking Water Treatment Industry Volume (liter ) Forecast, by Application 2020 & 2033
- Table 49: Argentina Fracking Water Treatment Industry Revenue (Million) Forecast, by Application 2020 & 2033
- Table 50: Argentina Fracking Water Treatment Industry Volume (liter ) Forecast, by Application 2020 & 2033
- Table 51: Rest of South America Fracking Water Treatment Industry Revenue (Million) Forecast, by Application 2020 & 2033
- Table 52: Rest of South America Fracking Water Treatment Industry Volume (liter ) Forecast, by Application 2020 & 2033
- Table 53: Global Fracking Water Treatment Industry Revenue Million Forecast, by Application 2020 & 2033
- Table 54: Global Fracking Water Treatment Industry Volume liter Forecast, by Application 2020 & 2033
- Table 55: Global Fracking Water Treatment Industry Revenue Million Forecast, by Country 2020 & 2033
- Table 56: Global Fracking Water Treatment Industry Volume liter Forecast, by Country 2020 & 2033
- Table 57: Saudi Arabia Fracking Water Treatment Industry Revenue (Million) Forecast, by Application 2020 & 2033
- Table 58: Saudi Arabia Fracking Water Treatment Industry Volume (liter ) Forecast, by Application 2020 & 2033
- Table 59: South Africa Fracking Water Treatment Industry Revenue (Million) Forecast, by Application 2020 & 2033
- Table 60: South Africa Fracking Water Treatment Industry Volume (liter ) Forecast, by Application 2020 & 2033
- Table 61: Rest of Middle East and Africa Fracking Water Treatment Industry Revenue (Million) Forecast, by Application 2020 & 2033
- Table 62: Rest of Middle East and Africa Fracking Water Treatment Industry Volume (liter ) Forecast, by Application 2020 & 2033
Frequently Asked Questions
1. What is the projected Compound Annual Growth Rate (CAGR) of the Fracking Water Treatment Industry?
The projected CAGR is approximately > 3.00%.
2. Which companies are prominent players in the Fracking Water Treatment Industry?
Key companies in the market include Filtra Systems, Aquatech International LLC, Ecologix Environmental Systems LLC, DuPont, Oasys Water, Halliburton, Schlumberger Limited, Agua Dulce Technologies LLC, Veolia Water Technologies*List Not Exhaustive, Filtra Systems.
3. What are the main segments of the Fracking Water Treatment Industry?
The market segments include Application.
4. Can you provide details about the market size?
The market size is estimated to be USD 5700 Million as of 2022.
5. What are some drivers contributing to market growth?
; High Demand from Treatment & Recycle Segment; Stringent Government Regulations.
6. What are the notable trends driving market growth?
High Demand from Treatment & Recycle Segment.
7. Are there any restraints impacting market growth?
; Outbreak of COVID-19; Other Restraints.
8. Can you provide examples of recent developments in the market?
Partnerships between industry players to develop innovative technologies
9. What pricing options are available for accessing the report?
Pricing options include single-user, multi-user, and enterprise licenses priced at USD 4750, USD 5250, and USD 8750 respectively.
10. Is the market size provided in terms of value or volume?
The market size is provided in terms of value, measured in Million and volume, measured in liter .
11. Are there any specific market keywords associated with the report?
Yes, the market keyword associated with the report is "Fracking Water Treatment Industry," which aids in identifying and referencing the specific market segment covered.
12. How do I determine which pricing option suits my needs best?
The pricing options vary based on user requirements and access needs. Individual users may opt for single-user licenses, while businesses requiring broader access may choose multi-user or enterprise licenses for cost-effective access to the report.
13. Are there any additional resources or data provided in the Fracking Water Treatment Industry report?
While the report offers comprehensive insights, it's advisable to review the specific contents or supplementary materials provided to ascertain if additional resources or data are available.
14. How can I stay updated on further developments or reports in the Fracking Water Treatment Industry?
To stay informed about further developments, trends, and reports in the Fracking Water Treatment Industry, consider subscribing to industry newsletters, following relevant companies and organizations, or regularly checking reputable industry news sources and publications.
Methodology
Step 1 - Identification of Relevant Samples Size from Population Database


Step 2 - Approaches for Defining Global Market Size (Value, Volume* & Price*)

Note*: In applicable scenarios
Step 3 - Data Sources
Primary Research
- Web Analytics
- Survey Reports
- Research Institute
- Latest Research Reports
- Opinion Leaders
Secondary Research
- Annual Reports
- White Paper
- Latest Press Release
- Industry Association
- Paid Database
- Investor Presentations

Step 4 - Data Triangulation
Involves using different sources of information in order to increase the validity of a study
These sources are likely to be stakeholders in a program - participants, other researchers, program staff, other community members, and so on.
Then we put all data in single framework & apply various statistical tools to find out the dynamic on the market.
During the analysis stage, feedback from the stakeholder groups would be compared to determine areas of agreement as well as areas of divergence