
Key Insights
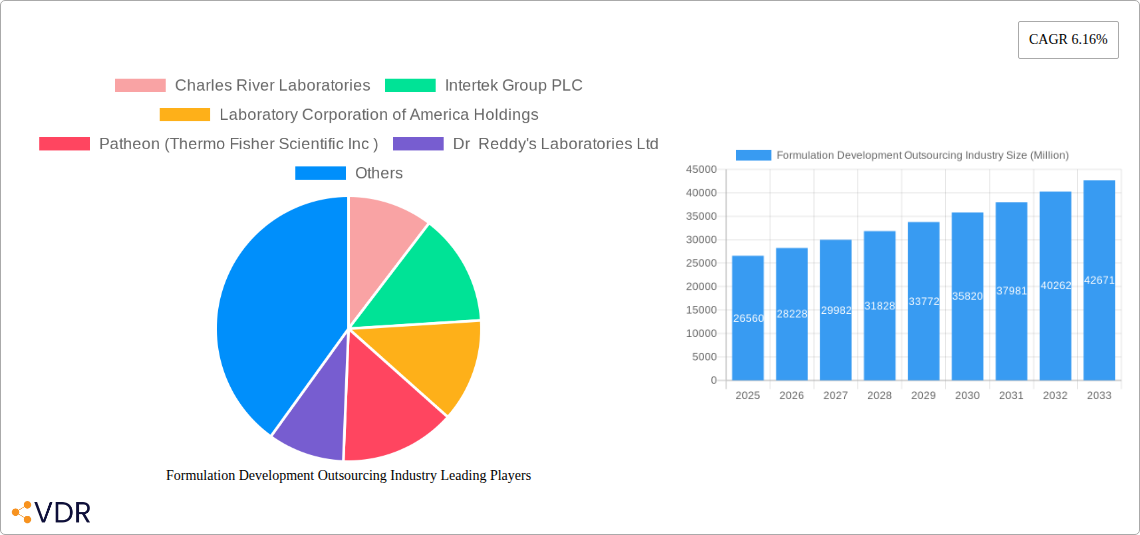
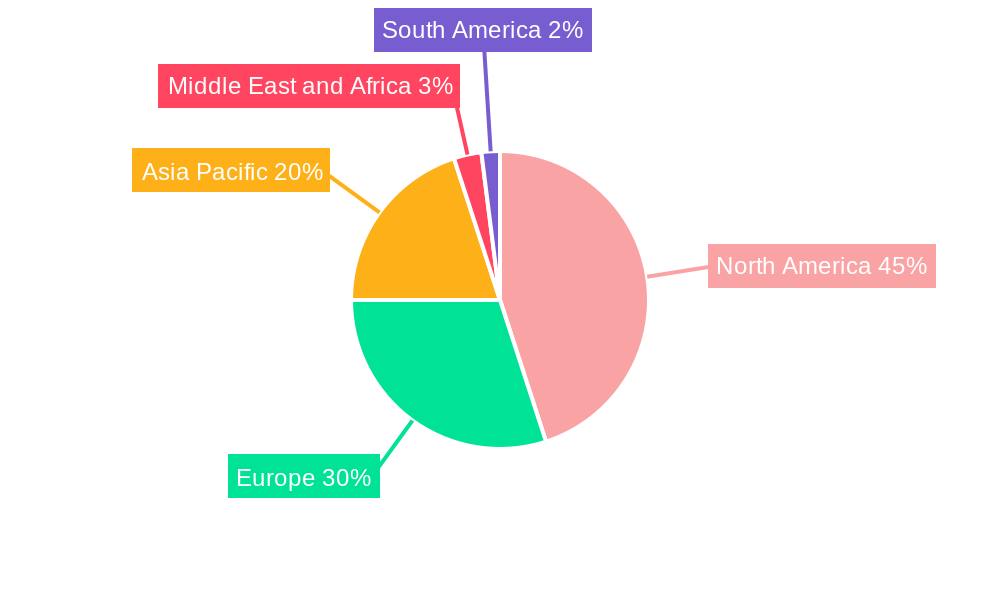
The Formulation Development Outsourcing (FDO) market is experiencing robust growth, projected to reach a valuation of $26.56 billion in 2025, expanding at a compound annual growth rate (CAGR) of 6.16% from 2025 to 2033. This expansion is fueled by several key drivers. The increasing complexity of drug development, particularly in areas like biologics and advanced therapies, necessitates specialized expertise and infrastructure that many pharmaceutical companies lack internally. Outsourcing allows these companies to focus on core competencies while leveraging the specialized skills and advanced technologies of FDO providers. Further driving market growth is the rising prevalence of chronic diseases globally, increasing the demand for new and improved drug formulations. The trend towards personalized medicine and targeted therapies also contributes, requiring customized formulation development services. The market is segmented by application (oncology, genetic disorders, neurology, infectious diseases, respiratory, cardiovascular, and others), end-user (pharmaceutical and biopharmaceutical companies, government and academic institutes), service (pre-formulation, analytical, formulation optimization), and dosage form (injectable, oral, topical, and others). North America currently holds a significant market share, driven by the presence of major pharmaceutical companies and robust regulatory frameworks. However, Asia Pacific is projected to witness the fastest growth due to increasing pharmaceutical manufacturing activities and a rising demand for affordable healthcare.
The competitive landscape is characterized by a mix of large multinational corporations and smaller specialized firms. Large players like Charles River Laboratories, Thermo Fisher Scientific (through Patheon), and Catalent benefit from economies of scale and diverse service offerings. Smaller companies focus on niche areas, such as specific therapeutic applications or advanced analytical services, offering specialized expertise and flexibility. While regulatory hurdles and pricing pressures pose some restraints, the overall market outlook for FDO remains positive, driven by continued innovation in drug development and a growing reliance on outsourcing to enhance efficiency and reduce development times. The long-term forecast indicates continued market expansion, propelled by emerging technologies, such as AI-driven formulation design and continuous manufacturing, further streamlining drug development processes.
Formulation Development Outsourcing Market Report: 2019-2033
This comprehensive report provides a detailed analysis of the Formulation Development Outsourcing market, encompassing market dynamics, growth trends, regional insights, product landscape, and key player analysis for the period 2019-2033. The report leverages extensive primary and secondary research to deliver actionable insights for industry professionals, investors, and stakeholders. This report focuses on the parent market of Pharmaceutical and Biopharmaceutical Outsourcing and the child market of Formulation Development Outsourcing, offering granular data segmentation across applications, end-users, and services.
Keywords: Formulation Development Outsourcing, Pharmaceutical Outsourcing, Biopharmaceutical Outsourcing, Pre-formulation Services, Analytical Services, Formulation Optimization, Injectable Dosage Forms, Oral Dosage Forms, Topical Dosage Forms, Oncology, Genetic Disorders, Neurology, Infectious Diseases, Respiratory Diseases, Cardiovascular Diseases, Contract Research Organizations (CROs), CDMO, Market Size, Market Share, CAGR, Market Growth, Industry Trends, Competitive Landscape, Regulatory Landscape.
Formulation Development Outsourcing Industry Market Dynamics & Structure
The Formulation Development Outsourcing market is experiencing robust growth driven by the increasing demand for specialized services from pharmaceutical and biopharmaceutical companies. Market concentration is moderate, with several large players and numerous smaller specialized firms. Technological innovation, particularly in areas like advanced drug delivery systems and personalized medicine, is a significant driver. Stringent regulatory frameworks, especially concerning drug safety and efficacy, influence market dynamics. Competition from internal formulation development capabilities exists but is often outweighed by the cost and expertise advantages offered by outsourcing. The market is characterized by frequent mergers and acquisitions (M&A) activity, indicating industry consolidation and expansion.
- Market Concentration: Moderate, with a few major players holding significant market share (estimated at xx% for the top 5 players in 2025).
- Technological Innovation: Focus on advanced drug delivery systems (e.g., liposomes, nanoparticles), personalized medicine, and biosimilars.
- Regulatory Frameworks: Stringent regulations (e.g., GMP, ICH guidelines) impact service offerings and compliance costs.
- Competitive Substitutes: Internal R&D capabilities within pharmaceutical companies represent a partial substitute.
- End-User Demographics: Primarily pharmaceutical and biopharmaceutical companies, with growing participation from government and academic institutions.
- M&A Trends: High levels of M&A activity (xx deals in 2024), indicating industry consolidation and expansion into new therapeutic areas. The total value of these deals reached approximately $xx million in 2024.
Formulation Development Outsourcing Industry Growth Trends & Insights
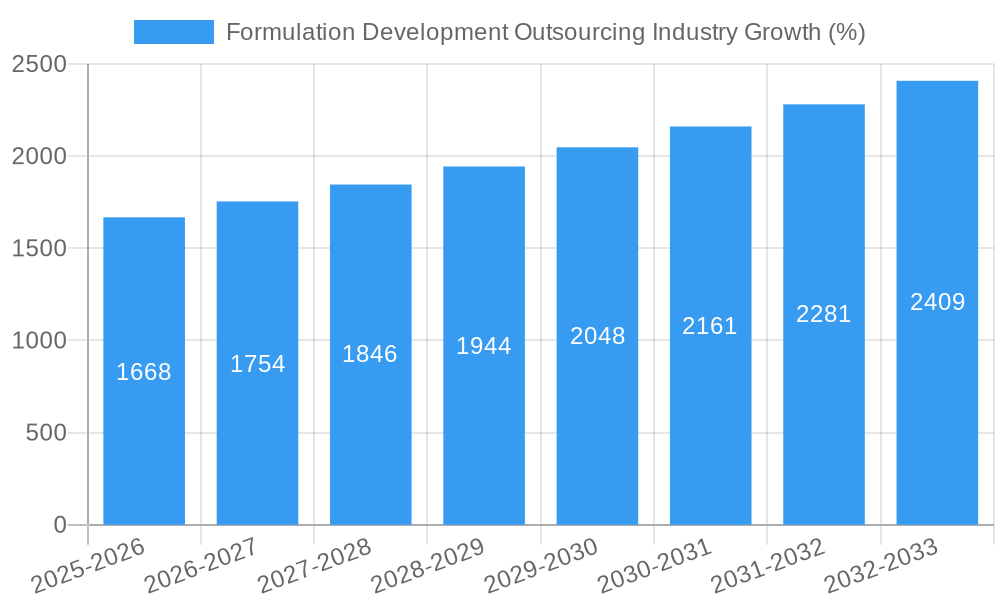
The Formulation Development Outsourcing market is projected to experience significant growth during the forecast period (2025-2033). The market size, currently estimated at $xx million in 2025, is projected to reach $xx million by 2033, exhibiting a CAGR of xx%. This growth is fueled by several factors, including the increasing complexity of drug development, the rising demand for specialized formulations, and the growing preference for outsourcing non-core activities. The adoption rate of outsourcing services is consistently increasing within the pharmaceutical and biotech sectors, driven by cost efficiency and expertise access. Technological advancements are also creating new opportunities within this space. Shifts in consumer behavior, such as a greater focus on personalized medicine, are driving the demand for tailored formulation solutions. The increased prevalence of chronic diseases and the growing geriatric population further augment this demand, creating a sustained growth trajectory.
Dominant Regions, Countries, or Segments in Formulation Development Outsourcing Industry
North America currently holds the largest market share in the Formulation Development Outsourcing industry, driven by high R&D spending, a strong pharmaceutical and biotech presence, and robust regulatory frameworks. However, the Asia-Pacific region is expected to showcase the fastest growth in the forecast period due to increasing investments in healthcare infrastructure, expanding pharmaceutical manufacturing capacities, and growing demand from emerging economies. Within the segments, Oncology stands as the leading application area due to the complexity of drug delivery systems and the need for specialized formulations. Pharmaceutical and Biopharmaceutical Companies are the primary end-users, with a significant share of the market. Pre-formulation services and Formulation Optimization are the most sought-after services, reflecting the critical role of these services in drug development. Injectable dosage forms dominate the market, due to the growing need for parenteral administration.
- Key Drivers (North America): High R&D spending, robust regulatory frameworks, large pharmaceutical/biotech presence.
- Key Drivers (Asia-Pacific): Growing healthcare investment, expanding pharmaceutical manufacturing, rising demand from emerging economies.
- Dominant Application: Oncology (highest market share, driven by complexity and high R&D investment).
- Dominant End-User: Pharmaceutical and Biopharmaceutical Companies (largest volume of outsourcing).
- Dominant Service: Pre-formulation Services (critical for early-stage development).
- Dominant Dosage Form: Injectable (high demand due to parenteral drug administration).
Formulation Development Outsourcing Industry Product Landscape
The product landscape within the Formulation Development Outsourcing industry is dynamic, with continuous innovation in drug delivery systems and analytical techniques. Companies offer a wide array of services including pre-formulation studies, formulation development, analytical testing, stability studies, and regulatory support. Key differentiators include specialized expertise in specific therapeutic areas, advanced analytical capabilities, and efficient project management. Technological advancements such as artificial intelligence (AI) and high-throughput screening are improving efficiency and accelerating the development process. The focus is consistently shifting toward personalized medicine, requiring specialized formulations and enhanced analytical tools to accommodate individual patient needs.
Key Drivers, Barriers & Challenges in Formulation Development Outsourcing Industry
Key Drivers:
- The increasing complexity of drug development drives the need for specialized expertise and capacity.
- Growing demand for novel drug delivery systems fuels the need for outsourcing.
- Cost optimization and efficiency gains encourage the outsourcing of non-core functions.
Challenges and Restraints:
- Stringent regulatory requirements lead to increased compliance costs and complexity.
- Supply chain disruptions can impact project timelines and costs (estimated impact on 2024 revenue: $xx million).
- Intense competition among outsourcing providers creates pressure on pricing and margins.
Emerging Opportunities in Formulation Development Outsourcing Industry
- The increasing prevalence of personalized medicine offers significant opportunities for tailored formulation development.
- Advanced drug delivery systems, such as nanoparticles and liposomes, present substantial growth potentials.
- Expansion into emerging markets with growing healthcare investment offers untapped growth opportunities.
Growth Accelerators in the Formulation Development Outsourcing Industry
Technological breakthroughs in areas such as AI and high-throughput screening are accelerating development timelines and improving efficiency. Strategic partnerships between formulation development providers and pharmaceutical companies facilitate the seamless integration of services and expertise. Market expansion into underserved regions with growing healthcare investment drives further growth.
Key Players Shaping the Formulation Development Outsourcing Industry Market
- Charles River Laboratories
- Intertek Group PLC
- Laboratory Corporation of America Holdings
- Patheon (Thermo Fisher Scientific Inc)
- Dr Reddy's Laboratories Ltd
- Irisys LLC
- Aizant Drug Research Solutions Private Limited
- Syngene International Ltd
- Lonza Group AG
- Piramal Pharma Solutions
- Qiotient Sciences
- Catalent Inc
- Emergent BioSolutions Inc
Notable Milestones in Formulation Development Outsourcing Industry Sector
- 2022: Launch of a novel drug delivery system by Lonza Group AG.
- 2023 Q2: Acquisition of a smaller CRO by Catalent Inc, expanding its service portfolio.
- 2024 Q1: Regulatory approval for a new analytical technique in formulation optimization by Charles River Laboratories.
In-Depth Formulation Development Outsourcing Industry Market Outlook
The Formulation Development Outsourcing market is poised for sustained growth, driven by technological advancements, strategic partnerships, and expanding market penetration. Future opportunities lie in personalized medicine, advanced drug delivery systems, and emerging markets. The continuous evolution of regulatory landscapes necessitates adaptation and innovation, requiring providers to stay ahead of the curve. Strategic alliances and investments in R&D will be crucial for maintaining competitiveness and market leadership in this dynamic sector.
Formulation Development Outsourcing Industry Segmentation
-
1. Service
-
1.1. Pre-formulation Services
- 1.1.1. Discovery and Preclinical Services
- 1.1.2. Analytical Services
-
1.2. Formulation Optimization
- 1.2.1. Phase I
- 1.2.2. Phase II
- 1.2.3. Phase III
- 1.2.4. Phase IV
-
1.1. Pre-formulation Services
-
2. Dosage Form
- 2.1. Injectable
- 2.2. Oral
- 2.3. Topical
- 2.4. Other Dosage Forms
-
3. Application
- 3.1. Oncology
- 3.2. Genetic Disorders
- 3.3. Neurology
- 3.4. Infectious Diseases
- 3.5. Respiratory
- 3.6. Cardiovascular
- 3.7. Other Applications
-
4. End User
- 4.1. Pharmaceutical and Biopharmaceutical Companies
- 4.2. Government and Academic Institutes
Formulation Development Outsourcing Industry Segmentation By Geography
-
1. North America
- 1.1. United States
- 1.2. Canada
- 1.3. Mexico
-
2. Europe
- 2.1. Germany
- 2.2. United Kingdom
- 2.3. France
- 2.4. Italy
- 2.5. Spain
- 2.6. Rest of Europe
-
3. Asia Pacific
- 3.1. China
- 3.2. Japan
- 3.3. India
- 3.4. Australia
- 3.5. South Korea
- 3.6. Rest of Asia Pacific
-
4. Middle East and Africa
- 4.1. GCC
- 4.2. South Africa
- 4.3. Rest of Middle East and Africa
-
5. South America
- 5.1. Brazil
- 5.2. Argentina
- 5.3. Rest of South America
Formulation Development Outsourcing Industry REPORT HIGHLIGHTS
| Aspects | Details |
|---|---|
| Study Period | 2019-2033 |
| Base Year | 2024 |
| Estimated Year | 2025 |
| Forecast Period | 2025-2033 |
| Historical Period | 2019-2024 |
| Growth Rate | CAGR of 6.16% from 2019-2033 |
| Segmentation |
|
Table of Contents
- 1. Introduction
- 1.1. Research Scope
- 1.2. Market Segmentation
- 1.3. Research Methodology
- 1.4. Definitions and Assumptions
- 2. Executive Summary
- 2.1. Introduction
- 3. Market Dynamics
- 3.1. Introduction
- 3.2. Market Drivers
- 3.2.1. Increasing Trend of Patent Protection Expiration of Major Drugs; Rising Number of Pharmaceutical and Biopharmaceutical Companies Outsourcing Their Services
- 3.3. Market Restrains
- 3.3.1. Structural Changes in the Pharmaceutical Industry; Insufficient Funding to Perform the Drug Development Process Through Formulation Development
- 3.4. Market Trends
- 3.4.1. The Oncology Segment is Expected to Witness Significant Growth over the Forecast Period
- 4. Market Factor Analysis
- 4.1. Porters Five Forces
- 4.2. Supply/Value Chain
- 4.3. PESTEL analysis
- 4.4. Market Entropy
- 4.5. Patent/Trademark Analysis
- 5. Global Formulation Development Outsourcing Industry Analysis, Insights and Forecast, 2019-2031
- 5.1. Market Analysis, Insights and Forecast - by Service
- 5.1.1. Pre-formulation Services
- 5.1.1.1. Discovery and Preclinical Services
- 5.1.1.2. Analytical Services
- 5.1.2. Formulation Optimization
- 5.1.2.1. Phase I
- 5.1.2.2. Phase II
- 5.1.2.3. Phase III
- 5.1.2.4. Phase IV
- 5.1.1. Pre-formulation Services
- 5.2. Market Analysis, Insights and Forecast - by Dosage Form
- 5.2.1. Injectable
- 5.2.2. Oral
- 5.2.3. Topical
- 5.2.4. Other Dosage Forms
- 5.3. Market Analysis, Insights and Forecast - by Application
- 5.3.1. Oncology
- 5.3.2. Genetic Disorders
- 5.3.3. Neurology
- 5.3.4. Infectious Diseases
- 5.3.5. Respiratory
- 5.3.6. Cardiovascular
- 5.3.7. Other Applications
- 5.4. Market Analysis, Insights and Forecast - by End User
- 5.4.1. Pharmaceutical and Biopharmaceutical Companies
- 5.4.2. Government and Academic Institutes
- 5.5. Market Analysis, Insights and Forecast - by Region
- 5.5.1. North America
- 5.5.2. Europe
- 5.5.3. Asia Pacific
- 5.5.4. Middle East and Africa
- 5.5.5. South America
- 5.1. Market Analysis, Insights and Forecast - by Service
- 6. North America Formulation Development Outsourcing Industry Analysis, Insights and Forecast, 2019-2031
- 6.1. Market Analysis, Insights and Forecast - by Service
- 6.1.1. Pre-formulation Services
- 6.1.1.1. Discovery and Preclinical Services
- 6.1.1.2. Analytical Services
- 6.1.2. Formulation Optimization
- 6.1.2.1. Phase I
- 6.1.2.2. Phase II
- 6.1.2.3. Phase III
- 6.1.2.4. Phase IV
- 6.1.1. Pre-formulation Services
- 6.2. Market Analysis, Insights and Forecast - by Dosage Form
- 6.2.1. Injectable
- 6.2.2. Oral
- 6.2.3. Topical
- 6.2.4. Other Dosage Forms
- 6.3. Market Analysis, Insights and Forecast - by Application
- 6.3.1. Oncology
- 6.3.2. Genetic Disorders
- 6.3.3. Neurology
- 6.3.4. Infectious Diseases
- 6.3.5. Respiratory
- 6.3.6. Cardiovascular
- 6.3.7. Other Applications
- 6.4. Market Analysis, Insights and Forecast - by End User
- 6.4.1. Pharmaceutical and Biopharmaceutical Companies
- 6.4.2. Government and Academic Institutes
- 6.1. Market Analysis, Insights and Forecast - by Service
- 7. Europe Formulation Development Outsourcing Industry Analysis, Insights and Forecast, 2019-2031
- 7.1. Market Analysis, Insights and Forecast - by Service
- 7.1.1. Pre-formulation Services
- 7.1.1.1. Discovery and Preclinical Services
- 7.1.1.2. Analytical Services
- 7.1.2. Formulation Optimization
- 7.1.2.1. Phase I
- 7.1.2.2. Phase II
- 7.1.2.3. Phase III
- 7.1.2.4. Phase IV
- 7.1.1. Pre-formulation Services
- 7.2. Market Analysis, Insights and Forecast - by Dosage Form
- 7.2.1. Injectable
- 7.2.2. Oral
- 7.2.3. Topical
- 7.2.4. Other Dosage Forms
- 7.3. Market Analysis, Insights and Forecast - by Application
- 7.3.1. Oncology
- 7.3.2. Genetic Disorders
- 7.3.3. Neurology
- 7.3.4. Infectious Diseases
- 7.3.5. Respiratory
- 7.3.6. Cardiovascular
- 7.3.7. Other Applications
- 7.4. Market Analysis, Insights and Forecast - by End User
- 7.4.1. Pharmaceutical and Biopharmaceutical Companies
- 7.4.2. Government and Academic Institutes
- 7.1. Market Analysis, Insights and Forecast - by Service
- 8. Asia Pacific Formulation Development Outsourcing Industry Analysis, Insights and Forecast, 2019-2031
- 8.1. Market Analysis, Insights and Forecast - by Service
- 8.1.1. Pre-formulation Services
- 8.1.1.1. Discovery and Preclinical Services
- 8.1.1.2. Analytical Services
- 8.1.2. Formulation Optimization
- 8.1.2.1. Phase I
- 8.1.2.2. Phase II
- 8.1.2.3. Phase III
- 8.1.2.4. Phase IV
- 8.1.1. Pre-formulation Services
- 8.2. Market Analysis, Insights and Forecast - by Dosage Form
- 8.2.1. Injectable
- 8.2.2. Oral
- 8.2.3. Topical
- 8.2.4. Other Dosage Forms
- 8.3. Market Analysis, Insights and Forecast - by Application
- 8.3.1. Oncology
- 8.3.2. Genetic Disorders
- 8.3.3. Neurology
- 8.3.4. Infectious Diseases
- 8.3.5. Respiratory
- 8.3.6. Cardiovascular
- 8.3.7. Other Applications
- 8.4. Market Analysis, Insights and Forecast - by End User
- 8.4.1. Pharmaceutical and Biopharmaceutical Companies
- 8.4.2. Government and Academic Institutes
- 8.1. Market Analysis, Insights and Forecast - by Service
- 9. Middle East and Africa Formulation Development Outsourcing Industry Analysis, Insights and Forecast, 2019-2031
- 9.1. Market Analysis, Insights and Forecast - by Service
- 9.1.1. Pre-formulation Services
- 9.1.1.1. Discovery and Preclinical Services
- 9.1.1.2. Analytical Services
- 9.1.2. Formulation Optimization
- 9.1.2.1. Phase I
- 9.1.2.2. Phase II
- 9.1.2.3. Phase III
- 9.1.2.4. Phase IV
- 9.1.1. Pre-formulation Services
- 9.2. Market Analysis, Insights and Forecast - by Dosage Form
- 9.2.1. Injectable
- 9.2.2. Oral
- 9.2.3. Topical
- 9.2.4. Other Dosage Forms
- 9.3. Market Analysis, Insights and Forecast - by Application
- 9.3.1. Oncology
- 9.3.2. Genetic Disorders
- 9.3.3. Neurology
- 9.3.4. Infectious Diseases
- 9.3.5. Respiratory
- 9.3.6. Cardiovascular
- 9.3.7. Other Applications
- 9.4. Market Analysis, Insights and Forecast - by End User
- 9.4.1. Pharmaceutical and Biopharmaceutical Companies
- 9.4.2. Government and Academic Institutes
- 9.1. Market Analysis, Insights and Forecast - by Service
- 10. South America Formulation Development Outsourcing Industry Analysis, Insights and Forecast, 2019-2031
- 10.1. Market Analysis, Insights and Forecast - by Service
- 10.1.1. Pre-formulation Services
- 10.1.1.1. Discovery and Preclinical Services
- 10.1.1.2. Analytical Services
- 10.1.2. Formulation Optimization
- 10.1.2.1. Phase I
- 10.1.2.2. Phase II
- 10.1.2.3. Phase III
- 10.1.2.4. Phase IV
- 10.1.1. Pre-formulation Services
- 10.2. Market Analysis, Insights and Forecast - by Dosage Form
- 10.2.1. Injectable
- 10.2.2. Oral
- 10.2.3. Topical
- 10.2.4. Other Dosage Forms
- 10.3. Market Analysis, Insights and Forecast - by Application
- 10.3.1. Oncology
- 10.3.2. Genetic Disorders
- 10.3.3. Neurology
- 10.3.4. Infectious Diseases
- 10.3.5. Respiratory
- 10.3.6. Cardiovascular
- 10.3.7. Other Applications
- 10.4. Market Analysis, Insights and Forecast - by End User
- 10.4.1. Pharmaceutical and Biopharmaceutical Companies
- 10.4.2. Government and Academic Institutes
- 10.1. Market Analysis, Insights and Forecast - by Service
- 11. North America Formulation Development Outsourcing Industry Analysis, Insights and Forecast, 2019-2031
- 11.1. Market Analysis, Insights and Forecast - By Country/Sub-region
- 11.1.1 United States
- 11.1.2 Canada
- 11.1.3 Mexico
- 12. Europe Formulation Development Outsourcing Industry Analysis, Insights and Forecast, 2019-2031
- 12.1. Market Analysis, Insights and Forecast - By Country/Sub-region
- 12.1.1 Germany
- 12.1.2 United Kingdom
- 12.1.3 France
- 12.1.4 Italy
- 12.1.5 Spain
- 12.1.6 Rest of Europe
- 13. Asia Pacific Formulation Development Outsourcing Industry Analysis, Insights and Forecast, 2019-2031
- 13.1. Market Analysis, Insights and Forecast - By Country/Sub-region
- 13.1.1 China
- 13.1.2 Japan
- 13.1.3 India
- 13.1.4 Australia
- 13.1.5 South Korea
- 13.1.6 Rest of Asia Pacific
- 14. Middle East and Africa Formulation Development Outsourcing Industry Analysis, Insights and Forecast, 2019-2031
- 14.1. Market Analysis, Insights and Forecast - By Country/Sub-region
- 14.1.1 GCC
- 14.1.2 South Africa
- 14.1.3 Rest of Middle East and Africa
- 15. South America Formulation Development Outsourcing Industry Analysis, Insights and Forecast, 2019-2031
- 15.1. Market Analysis, Insights and Forecast - By Country/Sub-region
- 15.1.1 Brazil
- 15.1.2 Argentina
- 15.1.3 Rest of South America
- 16. Competitive Analysis
- 16.1. Global Market Share Analysis 2024
- 16.2. Company Profiles
- 16.2.1 Charles River Laboratories
- 16.2.1.1. Overview
- 16.2.1.2. Products
- 16.2.1.3. SWOT Analysis
- 16.2.1.4. Recent Developments
- 16.2.1.5. Financials (Based on Availability)
- 16.2.2 Intertek Group PLC
- 16.2.2.1. Overview
- 16.2.2.2. Products
- 16.2.2.3. SWOT Analysis
- 16.2.2.4. Recent Developments
- 16.2.2.5. Financials (Based on Availability)
- 16.2.3 Laboratory Corporation of America Holdings
- 16.2.3.1. Overview
- 16.2.3.2. Products
- 16.2.3.3. SWOT Analysis
- 16.2.3.4. Recent Developments
- 16.2.3.5. Financials (Based on Availability)
- 16.2.4 Patheon (Thermo Fisher Scientific Inc )
- 16.2.4.1. Overview
- 16.2.4.2. Products
- 16.2.4.3. SWOT Analysis
- 16.2.4.4. Recent Developments
- 16.2.4.5. Financials (Based on Availability)
- 16.2.5 Dr Reddy's Laboratories Ltd
- 16.2.5.1. Overview
- 16.2.5.2. Products
- 16.2.5.3. SWOT Analysis
- 16.2.5.4. Recent Developments
- 16.2.5.5. Financials (Based on Availability)
- 16.2.6 Irisys LLC
- 16.2.6.1. Overview
- 16.2.6.2. Products
- 16.2.6.3. SWOT Analysis
- 16.2.6.4. Recent Developments
- 16.2.6.5. Financials (Based on Availability)
- 16.2.7 Aizant Drug Research Solutions Private Limited
- 16.2.7.1. Overview
- 16.2.7.2. Products
- 16.2.7.3. SWOT Analysis
- 16.2.7.4. Recent Developments
- 16.2.7.5. Financials (Based on Availability)
- 16.2.8 Syngene International Ltd
- 16.2.8.1. Overview
- 16.2.8.2. Products
- 16.2.8.3. SWOT Analysis
- 16.2.8.4. Recent Developments
- 16.2.8.5. Financials (Based on Availability)
- 16.2.9 Lonza Group AG
- 16.2.9.1. Overview
- 16.2.9.2. Products
- 16.2.9.3. SWOT Analysis
- 16.2.9.4. Recent Developments
- 16.2.9.5. Financials (Based on Availability)
- 16.2.10 Piramal Pharma Solutions
- 16.2.10.1. Overview
- 16.2.10.2. Products
- 16.2.10.3. SWOT Analysis
- 16.2.10.4. Recent Developments
- 16.2.10.5. Financials (Based on Availability)
- 16.2.11 Qiotient Sciences
- 16.2.11.1. Overview
- 16.2.11.2. Products
- 16.2.11.3. SWOT Analysis
- 16.2.11.4. Recent Developments
- 16.2.11.5. Financials (Based on Availability)
- 16.2.12 Catalent Inc
- 16.2.12.1. Overview
- 16.2.12.2. Products
- 16.2.12.3. SWOT Analysis
- 16.2.12.4. Recent Developments
- 16.2.12.5. Financials (Based on Availability)
- 16.2.13 Emergent BioSolutions Inc
- 16.2.13.1. Overview
- 16.2.13.2. Products
- 16.2.13.3. SWOT Analysis
- 16.2.13.4. Recent Developments
- 16.2.13.5. Financials (Based on Availability)
- 16.2.1 Charles River Laboratories
List of Figures
- Figure 1: Global Formulation Development Outsourcing Industry Revenue Breakdown (Million, %) by Region 2024 & 2032
- Figure 2: North America Formulation Development Outsourcing Industry Revenue (Million), by Country 2024 & 2032
- Figure 3: North America Formulation Development Outsourcing Industry Revenue Share (%), by Country 2024 & 2032
- Figure 4: Europe Formulation Development Outsourcing Industry Revenue (Million), by Country 2024 & 2032
- Figure 5: Europe Formulation Development Outsourcing Industry Revenue Share (%), by Country 2024 & 2032
- Figure 6: Asia Pacific Formulation Development Outsourcing Industry Revenue (Million), by Country 2024 & 2032
- Figure 7: Asia Pacific Formulation Development Outsourcing Industry Revenue Share (%), by Country 2024 & 2032
- Figure 8: Middle East and Africa Formulation Development Outsourcing Industry Revenue (Million), by Country 2024 & 2032
- Figure 9: Middle East and Africa Formulation Development Outsourcing Industry Revenue Share (%), by Country 2024 & 2032
- Figure 10: South America Formulation Development Outsourcing Industry Revenue (Million), by Country 2024 & 2032
- Figure 11: South America Formulation Development Outsourcing Industry Revenue Share (%), by Country 2024 & 2032
- Figure 12: North America Formulation Development Outsourcing Industry Revenue (Million), by Service 2024 & 2032
- Figure 13: North America Formulation Development Outsourcing Industry Revenue Share (%), by Service 2024 & 2032
- Figure 14: North America Formulation Development Outsourcing Industry Revenue (Million), by Dosage Form 2024 & 2032
- Figure 15: North America Formulation Development Outsourcing Industry Revenue Share (%), by Dosage Form 2024 & 2032
- Figure 16: North America Formulation Development Outsourcing Industry Revenue (Million), by Application 2024 & 2032
- Figure 17: North America Formulation Development Outsourcing Industry Revenue Share (%), by Application 2024 & 2032
- Figure 18: North America Formulation Development Outsourcing Industry Revenue (Million), by End User 2024 & 2032
- Figure 19: North America Formulation Development Outsourcing Industry Revenue Share (%), by End User 2024 & 2032
- Figure 20: North America Formulation Development Outsourcing Industry Revenue (Million), by Country 2024 & 2032
- Figure 21: North America Formulation Development Outsourcing Industry Revenue Share (%), by Country 2024 & 2032
- Figure 22: Europe Formulation Development Outsourcing Industry Revenue (Million), by Service 2024 & 2032
- Figure 23: Europe Formulation Development Outsourcing Industry Revenue Share (%), by Service 2024 & 2032
- Figure 24: Europe Formulation Development Outsourcing Industry Revenue (Million), by Dosage Form 2024 & 2032
- Figure 25: Europe Formulation Development Outsourcing Industry Revenue Share (%), by Dosage Form 2024 & 2032
- Figure 26: Europe Formulation Development Outsourcing Industry Revenue (Million), by Application 2024 & 2032
- Figure 27: Europe Formulation Development Outsourcing Industry Revenue Share (%), by Application 2024 & 2032
- Figure 28: Europe Formulation Development Outsourcing Industry Revenue (Million), by End User 2024 & 2032
- Figure 29: Europe Formulation Development Outsourcing Industry Revenue Share (%), by End User 2024 & 2032
- Figure 30: Europe Formulation Development Outsourcing Industry Revenue (Million), by Country 2024 & 2032
- Figure 31: Europe Formulation Development Outsourcing Industry Revenue Share (%), by Country 2024 & 2032
- Figure 32: Asia Pacific Formulation Development Outsourcing Industry Revenue (Million), by Service 2024 & 2032
- Figure 33: Asia Pacific Formulation Development Outsourcing Industry Revenue Share (%), by Service 2024 & 2032
- Figure 34: Asia Pacific Formulation Development Outsourcing Industry Revenue (Million), by Dosage Form 2024 & 2032
- Figure 35: Asia Pacific Formulation Development Outsourcing Industry Revenue Share (%), by Dosage Form 2024 & 2032
- Figure 36: Asia Pacific Formulation Development Outsourcing Industry Revenue (Million), by Application 2024 & 2032
- Figure 37: Asia Pacific Formulation Development Outsourcing Industry Revenue Share (%), by Application 2024 & 2032
- Figure 38: Asia Pacific Formulation Development Outsourcing Industry Revenue (Million), by End User 2024 & 2032
- Figure 39: Asia Pacific Formulation Development Outsourcing Industry Revenue Share (%), by End User 2024 & 2032
- Figure 40: Asia Pacific Formulation Development Outsourcing Industry Revenue (Million), by Country 2024 & 2032
- Figure 41: Asia Pacific Formulation Development Outsourcing Industry Revenue Share (%), by Country 2024 & 2032
- Figure 42: Middle East and Africa Formulation Development Outsourcing Industry Revenue (Million), by Service 2024 & 2032
- Figure 43: Middle East and Africa Formulation Development Outsourcing Industry Revenue Share (%), by Service 2024 & 2032
- Figure 44: Middle East and Africa Formulation Development Outsourcing Industry Revenue (Million), by Dosage Form 2024 & 2032
- Figure 45: Middle East and Africa Formulation Development Outsourcing Industry Revenue Share (%), by Dosage Form 2024 & 2032
- Figure 46: Middle East and Africa Formulation Development Outsourcing Industry Revenue (Million), by Application 2024 & 2032
- Figure 47: Middle East and Africa Formulation Development Outsourcing Industry Revenue Share (%), by Application 2024 & 2032
- Figure 48: Middle East and Africa Formulation Development Outsourcing Industry Revenue (Million), by End User 2024 & 2032
- Figure 49: Middle East and Africa Formulation Development Outsourcing Industry Revenue Share (%), by End User 2024 & 2032
- Figure 50: Middle East and Africa Formulation Development Outsourcing Industry Revenue (Million), by Country 2024 & 2032
- Figure 51: Middle East and Africa Formulation Development Outsourcing Industry Revenue Share (%), by Country 2024 & 2032
- Figure 52: South America Formulation Development Outsourcing Industry Revenue (Million), by Service 2024 & 2032
- Figure 53: South America Formulation Development Outsourcing Industry Revenue Share (%), by Service 2024 & 2032
- Figure 54: South America Formulation Development Outsourcing Industry Revenue (Million), by Dosage Form 2024 & 2032
- Figure 55: South America Formulation Development Outsourcing Industry Revenue Share (%), by Dosage Form 2024 & 2032
- Figure 56: South America Formulation Development Outsourcing Industry Revenue (Million), by Application 2024 & 2032
- Figure 57: South America Formulation Development Outsourcing Industry Revenue Share (%), by Application 2024 & 2032
- Figure 58: South America Formulation Development Outsourcing Industry Revenue (Million), by End User 2024 & 2032
- Figure 59: South America Formulation Development Outsourcing Industry Revenue Share (%), by End User 2024 & 2032
- Figure 60: South America Formulation Development Outsourcing Industry Revenue (Million), by Country 2024 & 2032
- Figure 61: South America Formulation Development Outsourcing Industry Revenue Share (%), by Country 2024 & 2032
List of Tables
- Table 1: Global Formulation Development Outsourcing Industry Revenue Million Forecast, by Region 2019 & 2032
- Table 2: Global Formulation Development Outsourcing Industry Revenue Million Forecast, by Service 2019 & 2032
- Table 3: Global Formulation Development Outsourcing Industry Revenue Million Forecast, by Dosage Form 2019 & 2032
- Table 4: Global Formulation Development Outsourcing Industry Revenue Million Forecast, by Application 2019 & 2032
- Table 5: Global Formulation Development Outsourcing Industry Revenue Million Forecast, by End User 2019 & 2032
- Table 6: Global Formulation Development Outsourcing Industry Revenue Million Forecast, by Region 2019 & 2032
- Table 7: Global Formulation Development Outsourcing Industry Revenue Million Forecast, by Country 2019 & 2032
- Table 8: United States Formulation Development Outsourcing Industry Revenue (Million) Forecast, by Application 2019 & 2032
- Table 9: Canada Formulation Development Outsourcing Industry Revenue (Million) Forecast, by Application 2019 & 2032
- Table 10: Mexico Formulation Development Outsourcing Industry Revenue (Million) Forecast, by Application 2019 & 2032
- Table 11: Global Formulation Development Outsourcing Industry Revenue Million Forecast, by Country 2019 & 2032
- Table 12: Germany Formulation Development Outsourcing Industry Revenue (Million) Forecast, by Application 2019 & 2032
- Table 13: United Kingdom Formulation Development Outsourcing Industry Revenue (Million) Forecast, by Application 2019 & 2032
- Table 14: France Formulation Development Outsourcing Industry Revenue (Million) Forecast, by Application 2019 & 2032
- Table 15: Italy Formulation Development Outsourcing Industry Revenue (Million) Forecast, by Application 2019 & 2032
- Table 16: Spain Formulation Development Outsourcing Industry Revenue (Million) Forecast, by Application 2019 & 2032
- Table 17: Rest of Europe Formulation Development Outsourcing Industry Revenue (Million) Forecast, by Application 2019 & 2032
- Table 18: Global Formulation Development Outsourcing Industry Revenue Million Forecast, by Country 2019 & 2032
- Table 19: China Formulation Development Outsourcing Industry Revenue (Million) Forecast, by Application 2019 & 2032
- Table 20: Japan Formulation Development Outsourcing Industry Revenue (Million) Forecast, by Application 2019 & 2032
- Table 21: India Formulation Development Outsourcing Industry Revenue (Million) Forecast, by Application 2019 & 2032
- Table 22: Australia Formulation Development Outsourcing Industry Revenue (Million) Forecast, by Application 2019 & 2032
- Table 23: South Korea Formulation Development Outsourcing Industry Revenue (Million) Forecast, by Application 2019 & 2032
- Table 24: Rest of Asia Pacific Formulation Development Outsourcing Industry Revenue (Million) Forecast, by Application 2019 & 2032
- Table 25: Global Formulation Development Outsourcing Industry Revenue Million Forecast, by Country 2019 & 2032
- Table 26: GCC Formulation Development Outsourcing Industry Revenue (Million) Forecast, by Application 2019 & 2032
- Table 27: South Africa Formulation Development Outsourcing Industry Revenue (Million) Forecast, by Application 2019 & 2032
- Table 28: Rest of Middle East and Africa Formulation Development Outsourcing Industry Revenue (Million) Forecast, by Application 2019 & 2032
- Table 29: Global Formulation Development Outsourcing Industry Revenue Million Forecast, by Country 2019 & 2032
- Table 30: Brazil Formulation Development Outsourcing Industry Revenue (Million) Forecast, by Application 2019 & 2032
- Table 31: Argentina Formulation Development Outsourcing Industry Revenue (Million) Forecast, by Application 2019 & 2032
- Table 32: Rest of South America Formulation Development Outsourcing Industry Revenue (Million) Forecast, by Application 2019 & 2032
- Table 33: Global Formulation Development Outsourcing Industry Revenue Million Forecast, by Service 2019 & 2032
- Table 34: Global Formulation Development Outsourcing Industry Revenue Million Forecast, by Dosage Form 2019 & 2032
- Table 35: Global Formulation Development Outsourcing Industry Revenue Million Forecast, by Application 2019 & 2032
- Table 36: Global Formulation Development Outsourcing Industry Revenue Million Forecast, by End User 2019 & 2032
- Table 37: Global Formulation Development Outsourcing Industry Revenue Million Forecast, by Country 2019 & 2032
- Table 38: United States Formulation Development Outsourcing Industry Revenue (Million) Forecast, by Application 2019 & 2032
- Table 39: Canada Formulation Development Outsourcing Industry Revenue (Million) Forecast, by Application 2019 & 2032
- Table 40: Mexico Formulation Development Outsourcing Industry Revenue (Million) Forecast, by Application 2019 & 2032
- Table 41: Global Formulation Development Outsourcing Industry Revenue Million Forecast, by Service 2019 & 2032
- Table 42: Global Formulation Development Outsourcing Industry Revenue Million Forecast, by Dosage Form 2019 & 2032
- Table 43: Global Formulation Development Outsourcing Industry Revenue Million Forecast, by Application 2019 & 2032
- Table 44: Global Formulation Development Outsourcing Industry Revenue Million Forecast, by End User 2019 & 2032
- Table 45: Global Formulation Development Outsourcing Industry Revenue Million Forecast, by Country 2019 & 2032
- Table 46: Germany Formulation Development Outsourcing Industry Revenue (Million) Forecast, by Application 2019 & 2032
- Table 47: United Kingdom Formulation Development Outsourcing Industry Revenue (Million) Forecast, by Application 2019 & 2032
- Table 48: France Formulation Development Outsourcing Industry Revenue (Million) Forecast, by Application 2019 & 2032
- Table 49: Italy Formulation Development Outsourcing Industry Revenue (Million) Forecast, by Application 2019 & 2032
- Table 50: Spain Formulation Development Outsourcing Industry Revenue (Million) Forecast, by Application 2019 & 2032
- Table 51: Rest of Europe Formulation Development Outsourcing Industry Revenue (Million) Forecast, by Application 2019 & 2032
- Table 52: Global Formulation Development Outsourcing Industry Revenue Million Forecast, by Service 2019 & 2032
- Table 53: Global Formulation Development Outsourcing Industry Revenue Million Forecast, by Dosage Form 2019 & 2032
- Table 54: Global Formulation Development Outsourcing Industry Revenue Million Forecast, by Application 2019 & 2032
- Table 55: Global Formulation Development Outsourcing Industry Revenue Million Forecast, by End User 2019 & 2032
- Table 56: Global Formulation Development Outsourcing Industry Revenue Million Forecast, by Country 2019 & 2032
- Table 57: China Formulation Development Outsourcing Industry Revenue (Million) Forecast, by Application 2019 & 2032
- Table 58: Japan Formulation Development Outsourcing Industry Revenue (Million) Forecast, by Application 2019 & 2032
- Table 59: India Formulation Development Outsourcing Industry Revenue (Million) Forecast, by Application 2019 & 2032
- Table 60: Australia Formulation Development Outsourcing Industry Revenue (Million) Forecast, by Application 2019 & 2032
- Table 61: South Korea Formulation Development Outsourcing Industry Revenue (Million) Forecast, by Application 2019 & 2032
- Table 62: Rest of Asia Pacific Formulation Development Outsourcing Industry Revenue (Million) Forecast, by Application 2019 & 2032
- Table 63: Global Formulation Development Outsourcing Industry Revenue Million Forecast, by Service 2019 & 2032
- Table 64: Global Formulation Development Outsourcing Industry Revenue Million Forecast, by Dosage Form 2019 & 2032
- Table 65: Global Formulation Development Outsourcing Industry Revenue Million Forecast, by Application 2019 & 2032
- Table 66: Global Formulation Development Outsourcing Industry Revenue Million Forecast, by End User 2019 & 2032
- Table 67: Global Formulation Development Outsourcing Industry Revenue Million Forecast, by Country 2019 & 2032
- Table 68: GCC Formulation Development Outsourcing Industry Revenue (Million) Forecast, by Application 2019 & 2032
- Table 69: South Africa Formulation Development Outsourcing Industry Revenue (Million) Forecast, by Application 2019 & 2032
- Table 70: Rest of Middle East and Africa Formulation Development Outsourcing Industry Revenue (Million) Forecast, by Application 2019 & 2032
- Table 71: Global Formulation Development Outsourcing Industry Revenue Million Forecast, by Service 2019 & 2032
- Table 72: Global Formulation Development Outsourcing Industry Revenue Million Forecast, by Dosage Form 2019 & 2032
- Table 73: Global Formulation Development Outsourcing Industry Revenue Million Forecast, by Application 2019 & 2032
- Table 74: Global Formulation Development Outsourcing Industry Revenue Million Forecast, by End User 2019 & 2032
- Table 75: Global Formulation Development Outsourcing Industry Revenue Million Forecast, by Country 2019 & 2032
- Table 76: Brazil Formulation Development Outsourcing Industry Revenue (Million) Forecast, by Application 2019 & 2032
- Table 77: Argentina Formulation Development Outsourcing Industry Revenue (Million) Forecast, by Application 2019 & 2032
- Table 78: Rest of South America Formulation Development Outsourcing Industry Revenue (Million) Forecast, by Application 2019 & 2032
Frequently Asked Questions
1. What is the projected Compound Annual Growth Rate (CAGR) of the Formulation Development Outsourcing Industry?
The projected CAGR is approximately 6.16%.
2. Which companies are prominent players in the Formulation Development Outsourcing Industry?
Key companies in the market include Charles River Laboratories, Intertek Group PLC, Laboratory Corporation of America Holdings, Patheon (Thermo Fisher Scientific Inc ), Dr Reddy's Laboratories Ltd, Irisys LLC, Aizant Drug Research Solutions Private Limited, Syngene International Ltd, Lonza Group AG, Piramal Pharma Solutions, Qiotient Sciences, Catalent Inc, Emergent BioSolutions Inc.
3. What are the main segments of the Formulation Development Outsourcing Industry?
The market segments include Service, Dosage Form, Application, End User.
4. Can you provide details about the market size?
The market size is estimated to be USD 26.56 Million as of 2022.
5. What are some drivers contributing to market growth?
Increasing Trend of Patent Protection Expiration of Major Drugs; Rising Number of Pharmaceutical and Biopharmaceutical Companies Outsourcing Their Services.
6. What are the notable trends driving market growth?
The Oncology Segment is Expected to Witness Significant Growth over the Forecast Period.
7. Are there any restraints impacting market growth?
Structural Changes in the Pharmaceutical Industry; Insufficient Funding to Perform the Drug Development Process Through Formulation Development.
8. Can you provide examples of recent developments in the market?
N/A
9. What pricing options are available for accessing the report?
Pricing options include single-user, multi-user, and enterprise licenses priced at USD 4750, USD 5250, and USD 8750 respectively.
10. Is the market size provided in terms of value or volume?
The market size is provided in terms of value, measured in Million.
11. Are there any specific market keywords associated with the report?
Yes, the market keyword associated with the report is "Formulation Development Outsourcing Industry," which aids in identifying and referencing the specific market segment covered.
12. How do I determine which pricing option suits my needs best?
The pricing options vary based on user requirements and access needs. Individual users may opt for single-user licenses, while businesses requiring broader access may choose multi-user or enterprise licenses for cost-effective access to the report.
13. Are there any additional resources or data provided in the Formulation Development Outsourcing Industry report?
While the report offers comprehensive insights, it's advisable to review the specific contents or supplementary materials provided to ascertain if additional resources or data are available.
14. How can I stay updated on further developments or reports in the Formulation Development Outsourcing Industry?
To stay informed about further developments, trends, and reports in the Formulation Development Outsourcing Industry, consider subscribing to industry newsletters, following relevant companies and organizations, or regularly checking reputable industry news sources and publications.
Methodology
Step 1 - Identification of Relevant Samples Size from Population Database


Step 2 - Approaches for Defining Global Market Size (Value, Volume* & Price*)

Note*: In applicable scenarios
Step 3 - Data Sources
Primary Research
- Web Analytics
- Survey Reports
- Research Institute
- Latest Research Reports
- Opinion Leaders
Secondary Research
- Annual Reports
- White Paper
- Latest Press Release
- Industry Association
- Paid Database
- Investor Presentations

Step 4 - Data Triangulation
Involves using different sources of information in order to increase the validity of a study
These sources are likely to be stakeholders in a program - participants, other researchers, program staff, other community members, and so on.
Then we put all data in single framework & apply various statistical tools to find out the dynamic on the market.
During the analysis stage, feedback from the stakeholder groups would be compared to determine areas of agreement as well as areas of divergence


