

Key Insights
The global Force Sensors Market is poised for significant expansion, projected to reach an estimated $1.946 billion in 2025. This growth is underpinned by a robust Compound Annual Growth Rate (CAGR) of 5.78% over the forecast period of 2025-2033. Key drivers fueling this upward trajectory include the increasing demand for precise measurement and control across a multitude of industries. The healthcare sector's reliance on advanced medical devices for diagnostics and treatment, the industrial manufacturing sector's drive for automation and quality control, and the automotive industry's push towards sophisticated driver-assistance systems and electric vehicle technology are primary contributors. Furthermore, the aerospace and defense sector's stringent requirements for reliable component monitoring and the burgeoning consumer electronics market, with its integration of haptic feedback and touch-sensitive interfaces, are also substantial growth catalysts. The market is characterized by a dynamic interplay of technological advancements and evolving application needs, fostering innovation in sensor design and functionality.
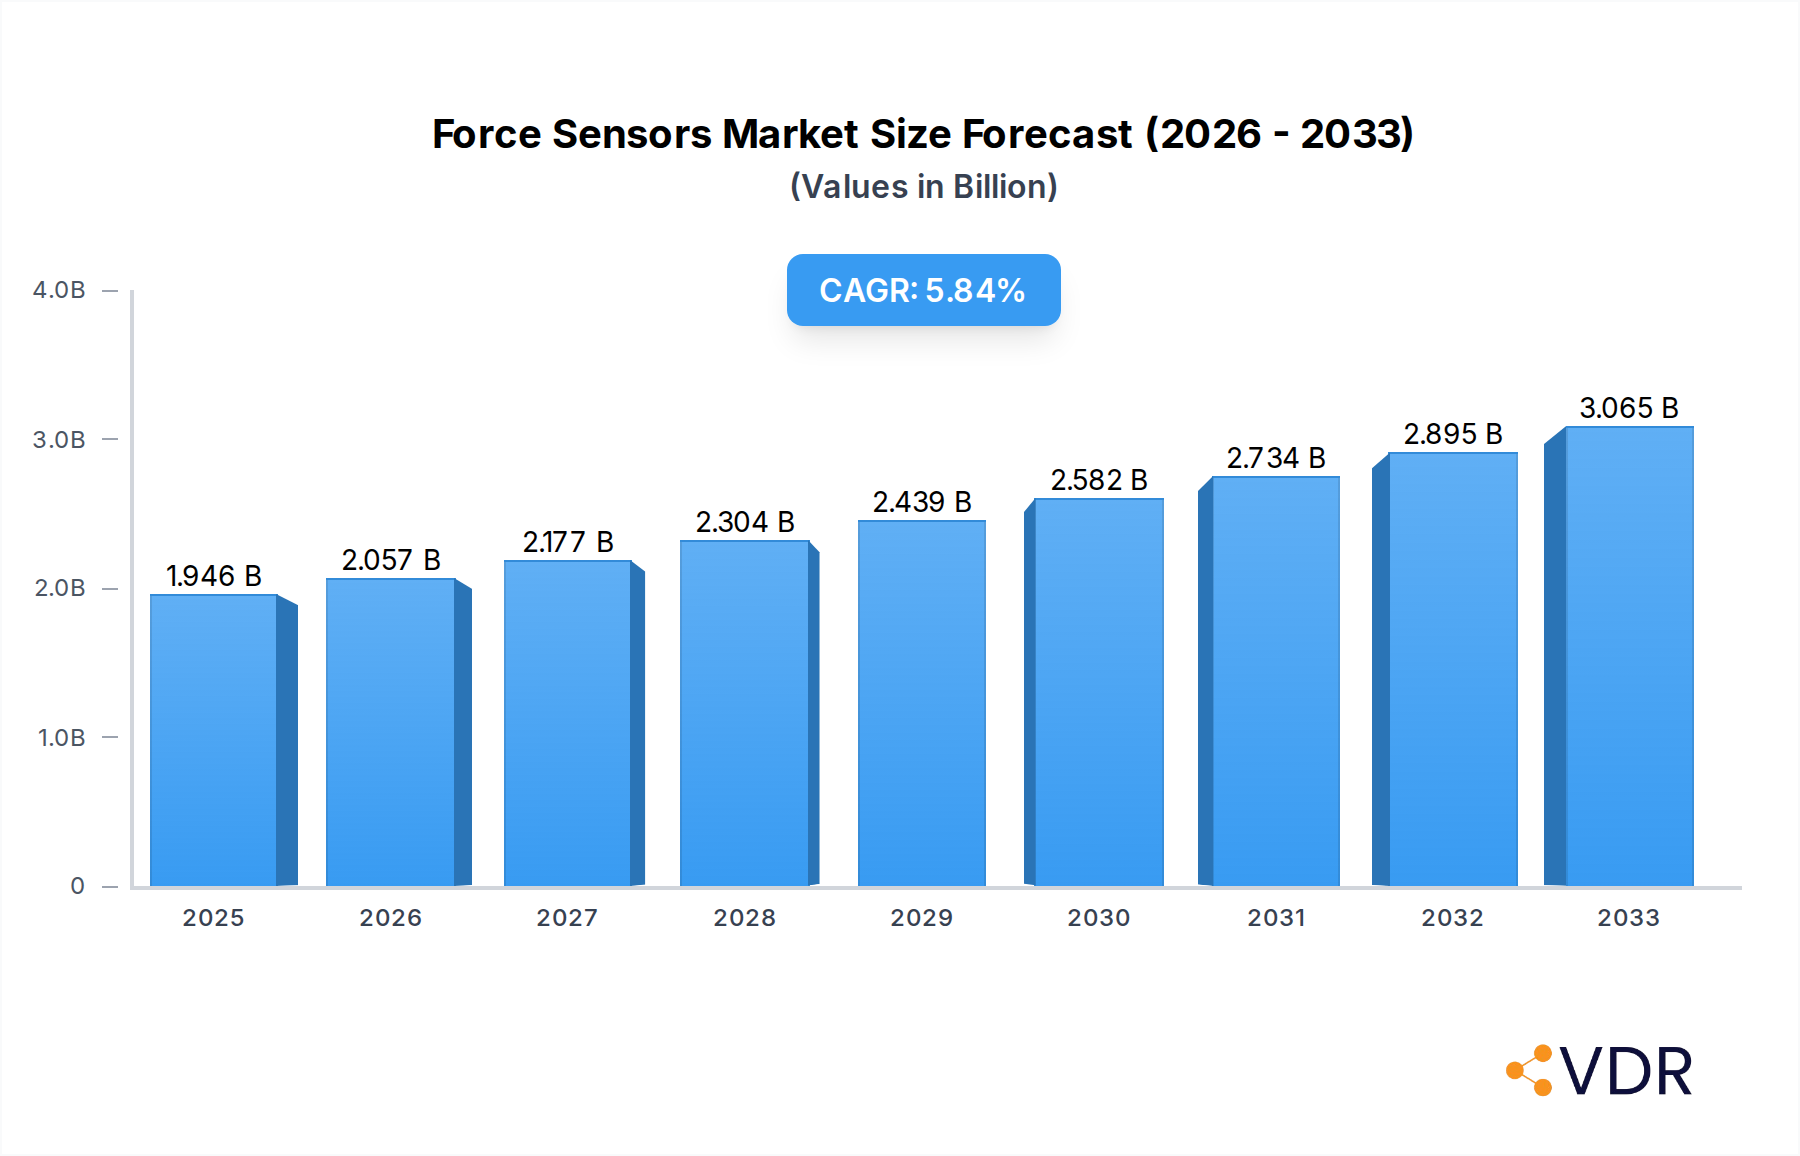
Force Sensors Market Market Size (In Billion)
The market is segmented by type, with Tension Force Sensors, Compression Force Sensors, and Tension and Compression Force Sensors each playing a crucial role. In terms of end-user industries, Healthcare, Industrial Manufacturing, Automotive, Aerospace and Defense, and Consumer Electronics represent the dominant segments, with 'Other End-user Industries' also contributing to the overall market breadth. Geographically, while specific regional values are not detailed, the market is expected to see strong performance across North America, Europe, and the Asia Pacific, driven by industrialization, technological adoption, and significant R&D investments. Restraints, such as the high cost of advanced sensor technologies and potential integration challenges in legacy systems, are being addressed through ongoing innovation and market accessibility initiatives. Emerging trends like the miniaturization of sensors, the integration of AI and IoT for data analytics, and the development of more durable and cost-effective materials are shaping the future landscape of the Force Sensors Market, ensuring its continued relevance and growth.

Force Sensors Market Company Market Share
This in-depth report provides a strategic analysis of the global Force Sensors Market, a critical component in various industries, including Automotive, Healthcare, and Industrial Manufacturing. With a focus on detailed market segmentation, technological advancements, and key player strategies, this report offers invaluable insights for stakeholders looking to navigate this dynamic landscape. Covering a study period from 2019 to 2033, with a base and estimated year of 2025, this analysis forecasts significant growth and evolution within the force sensor industry. The estimated market size for 2025 is projected to be $5.2 billion, with an anticipated expansion to $10.8 billion by 2033, exhibiting a Compound Annual Growth Rate (CAGR) of 9.6% during the forecast period (2025-2033).
Force Sensors Market Dynamics & Structure
The global Force Sensors Market is characterized by a moderate level of concentration, with a mix of large, established players and agile innovators. Technological innovation acts as a primary driver, with continuous advancements in miniaturization, sensitivity, and wireless capabilities enhancing sensor performance and opening new application avenues. Regulatory frameworks, particularly concerning safety and interoperability in sectors like automotive and healthcare, also shape market entry and product development. Competitive product substitutes, such as strain gauges and pressure sensors in certain applications, necessitate ongoing differentiation through superior accuracy, durability, and cost-effectiveness. End-user demographics are diversifying, with increasing demand from emerging economies and a growing emphasis on smart and connected devices across all industries. Mergers and acquisitions (M&A) activity has been steady, with larger companies acquiring specialized firms to expand their product portfolios and technological expertise. For instance, the M&A volume for the historical period (2019-2024) was approximately 15 significant deals, valued at over $300 million. Innovation barriers include the high cost of R&D, the need for specialized manufacturing processes, and stringent certification requirements in certain high-stakes applications.
- Market Concentration: Moderate, with key players holding significant market share but ample room for specialized innovators.
- Technological Innovation Drivers: Miniaturization, increased sensitivity, enhanced durability, wireless connectivity, and AI integration.
- Regulatory Frameworks: Standards for automotive safety (e.g., ISO 26262), medical device regulations (e.g., FDA), and industrial automation protocols.
- Competitive Product Substitutes: Strain gauges, pressure sensors, load cells, and proximity sensors in specific use cases.
- End-User Demographics: Diversifying across industrial, automotive, healthcare, consumer electronics, and aerospace sectors, with a growing demand for IoT-enabled solutions.
- M&A Trends: Strategic acquisitions to gain access to new technologies, expand market reach, and consolidate market positions.
Force Sensors Market Growth Trends & Insights
The Force Sensors Market is on a robust growth trajectory, driven by an insatiable demand for precision measurement and control across a multitude of applications. The market size has witnessed a steady evolution, expanding from approximately $3.5 billion in 2019 to an estimated $4.8 billion in 2024, reflecting strong historical growth. Adoption rates are accelerating, particularly in the industrial automation and automotive sectors, where force sensing is becoming indispensable for improving efficiency, safety, and product quality. Technological disruptions, such as the advent of printed electronics and advanced materials, are revolutionizing sensor design, leading to more flexible, lightweight, and cost-effective solutions. Consumer behavior shifts are also playing a crucial role, with an increasing demand for haptic feedback in consumer electronics and advanced human-machine interfaces. The market penetration of advanced force sensors is projected to exceed 25% in key industrial applications by 2028.
- Market Size Evolution: From an estimated $3.5 billion in 2019 to an estimated $4.8 billion in 2024, with strong projected growth to $10.8 billion by 2033.
- Adoption Rates: Rapidly increasing in industrial automation, automotive applications (ADAS, HMI), healthcare devices, and advanced robotics.
- Technological Disruptions: Advancements in MEMS technology, piezoelectric materials, conductive inks for printed sensors, and AI-driven data analytics for sensor outputs.
- Consumer Behavior Shifts: Growing demand for intuitive user interfaces, personalized product experiences (e.g., haptic feedback in gaming and wearables), and smart home devices that react to physical interaction.
- CAGR: Projected at 9.6% for the forecast period (2025-2033).
- Market Penetration: Expected to reach 25% in key industrial applications by 2028.
Dominant Regions, Countries, or Segments in Force Sensors Market
The Industrial Manufacturing end-user industry is currently the dominant segment driving growth in the global Force Sensors Market, accounting for an estimated 30% of the market share in 2025. This dominance is fueled by the widespread adoption of automation, robotics, and sophisticated machinery in manufacturing processes, requiring precise force measurement for quality control, process optimization, and safety. North America, particularly the United States, leads in terms of market size and technological adoption within this segment, driven by its advanced manufacturing capabilities and significant investments in Industry 4.0 initiatives. The presence of leading industrial automation companies and a strong R&D ecosystem further bolster its position.
- Dominant Segment: Industrial Manufacturing, projected to hold 30% of the market share in 2025.
- Key Drivers:
- Increased adoption of robotics and automated systems for efficiency and precision.
- Demand for real-time process monitoring and quality control.
- Integration of force sensors in assembly lines, material handling, and testing equipment.
- Growing emphasis on predictive maintenance through force-based anomaly detection.
- Supportive government initiatives promoting manufacturing automation and smart factories.
- Key Drivers:
- Dominant Region: North America, expected to contribute 35% to the global market revenue in 2025.
- Key Drivers:
- High concentration of advanced manufacturing facilities and a strong automotive sector.
- Significant R&D investments in new sensor technologies and applications.
- Robust economic policies supporting industrial growth and technological adoption.
- Well-established supply chains and a skilled workforce for sensor integration.
- Early adoption of Industry 4.0 principles and smart manufacturing technologies.
- Key Drivers:
- Leading Type: Compression Force Sensors are anticipated to capture a significant market share, estimated at 40% in 2025, due to their widespread use in structural monitoring, weighing systems, and various industrial applications where compressive forces are prevalent.
Force Sensors Market Product Landscape
The product landscape of the Force Sensors Market is marked by continuous innovation aimed at enhancing performance, expanding applications, and reducing costs. Key product innovations include the development of highly sensitive miniature force sensors for intricate applications, flexible and wearable sensors utilizing advanced materials like conductive polymers and elastomers, and wireless force sensors enabling easier integration and remote monitoring. Applications range from sophisticated medical devices and advanced automotive safety systems to intuitive consumer electronics with haptic feedback and industrial robots requiring precise force control. Performance metrics are consistently improving, with increased accuracy, wider operating temperature ranges, and enhanced durability becoming standard. Unique selling propositions often revolve around miniaturization, integration capabilities, and specialized functionalities tailored to niche markets.
Key Drivers, Barriers & Challenges in Force Sensors Market
Key Drivers: The Force Sensors Market is propelled by several key drivers including the relentless pursuit of automation and Industry 4.0 across manufacturing sectors, the increasing demand for advanced driver-assistance systems (ADAS) and autonomous driving features in the automotive industry, and the growing need for precise force feedback in medical devices and surgical robots. Technological advancements in MEMS and printed electronics are enabling smaller, more cost-effective, and versatile sensor solutions.
Barriers & Challenges: Despite the positive outlook, the market faces several challenges. High initial R&D costs and the complexity of manufacturing advanced force sensors can act as barriers to entry for smaller companies. Stringent regulatory compliance, particularly in healthcare and aerospace, adds to development timelines and expenses. Furthermore, the availability of lower-cost, albeit less precise, alternatives in some applications can pose a competitive challenge. Supply chain disruptions, as witnessed in recent global events, can impact production and lead times, while cybersecurity concerns for connected force sensor systems are also emerging. The market size of supply chain disruptions in 2023 was estimated at $50 million.
Emerging Opportunities in Force Sensors Market
Emerging opportunities within the Force Sensors Market are plentiful, driven by evolving technological frontiers and expanding application areas. The growing adoption of the Internet of Things (IoT) and smart manufacturing environments creates significant demand for connected and intelligent force sensors capable of real-time data transmission and analysis. The burgeoning field of wearable technology and the increasing focus on personalized healthcare present avenues for the development of highly sensitive, non-invasive force sensors for health monitoring and rehabilitation devices. Furthermore, advancements in artificial intelligence (AI) and machine learning are enabling sophisticated data interpretation from force sensors, opening up opportunities in predictive maintenance, human-robot collaboration, and advanced robotics. The projected growth for smart sensors in healthcare is 12% annually.
Growth Accelerators in the Force Sensors Market Industry
Several catalysts are accelerating the growth of the Force Sensors Market. Technological breakthroughs in material science, particularly in flexible and stretchable electronics, are paving the way for innovative sensor designs that can be integrated into a wider range of products and environments. Strategic partnerships between sensor manufacturers and end-user companies, such as collaborations between automotive OEMs and force sensor suppliers, are crucial for co-developing tailored solutions and accelerating market adoption. Furthermore, market expansion strategies focusing on emerging economies, where industrialization and technological adoption are rapidly increasing, represent a significant growth avenue. The development of standardized protocols for force sensor data integration is also a key accelerator, simplifying implementation and fostering wider adoption.
Key Players Shaping the Force Sensors Market Market
- Tecsis GmbH
- Futek Advanced Sensor Technology Inc
- Pressure Profile Systems Inc
- Interlink Electronics Inc
- Tangio Printed Electronics
- Tekscan Inc
- Shenzhen New Degree Technology Co Ltd
- Uneo Inc
- Hottinger Baldwin Messtechnik (HBM) GmbH
- Synaptics Inc
- Alps Electric Co Ltd
- Sensel Inc
- Flintec Group AB
- NextInput Inc
- Kavlico Corporation
Notable Milestones in Force Sensors Market Sector
- March 2022: Apple filed the latest patents indicating that Apple is trying to roll out Force Touch. According to the brand's most recent patent applications, new force sensors for the iPhone, iPad, MacBook, and Apple Watch are coming. The web publication Patently Apple has revealed the development.
- June 2022: The University of Cambridge is working on developing brand-new microfluidic force sensors. The new smart sensors are anticipated to extend implant lifetimes and lower the likelihood that patients would require challenging revision surgery. They help balance soft tissue during hip replacement and position an orthopedic implant correctly.
In-Depth Force Sensors Market Market Outlook
The future outlook for the Force Sensors Market is exceptionally bright, driven by pervasive technological advancements and expanding application frontiers. Growth accelerators such as the widespread adoption of IoT, the continuous innovation in flexible electronics, and strategic collaborations between industry leaders are expected to fuel market expansion. The increasing demand for enhanced user interfaces, particularly haptic feedback in consumer electronics, and the critical need for precision in healthcare and automotive safety systems will continue to drive innovation and adoption. Emerging economies present significant untapped potential, offering substantial opportunities for market players to establish a strong foothold. The integration of AI with force sensor data will unlock new levels of predictive capabilities and intelligent automation, further solidifying the indispensable role of force sensors in shaping future technologies. The estimated market value by 2033 is $10.8 billion.
Force Sensors Market Segmentation
-
1. Type
- 1.1. Tension Force Sensors
- 1.2. Compression Force Sensors
- 1.3. Tension and Compression Force Sensors
-
2. End-user Industry
- 2.1. Healthcare
- 2.2. Industrial Manufacturing
- 2.3. Automotive
- 2.4. Aerospace and Defense
- 2.5. Consumer Electronics
- 2.6. Other End-user Industries
Force Sensors Market Segmentation By Geography
- 1. North America
- 2. Europe
- 3. Asia Pacific
- 4. Latin America
- 5. Middle East and Africa
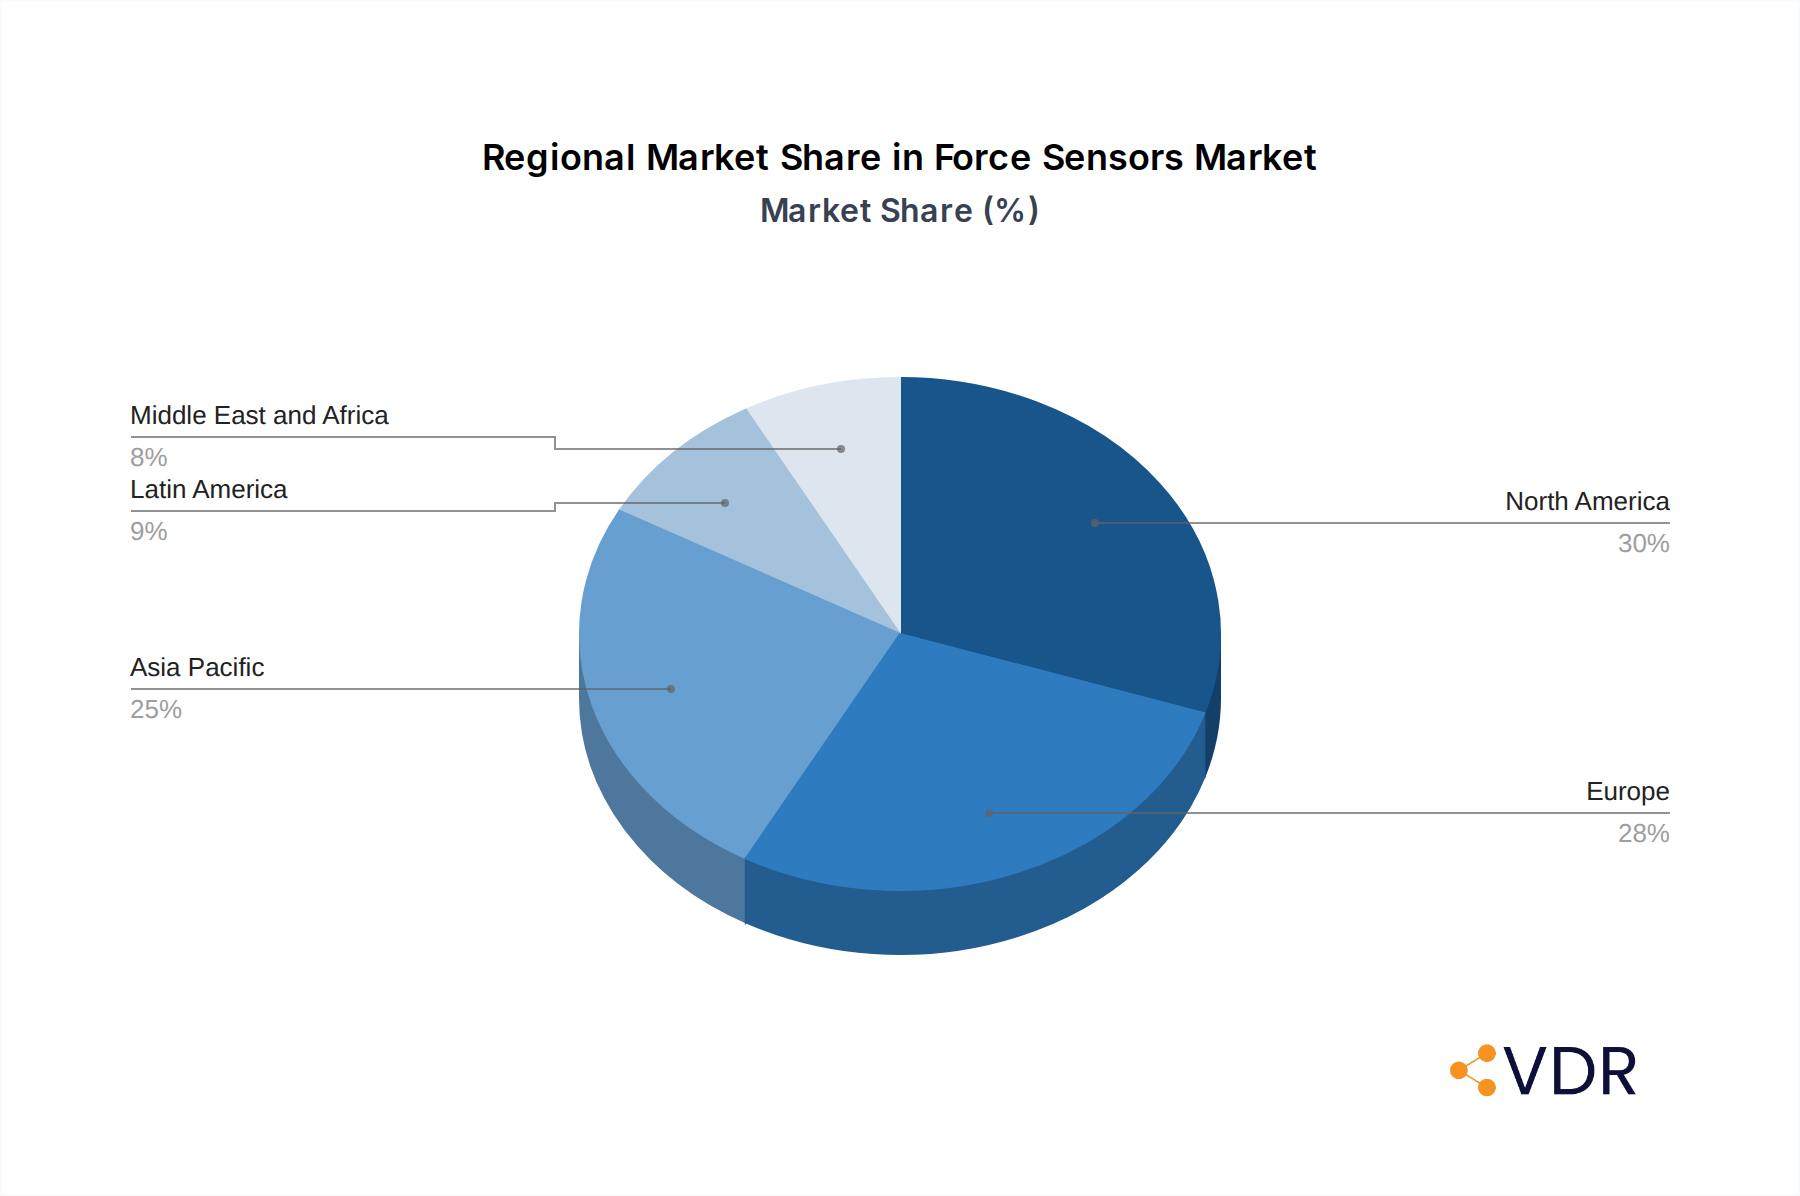
Force Sensors Market Regional Market Share
Geographic Coverage of Force Sensors Market
Force Sensors Market REPORT HIGHLIGHTS
| Aspects | Details |
|---|---|
| Study Period | 2020-2034 |
| Base Year | 2025 |
| Estimated Year | 2026 |
| Forecast Period | 2026-2034 |
| Historical Period | 2020-2025 |
| Growth Rate | CAGR of 5.78% from 2020-2034 |
| Segmentation |
|
Table of Contents
- 1. Introduction
- 1.1. Research Scope
- 1.2. Market Segmentation
- 1.3. Research Objective
- 1.4. Definitions and Assumptions
- 2. Executive Summary
- 2.1. Market Snapshot
- 3. Market Dynamics
- 3.1. Market Drivers
- 3.2. Market Restrains
- 3.3. Market Trends
- 3.4. Market Opportunities
- 4. Market Factor Analysis
- 4.1. Porters Five Forces
- 4.1.1. Bargaining Power of Suppliers
- 4.1.2. Bargaining Power of Buyers
- 4.1.3. Threat of New Entrants
- 4.1.4. Threat of Substitutes
- 4.1.5. Competitive Rivalry
- 4.2. PESTEL analysis
- 4.3. BCG Analysis
- 4.3.1. Stars (High Growth, High Market Share)
- 4.3.2. Cash Cows (Low Growth, High Market Share)
- 4.3.3. Question Mark (High Growth, Low Market Share)
- 4.3.4. Dogs (Low Growth, Low Market Share)
- 4.4. Ansoff Matrix Analysis
- 4.5. Supply Chain Analysis
- 4.6. Regulatory Landscape
- 4.7. Current Market Potential and Opportunity Assessment (TAM–SAM–SOM Framework)
- 4.8. VDR Analyst Note
- 4.1. Porters Five Forces
- 5. Market Analysis, Insights and Forecast 2021-2033
- 5.1. Market Analysis, Insights and Forecast - by Type
- 5.1.1. Tension Force Sensors
- 5.1.2. Compression Force Sensors
- 5.1.3. Tension and Compression Force Sensors
- 5.2. Market Analysis, Insights and Forecast - by End-user Industry
- 5.2.1. Healthcare
- 5.2.2. Industrial Manufacturing
- 5.2.3. Automotive
- 5.2.4. Aerospace and Defense
- 5.2.5. Consumer Electronics
- 5.2.6. Other End-user Industries
- 5.3. Market Analysis, Insights and Forecast - by Region
- 5.3.1. North America
- 5.3.2. Europe
- 5.3.3. Asia Pacific
- 5.3.4. Latin America
- 5.3.5. Middle East and Africa
- 5.1. Market Analysis, Insights and Forecast - by Type
- 6. Global Force Sensors Market Analysis, Insights and Forecast, 2021-2033
- 6.1. Market Analysis, Insights and Forecast - by Type
- 6.1.1. Tension Force Sensors
- 6.1.2. Compression Force Sensors
- 6.1.3. Tension and Compression Force Sensors
- 6.2. Market Analysis, Insights and Forecast - by End-user Industry
- 6.2.1. Healthcare
- 6.2.2. Industrial Manufacturing
- 6.2.3. Automotive
- 6.2.4. Aerospace and Defense
- 6.2.5. Consumer Electronics
- 6.2.6. Other End-user Industries
- 6.1. Market Analysis, Insights and Forecast - by Type
- 7. North America Force Sensors Market Analysis, Insights and Forecast, 2021-2033
- 7.1. Market Analysis, Insights and Forecast - by Type
- 7.1.1. Tension Force Sensors
- 7.1.2. Compression Force Sensors
- 7.1.3. Tension and Compression Force Sensors
- 7.2. Market Analysis, Insights and Forecast - by End-user Industry
- 7.2.1. Healthcare
- 7.2.2. Industrial Manufacturing
- 7.2.3. Automotive
- 7.2.4. Aerospace and Defense
- 7.2.5. Consumer Electronics
- 7.2.6. Other End-user Industries
- 7.1. Market Analysis, Insights and Forecast - by Type
- 8. Europe Force Sensors Market Analysis, Insights and Forecast, 2021-2033
- 8.1. Market Analysis, Insights and Forecast - by Type
- 8.1.1. Tension Force Sensors
- 8.1.2. Compression Force Sensors
- 8.1.3. Tension and Compression Force Sensors
- 8.2. Market Analysis, Insights and Forecast - by End-user Industry
- 8.2.1. Healthcare
- 8.2.2. Industrial Manufacturing
- 8.2.3. Automotive
- 8.2.4. Aerospace and Defense
- 8.2.5. Consumer Electronics
- 8.2.6. Other End-user Industries
- 8.1. Market Analysis, Insights and Forecast - by Type
- 9. Asia Pacific Force Sensors Market Analysis, Insights and Forecast, 2021-2033
- 9.1. Market Analysis, Insights and Forecast - by Type
- 9.1.1. Tension Force Sensors
- 9.1.2. Compression Force Sensors
- 9.1.3. Tension and Compression Force Sensors
- 9.2. Market Analysis, Insights and Forecast - by End-user Industry
- 9.2.1. Healthcare
- 9.2.2. Industrial Manufacturing
- 9.2.3. Automotive
- 9.2.4. Aerospace and Defense
- 9.2.5. Consumer Electronics
- 9.2.6. Other End-user Industries
- 9.1. Market Analysis, Insights and Forecast - by Type
- 10. Latin America Force Sensors Market Analysis, Insights and Forecast, 2021-2033
- 10.1. Market Analysis, Insights and Forecast - by Type
- 10.1.1. Tension Force Sensors
- 10.1.2. Compression Force Sensors
- 10.1.3. Tension and Compression Force Sensors
- 10.2. Market Analysis, Insights and Forecast - by End-user Industry
- 10.2.1. Healthcare
- 10.2.2. Industrial Manufacturing
- 10.2.3. Automotive
- 10.2.4. Aerospace and Defense
- 10.2.5. Consumer Electronics
- 10.2.6. Other End-user Industries
- 10.1. Market Analysis, Insights and Forecast - by Type
- 11. Middle East and Africa Force Sensors Market Analysis, Insights and Forecast, 2021-2033
- 11.1. Market Analysis, Insights and Forecast - by Type
- 11.1.1. Tension Force Sensors
- 11.1.2. Compression Force Sensors
- 11.1.3. Tension and Compression Force Sensors
- 11.2. Market Analysis, Insights and Forecast - by End-user Industry
- 11.2.1. Healthcare
- 11.2.2. Industrial Manufacturing
- 11.2.3. Automotive
- 11.2.4. Aerospace and Defense
- 11.2.5. Consumer Electronics
- 11.2.6. Other End-user Industries
- 11.1. Market Analysis, Insights and Forecast - by Type
- 12. Competitive Analysis
- 12.1. Company Profiles
- 12.1.1 Tecsis GmbH
- 12.1.1.1. Company Overview
- 12.1.1.2. Products
- 12.1.1.3. Company Financials
- 12.1.1.4. SWOT Analysis
- 12.1.2 Futek Advanced Sensor Technology Inc
- 12.1.2.1. Company Overview
- 12.1.2.2. Products
- 12.1.2.3. Company Financials
- 12.1.2.4. SWOT Analysis
- 12.1.3 Pressure Profile Systems Inc
- 12.1.3.1. Company Overview
- 12.1.3.2. Products
- 12.1.3.3. Company Financials
- 12.1.3.4. SWOT Analysis
- 12.1.4 Interlink Electronics Inc
- 12.1.4.1. Company Overview
- 12.1.4.2. Products
- 12.1.4.3. Company Financials
- 12.1.4.4. SWOT Analysis
- 12.1.5 Tangio Printed Electronics
- 12.1.5.1. Company Overview
- 12.1.5.2. Products
- 12.1.5.3. Company Financials
- 12.1.5.4. SWOT Analysis
- 12.1.6 Tekscan Inc
- 12.1.6.1. Company Overview
- 12.1.6.2. Products
- 12.1.6.3. Company Financials
- 12.1.6.4. SWOT Analysis
- 12.1.7 Shenzhen New Degree Technology Co Ltd
- 12.1.7.1. Company Overview
- 12.1.7.2. Products
- 12.1.7.3. Company Financials
- 12.1.7.4. SWOT Analysis
- 12.1.8 Uneo Inc
- 12.1.8.1. Company Overview
- 12.1.8.2. Products
- 12.1.8.3. Company Financials
- 12.1.8.4. SWOT Analysis
- 12.1.9 Hottinger Baldwin Messtechnik (HBM) GmbH
- 12.1.9.1. Company Overview
- 12.1.9.2. Products
- 12.1.9.3. Company Financials
- 12.1.9.4. SWOT Analysis
- 12.1.10 Synaptics Inc
- 12.1.10.1. Company Overview
- 12.1.10.2. Products
- 12.1.10.3. Company Financials
- 12.1.10.4. SWOT Analysis
- 12.1.11 Alps Electric Co Ltd
- 12.1.11.1. Company Overview
- 12.1.11.2. Products
- 12.1.11.3. Company Financials
- 12.1.11.4. SWOT Analysis
- 12.1.12 Sensel Inc
- 12.1.12.1. Company Overview
- 12.1.12.2. Products
- 12.1.12.3. Company Financials
- 12.1.12.4. SWOT Analysis
- 12.1.13 Flintec Group AB
- 12.1.13.1. Company Overview
- 12.1.13.2. Products
- 12.1.13.3. Company Financials
- 12.1.13.4. SWOT Analysis
- 12.1.14 NextInput Inc
- 12.1.14.1. Company Overview
- 12.1.14.2. Products
- 12.1.14.3. Company Financials
- 12.1.14.4. SWOT Analysis
- 12.1.15 Kavlico Corporation
- 12.1.15.1. Company Overview
- 12.1.15.2. Products
- 12.1.15.3. Company Financials
- 12.1.15.4. SWOT Analysis
- 12.1.1 Tecsis GmbH
- 12.2. Market Entropy
- 12.2.1 Company's Key Areas Served
- 12.2.2 Recent Developments
- 12.3. Company Market Share Analysis 2025
- 12.3.1 Top 5 Companies Market Share Analysis
- 12.3.2 Top 3 Companies Market Share Analysis
- 12.4. List of Potential Customers
- 13. Research Methodology
List of Figures
- Figure 1: Global Force Sensors Market Revenue Breakdown (billion, %) by Region 2025 & 2033
- Figure 2: Global Force Sensors Market Volume Breakdown (K Unit, %) by Region 2025 & 2033
- Figure 3: North America Force Sensors Market Revenue (billion), by Type 2025 & 2033
- Figure 4: North America Force Sensors Market Volume (K Unit), by Type 2025 & 2033
- Figure 5: North America Force Sensors Market Revenue Share (%), by Type 2025 & 2033
- Figure 6: North America Force Sensors Market Volume Share (%), by Type 2025 & 2033
- Figure 7: North America Force Sensors Market Revenue (billion), by End-user Industry 2025 & 2033
- Figure 8: North America Force Sensors Market Volume (K Unit), by End-user Industry 2025 & 2033
- Figure 9: North America Force Sensors Market Revenue Share (%), by End-user Industry 2025 & 2033
- Figure 10: North America Force Sensors Market Volume Share (%), by End-user Industry 2025 & 2033
- Figure 11: North America Force Sensors Market Revenue (billion), by Country 2025 & 2033
- Figure 12: North America Force Sensors Market Volume (K Unit), by Country 2025 & 2033
- Figure 13: North America Force Sensors Market Revenue Share (%), by Country 2025 & 2033
- Figure 14: North America Force Sensors Market Volume Share (%), by Country 2025 & 2033
- Figure 15: Europe Force Sensors Market Revenue (billion), by Type 2025 & 2033
- Figure 16: Europe Force Sensors Market Volume (K Unit), by Type 2025 & 2033
- Figure 17: Europe Force Sensors Market Revenue Share (%), by Type 2025 & 2033
- Figure 18: Europe Force Sensors Market Volume Share (%), by Type 2025 & 2033
- Figure 19: Europe Force Sensors Market Revenue (billion), by End-user Industry 2025 & 2033
- Figure 20: Europe Force Sensors Market Volume (K Unit), by End-user Industry 2025 & 2033
- Figure 21: Europe Force Sensors Market Revenue Share (%), by End-user Industry 2025 & 2033
- Figure 22: Europe Force Sensors Market Volume Share (%), by End-user Industry 2025 & 2033
- Figure 23: Europe Force Sensors Market Revenue (billion), by Country 2025 & 2033
- Figure 24: Europe Force Sensors Market Volume (K Unit), by Country 2025 & 2033
- Figure 25: Europe Force Sensors Market Revenue Share (%), by Country 2025 & 2033
- Figure 26: Europe Force Sensors Market Volume Share (%), by Country 2025 & 2033
- Figure 27: Asia Pacific Force Sensors Market Revenue (billion), by Type 2025 & 2033
- Figure 28: Asia Pacific Force Sensors Market Volume (K Unit), by Type 2025 & 2033
- Figure 29: Asia Pacific Force Sensors Market Revenue Share (%), by Type 2025 & 2033
- Figure 30: Asia Pacific Force Sensors Market Volume Share (%), by Type 2025 & 2033
- Figure 31: Asia Pacific Force Sensors Market Revenue (billion), by End-user Industry 2025 & 2033
- Figure 32: Asia Pacific Force Sensors Market Volume (K Unit), by End-user Industry 2025 & 2033
- Figure 33: Asia Pacific Force Sensors Market Revenue Share (%), by End-user Industry 2025 & 2033
- Figure 34: Asia Pacific Force Sensors Market Volume Share (%), by End-user Industry 2025 & 2033
- Figure 35: Asia Pacific Force Sensors Market Revenue (billion), by Country 2025 & 2033
- Figure 36: Asia Pacific Force Sensors Market Volume (K Unit), by Country 2025 & 2033
- Figure 37: Asia Pacific Force Sensors Market Revenue Share (%), by Country 2025 & 2033
- Figure 38: Asia Pacific Force Sensors Market Volume Share (%), by Country 2025 & 2033
- Figure 39: Latin America Force Sensors Market Revenue (billion), by Type 2025 & 2033
- Figure 40: Latin America Force Sensors Market Volume (K Unit), by Type 2025 & 2033
- Figure 41: Latin America Force Sensors Market Revenue Share (%), by Type 2025 & 2033
- Figure 42: Latin America Force Sensors Market Volume Share (%), by Type 2025 & 2033
- Figure 43: Latin America Force Sensors Market Revenue (billion), by End-user Industry 2025 & 2033
- Figure 44: Latin America Force Sensors Market Volume (K Unit), by End-user Industry 2025 & 2033
- Figure 45: Latin America Force Sensors Market Revenue Share (%), by End-user Industry 2025 & 2033
- Figure 46: Latin America Force Sensors Market Volume Share (%), by End-user Industry 2025 & 2033
- Figure 47: Latin America Force Sensors Market Revenue (billion), by Country 2025 & 2033
- Figure 48: Latin America Force Sensors Market Volume (K Unit), by Country 2025 & 2033
- Figure 49: Latin America Force Sensors Market Revenue Share (%), by Country 2025 & 2033
- Figure 50: Latin America Force Sensors Market Volume Share (%), by Country 2025 & 2033
- Figure 51: Middle East and Africa Force Sensors Market Revenue (billion), by Type 2025 & 2033
- Figure 52: Middle East and Africa Force Sensors Market Volume (K Unit), by Type 2025 & 2033
- Figure 53: Middle East and Africa Force Sensors Market Revenue Share (%), by Type 2025 & 2033
- Figure 54: Middle East and Africa Force Sensors Market Volume Share (%), by Type 2025 & 2033
- Figure 55: Middle East and Africa Force Sensors Market Revenue (billion), by End-user Industry 2025 & 2033
- Figure 56: Middle East and Africa Force Sensors Market Volume (K Unit), by End-user Industry 2025 & 2033
- Figure 57: Middle East and Africa Force Sensors Market Revenue Share (%), by End-user Industry 2025 & 2033
- Figure 58: Middle East and Africa Force Sensors Market Volume Share (%), by End-user Industry 2025 & 2033
- Figure 59: Middle East and Africa Force Sensors Market Revenue (billion), by Country 2025 & 2033
- Figure 60: Middle East and Africa Force Sensors Market Volume (K Unit), by Country 2025 & 2033
- Figure 61: Middle East and Africa Force Sensors Market Revenue Share (%), by Country 2025 & 2033
- Figure 62: Middle East and Africa Force Sensors Market Volume Share (%), by Country 2025 & 2033
List of Tables
- Table 1: Global Force Sensors Market Revenue billion Forecast, by Type 2020 & 2033
- Table 2: Global Force Sensors Market Volume K Unit Forecast, by Type 2020 & 2033
- Table 3: Global Force Sensors Market Revenue billion Forecast, by End-user Industry 2020 & 2033
- Table 4: Global Force Sensors Market Volume K Unit Forecast, by End-user Industry 2020 & 2033
- Table 5: Global Force Sensors Market Revenue billion Forecast, by Region 2020 & 2033
- Table 6: Global Force Sensors Market Volume K Unit Forecast, by Region 2020 & 2033
- Table 7: Global Force Sensors Market Revenue billion Forecast, by Type 2020 & 2033
- Table 8: Global Force Sensors Market Volume K Unit Forecast, by Type 2020 & 2033
- Table 9: Global Force Sensors Market Revenue billion Forecast, by End-user Industry 2020 & 2033
- Table 10: Global Force Sensors Market Volume K Unit Forecast, by End-user Industry 2020 & 2033
- Table 11: Global Force Sensors Market Revenue billion Forecast, by Country 2020 & 2033
- Table 12: Global Force Sensors Market Volume K Unit Forecast, by Country 2020 & 2033
- Table 13: Global Force Sensors Market Revenue billion Forecast, by Type 2020 & 2033
- Table 14: Global Force Sensors Market Volume K Unit Forecast, by Type 2020 & 2033
- Table 15: Global Force Sensors Market Revenue billion Forecast, by End-user Industry 2020 & 2033
- Table 16: Global Force Sensors Market Volume K Unit Forecast, by End-user Industry 2020 & 2033
- Table 17: Global Force Sensors Market Revenue billion Forecast, by Country 2020 & 2033
- Table 18: Global Force Sensors Market Volume K Unit Forecast, by Country 2020 & 2033
- Table 19: Global Force Sensors Market Revenue billion Forecast, by Type 2020 & 2033
- Table 20: Global Force Sensors Market Volume K Unit Forecast, by Type 2020 & 2033
- Table 21: Global Force Sensors Market Revenue billion Forecast, by End-user Industry 2020 & 2033
- Table 22: Global Force Sensors Market Volume K Unit Forecast, by End-user Industry 2020 & 2033
- Table 23: Global Force Sensors Market Revenue billion Forecast, by Country 2020 & 2033
- Table 24: Global Force Sensors Market Volume K Unit Forecast, by Country 2020 & 2033
- Table 25: Global Force Sensors Market Revenue billion Forecast, by Type 2020 & 2033
- Table 26: Global Force Sensors Market Volume K Unit Forecast, by Type 2020 & 2033
- Table 27: Global Force Sensors Market Revenue billion Forecast, by End-user Industry 2020 & 2033
- Table 28: Global Force Sensors Market Volume K Unit Forecast, by End-user Industry 2020 & 2033
- Table 29: Global Force Sensors Market Revenue billion Forecast, by Country 2020 & 2033
- Table 30: Global Force Sensors Market Volume K Unit Forecast, by Country 2020 & 2033
- Table 31: Global Force Sensors Market Revenue billion Forecast, by Type 2020 & 2033
- Table 32: Global Force Sensors Market Volume K Unit Forecast, by Type 2020 & 2033
- Table 33: Global Force Sensors Market Revenue billion Forecast, by End-user Industry 2020 & 2033
- Table 34: Global Force Sensors Market Volume K Unit Forecast, by End-user Industry 2020 & 2033
- Table 35: Global Force Sensors Market Revenue billion Forecast, by Country 2020 & 2033
- Table 36: Global Force Sensors Market Volume K Unit Forecast, by Country 2020 & 2033
Frequently Asked Questions
1. What is the projected Compound Annual Growth Rate (CAGR) of the Force Sensors Market?
The projected CAGR is approximately 5.78%.
2. Which companies are prominent players in the Force Sensors Market?
Key companies in the market include Tecsis GmbH, Futek Advanced Sensor Technology Inc, Pressure Profile Systems Inc, Interlink Electronics Inc, Tangio Printed Electronics, Tekscan Inc, Shenzhen New Degree Technology Co Ltd, Uneo Inc, Hottinger Baldwin Messtechnik (HBM) GmbH, Synaptics Inc, Alps Electric Co Ltd, Sensel Inc, Flintec Group AB, NextInput Inc , Kavlico Corporation.
3. What are the main segments of the Force Sensors Market?
The market segments include Type, End-user Industry.
4. Can you provide details about the market size?
The market size is estimated to be USD 1.946 billion as of 2022.
5. What are some drivers contributing to market growth?
Innovation and Development in the Consumer Electronics Sector; Surging Demand in the Automotive Sector.
6. What are the notable trends driving market growth?
Automotive Sector is Expected to Register a Significant Growth.
7. Are there any restraints impacting market growth?
Fluctuating Market Demands and Customization Issues.
8. Can you provide examples of recent developments in the market?
March 2022 - Apple filled the latest patents indicating that Apple is trying to roll out Force Touch. According to the brand's most recent patent applications, new force sensors for the iPhone, iPad, MacBook, and Apple Watch are coming. The web publication Patently Apple has revealed the development.
9. What pricing options are available for accessing the report?
Pricing options include single-user, multi-user, and enterprise licenses priced at USD 4750, USD 5250, and USD 8750 respectively.
10. Is the market size provided in terms of value or volume?
The market size is provided in terms of value, measured in billion and volume, measured in K Unit.
11. Are there any specific market keywords associated with the report?
Yes, the market keyword associated with the report is "Force Sensors Market," which aids in identifying and referencing the specific market segment covered.
12. How do I determine which pricing option suits my needs best?
The pricing options vary based on user requirements and access needs. Individual users may opt for single-user licenses, while businesses requiring broader access may choose multi-user or enterprise licenses for cost-effective access to the report.
13. Are there any additional resources or data provided in the Force Sensors Market report?
While the report offers comprehensive insights, it's advisable to review the specific contents or supplementary materials provided to ascertain if additional resources or data are available.
14. How can I stay updated on further developments or reports in the Force Sensors Market?
To stay informed about further developments, trends, and reports in the Force Sensors Market, consider subscribing to industry newsletters, following relevant companies and organizations, or regularly checking reputable industry news sources and publications.
Methodology
Step 1 - Identification of Relevant Samples Size from Population Database


Step 2 - Approaches for Defining Global Market Size (Value, Volume* & Price*)

Note*: In applicable scenarios
Step 3 - Data Sources
Primary Research
- Web Analytics
- Survey Reports
- Research Institute
- Latest Research Reports
- Opinion Leaders
Secondary Research
- Annual Reports
- White Paper
- Latest Press Release
- Industry Association
- Paid Database
- Investor Presentations

Step 4 - Data Triangulation
Involves using different sources of information in order to increase the validity of a study
These sources are likely to be stakeholders in a program - participants, other researchers, program staff, other community members, and so on.
Then we put all data in single framework & apply various statistical tools to find out the dynamic on the market.
During the analysis stage, feedback from the stakeholder groups would be compared to determine areas of agreement as well as areas of divergence