

Key Insights
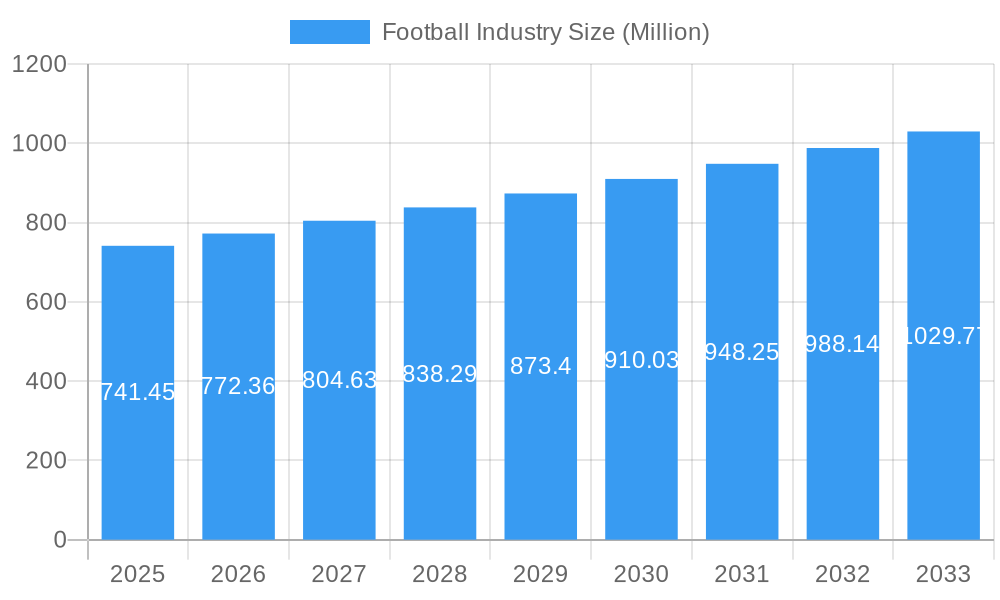
The global football industry, valued at $741.45 million in 2025, is projected to experience steady growth, exhibiting a Compound Annual Growth Rate (CAGR) of 4.09% from 2025 to 2033. This growth is fueled by several key factors. Rising disposable incomes, particularly in developing economies, are leading to increased participation in football at both amateur and professional levels, driving demand for equipment, apparel, and related services. The increasing popularity of televised football matches and global tournaments further enhances brand visibility and fuels consumer interest. Technological advancements in sportswear, incorporating innovative materials and designs for improved performance and comfort, contribute to market expansion. The industry's segmentation, encompassing diverse product categories like footballs, boots, apparel, and accessories, distributed through various channels including specialty stores, supermarkets, online platforms, and other retailers, facilitates market penetration and caters to a broad consumer base. However, the market faces certain challenges, including fluctuating raw material prices and increasing competition from other sports. The dominance of major brands like Adidas, Nike, and Puma, alongside the emergence of regional players, creates a dynamic and competitive landscape. Geographical variations exist in market penetration, with North America and Europe currently holding significant market share, while regions like Asia-Pacific are expected to witness rapid growth in the coming years, driven by rising participation rates and increasing brand awareness.
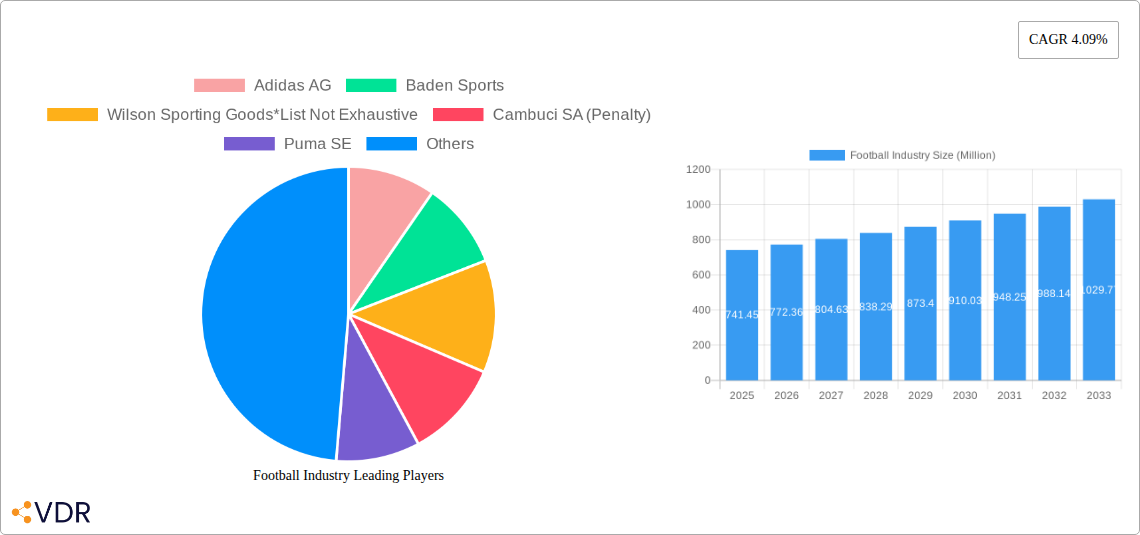
Football Industry Market Size (In Million)
The strategic growth trajectory for the football industry rests on several pillars. Brands are increasingly focusing on developing sustainable and ethical products to resonate with environmentally conscious consumers. Partnerships with prominent football clubs and athletes play a crucial role in building brand recognition and driving sales. Digital marketing strategies and e-commerce expansion are essential for reaching wider audiences. Furthermore, focusing on innovation and technological advancements in product design and manufacturing ensures competitiveness in a constantly evolving market. Understanding regional preferences and tailoring product offerings accordingly is also crucial for maximizing market penetration across diverse geographical locations. The industry's long-term prospects remain positive, driven by continuous growth in football's global popularity, coupled with ongoing innovations in product design and distribution strategies.
Football Industry Company Market Share
Football Industry Market Report: 2019-2033
This comprehensive report provides an in-depth analysis of the global football industry market, encompassing market dynamics, growth trends, regional dominance, product landscape, key players, and future outlook. The study period covers 2019-2033, with 2025 as the base year and a forecast period of 2025-2033. The report is essential for industry professionals, investors, and anyone seeking a thorough understanding of this dynamic market. The parent market is the sporting goods industry, while the child market is football equipment specifically. The total market value in 2025 is estimated at xx Million.
Football Industry Market Dynamics & Structure
This section analyzes the competitive landscape, technological advancements, regulatory influences, and market trends within the football industry. The market is characterized by a moderate level of concentration, with key players such as Nike Inc, Adidas AG, and Puma SE holding significant market share. However, smaller players like Decathlon and Mitre International also contribute significantly to the overall market dynamics.
- Market Concentration: The top 5 players hold an estimated xx% market share in 2025.
- Technological Innovation: Advancements in material science (e.g., improved aerodynamics, durability) and manufacturing techniques drive product innovation.
- Regulatory Framework: Safety regulations and standards impact manufacturing and distribution.
- Competitive Substitutes: Limited direct substitutes exist; however, the industry faces competition from other sports equipment segments.
- End-User Demographics: The primary end-users are professional and amateur football clubs, along with individual consumers.
- M&A Trends: The number of M&A deals in the past five years has averaged xx per year, with a focus on expanding distribution networks and acquiring innovative technologies. The total value of these deals reached xx Million in 2024.
Football Industry Growth Trends & Insights
The global football industry is experiencing robust growth, driven by increasing participation rates, rising disposable incomes in emerging markets, and technological advancements. The market size is projected to expand at a CAGR of xx% during the forecast period (2025-2033), reaching xx Million by 2033. This growth is fueled by the rising popularity of football globally, increasing sponsorship deals, and the growing influence of social media in promoting the sport and related products. Adoption rates are highest in established football markets, but substantial growth is expected in emerging markets due to rising consumer spending and increasing television viewership. Technological disruptions such as improved manufacturing processes and the integration of smart technologies into football products are also impacting the growth trajectory.
Dominant Regions, Countries, or Segments in Football Industry
Europe and North America currently dominate the football industry, accounting for xx% of the global market share in 2025. However, Asia-Pacific is poised for significant growth, driven by the increasing popularity of football in countries like China and India.
- Size Segmentation: Size 5 dominates the market in terms of volume, followed by Size 4, Size 3, Size 2 and Size 1. The distribution across sizes largely depends on age group and playing level.
- Distribution Channel: Online stores are experiencing the fastest growth, reflecting changing consumer preferences. Specialty stores still hold a significant market share, while supermarkets and hypermarkets cater to a more price-sensitive segment.
Key Drivers:
- Strong existing football culture in Europe and North America
- Rising disposable incomes in Asia-Pacific
- Increased media coverage and broadcasting rights deals
- Government initiatives promoting sports and fitness
Football Industry Product Landscape
The football industry offers a wide range of products, including match balls, training balls, goalkeeping gloves, shin guards, and other football accessories. Continuous innovation focuses on enhancing performance, durability, and aesthetics. Recent advancements include improved aerodynamics, lighter materials, and enhanced grip technologies in gloves. The industry is witnessing increased use of sustainable materials, contributing to the market's sustainability focus. Unique selling propositions often revolve around technological features (e.g., Nike's Aerowsculpt technology) or endorsements by prominent players.
Key Drivers, Barriers & Challenges in Football Industry
Key Drivers:
- Growing global popularity of football.
- Technological advancements leading to better quality and more innovative products.
- Increased sponsorship and media deals.
Challenges and Restraints:
- Fluctuations in raw material prices.
- Intense competition among major players.
- Supply chain disruptions and geopolitical instability can impact the availability of materials and manufacturing capacity. The impact in 2023 was an estimated xx% reduction in production for some key players.
Emerging Opportunities in Football Industry
Emerging opportunities lie in untapped markets in developing economies, the growing demand for personalized equipment, and the integration of wearable technology to track player performance. The increasing focus on sustainability presents an opportunity for eco-friendly product development and manufacturing processes. The expansion into e-sports and virtual football simulations also offers potential for growth.
Growth Accelerators in the Football Industry
Long-term growth will be driven by technological advancements such as AI-powered training tools and smart balls, strategic partnerships between brands and football clubs, and expansion into new markets through digital platforms and enhanced global distribution networks. Sustainability initiatives and the adoption of circular economy principles will also contribute to long-term market growth.
Notable Milestones in Football Industry Sector
- October 2022: Nike launched a new High Visibility Premier League ball.
- June 2022: PUMA partnered with Lega Serie A to launch a new match ball.
- April 2021: Decathlon's Kipsta became the official ball supplier for French soccer's top two divisions.
In-Depth Football Industry Market Outlook
The football industry is poised for continued growth, driven by the factors mentioned above. Strategic partnerships, technological innovation, and expansion into new markets will be key to success. The potential for growth in emerging markets and through new product categories, such as smart football technology, represents significant opportunities for companies in the industry. The market is expected to maintain its upward trajectory, showing resilience against short-term economic headwinds.
Football Industry Segmentation
-
1. Size
- 1.1. Size 1
- 1.2. Size 2
- 1.3. Size 3
- 1.4. Size 4
- 1.5. Size 5
-
2. Distribution Channel
- 2.1. Specialty Stores
- 2.2. Supermarkets and Hypermarkets
- 2.3. Online Stores
- 2.4. Other Distribution Channels
Football Industry Segmentation By Geography
-
1. North America
- 1.1. United States
- 1.2. Canada
- 1.3. Mexico
- 1.4. Rest of North America
-
2. Europe
- 2.1. Germany
- 2.2. United Kingdom
- 2.3. France
- 2.4. Spain
- 2.5. Italy
- 2.6. Russia
- 2.7. Rest of Europe
-
3. Asia Pacific
- 3.1. China
- 3.2. Japan
- 3.3. India
- 3.4. Australia
- 3.5. Rest of Asia Pacific
-
4. South America
- 4.1. Brazil
- 4.2. Argentina
- 4.3. Rest of South America
-
5. Middle East and Africa
- 5.1. South Africa
- 5.2. Saudi Arabia
- 5.3. Rest of Middle East and Africa
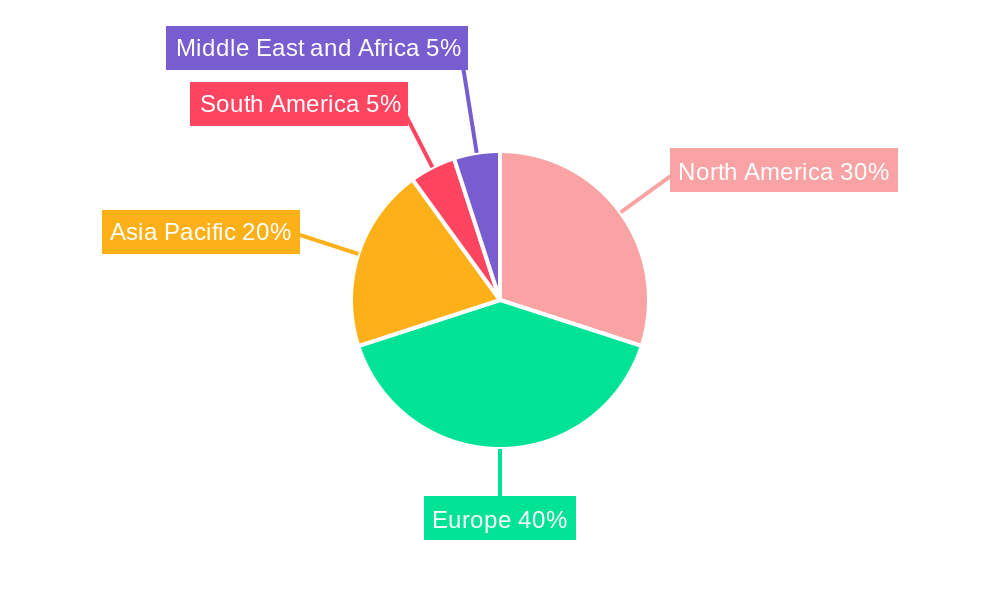
Football Industry Regional Market Share
Geographic Coverage of Football Industry
Football Industry REPORT HIGHLIGHTS
| Aspects | Details |
|---|---|
| Study Period | 2020-2034 |
| Base Year | 2025 |
| Estimated Year | 2026 |
| Forecast Period | 2026-2034 |
| Historical Period | 2020-2025 |
| Growth Rate | CAGR of 4.09% from 2020-2034 |
| Segmentation |
|
Table of Contents
- 1. Introduction
- 1.1. Research Scope
- 1.2. Market Segmentation
- 1.3. Research Objective
- 1.4. Definitions and Assumptions
- 2. Executive Summary
- 2.1. Market Snapshot
- 3. Market Dynamics
- 3.1. Market Drivers
- 3.2. Market Restrains
- 3.3. Market Trends
- 3.4. Market Opportunities
- 4. Market Factor Analysis
- 4.1. Porters Five Forces
- 4.1.1. Bargaining Power of Suppliers
- 4.1.2. Bargaining Power of Buyers
- 4.1.3. Threat of New Entrants
- 4.1.4. Threat of Substitutes
- 4.1.5. Competitive Rivalry
- 4.2. PESTEL analysis
- 4.3. BCG Analysis
- 4.3.1. Stars (High Growth, High Market Share)
- 4.3.2. Cash Cows (Low Growth, High Market Share)
- 4.3.3. Question Mark (High Growth, Low Market Share)
- 4.3.4. Dogs (Low Growth, Low Market Share)
- 4.4. Ansoff Matrix Analysis
- 4.5. Supply Chain Analysis
- 4.6. Regulatory Landscape
- 4.7. Current Market Potential and Opportunity Assessment (TAM–SAM–SOM Framework)
- 4.8. VDR Analyst Note
- 4.1. Porters Five Forces
- 5. Market Analysis, Insights and Forecast 2021-2033
- 5.1. Market Analysis, Insights and Forecast - by Size
- 5.1.1. Size 1
- 5.1.2. Size 2
- 5.1.3. Size 3
- 5.1.4. Size 4
- 5.1.5. Size 5
- 5.2. Market Analysis, Insights and Forecast - by Distribution Channel
- 5.2.1. Specialty Stores
- 5.2.2. Supermarkets and Hypermarkets
- 5.2.3. Online Stores
- 5.2.4. Other Distribution Channels
- 5.3. Market Analysis, Insights and Forecast - by Region
- 5.3.1. North America
- 5.3.2. Europe
- 5.3.3. Asia Pacific
- 5.3.4. South America
- 5.3.5. Middle East and Africa
- 5.1. Market Analysis, Insights and Forecast - by Size
- 6. Global Football Industry Analysis, Insights and Forecast, 2021-2033
- 6.1. Market Analysis, Insights and Forecast - by Size
- 6.1.1. Size 1
- 6.1.2. Size 2
- 6.1.3. Size 3
- 6.1.4. Size 4
- 6.1.5. Size 5
- 6.2. Market Analysis, Insights and Forecast - by Distribution Channel
- 6.2.1. Specialty Stores
- 6.2.2. Supermarkets and Hypermarkets
- 6.2.3. Online Stores
- 6.2.4. Other Distribution Channels
- 6.1. Market Analysis, Insights and Forecast - by Size
- 7. North America Football Industry Analysis, Insights and Forecast, 2021-2033
- 7.1. Market Analysis, Insights and Forecast - by Size
- 7.1.1. Size 1
- 7.1.2. Size 2
- 7.1.3. Size 3
- 7.1.4. Size 4
- 7.1.5. Size 5
- 7.2. Market Analysis, Insights and Forecast - by Distribution Channel
- 7.2.1. Specialty Stores
- 7.2.2. Supermarkets and Hypermarkets
- 7.2.3. Online Stores
- 7.2.4. Other Distribution Channels
- 7.1. Market Analysis, Insights and Forecast - by Size
- 8. Europe Football Industry Analysis, Insights and Forecast, 2021-2033
- 8.1. Market Analysis, Insights and Forecast - by Size
- 8.1.1. Size 1
- 8.1.2. Size 2
- 8.1.3. Size 3
- 8.1.4. Size 4
- 8.1.5. Size 5
- 8.2. Market Analysis, Insights and Forecast - by Distribution Channel
- 8.2.1. Specialty Stores
- 8.2.2. Supermarkets and Hypermarkets
- 8.2.3. Online Stores
- 8.2.4. Other Distribution Channels
- 8.1. Market Analysis, Insights and Forecast - by Size
- 9. Asia Pacific Football Industry Analysis, Insights and Forecast, 2021-2033
- 9.1. Market Analysis, Insights and Forecast - by Size
- 9.1.1. Size 1
- 9.1.2. Size 2
- 9.1.3. Size 3
- 9.1.4. Size 4
- 9.1.5. Size 5
- 9.2. Market Analysis, Insights and Forecast - by Distribution Channel
- 9.2.1. Specialty Stores
- 9.2.2. Supermarkets and Hypermarkets
- 9.2.3. Online Stores
- 9.2.4. Other Distribution Channels
- 9.1. Market Analysis, Insights and Forecast - by Size
- 10. South America Football Industry Analysis, Insights and Forecast, 2021-2033
- 10.1. Market Analysis, Insights and Forecast - by Size
- 10.1.1. Size 1
- 10.1.2. Size 2
- 10.1.3. Size 3
- 10.1.4. Size 4
- 10.1.5. Size 5
- 10.2. Market Analysis, Insights and Forecast - by Distribution Channel
- 10.2.1. Specialty Stores
- 10.2.2. Supermarkets and Hypermarkets
- 10.2.3. Online Stores
- 10.2.4. Other Distribution Channels
- 10.1. Market Analysis, Insights and Forecast - by Size
- 11. Middle East and Africa Football Industry Analysis, Insights and Forecast, 2021-2033
- 11.1. Market Analysis, Insights and Forecast - by Size
- 11.1.1. Size 1
- 11.1.2. Size 2
- 11.1.3. Size 3
- 11.1.4. Size 4
- 11.1.5. Size 5
- 11.2. Market Analysis, Insights and Forecast - by Distribution Channel
- 11.2.1. Specialty Stores
- 11.2.2. Supermarkets and Hypermarkets
- 11.2.3. Online Stores
- 11.2.4. Other Distribution Channels
- 11.1. Market Analysis, Insights and Forecast - by Size
- 12. Competitive Analysis
- 12.1. Company Profiles
- 12.1.1 Adidas AG
- 12.1.1.1. Company Overview
- 12.1.1.2. Products
- 12.1.1.3. Company Financials
- 12.1.1.4. SWOT Analysis
- 12.1.2 Baden Sports
- 12.1.2.1. Company Overview
- 12.1.2.2. Products
- 12.1.2.3. Company Financials
- 12.1.2.4. SWOT Analysis
- 12.1.3 Wilson Sporting Goods*List Not Exhaustive
- 12.1.3.1. Company Overview
- 12.1.3.2. Products
- 12.1.3.3. Company Financials
- 12.1.3.4. SWOT Analysis
- 12.1.4 Cambuci SA (Penalty)
- 12.1.4.1. Company Overview
- 12.1.4.2. Products
- 12.1.4.3. Company Financials
- 12.1.4.4. SWOT Analysis
- 12.1.5 Puma SE
- 12.1.5.1. Company Overview
- 12.1.5.2. Products
- 12.1.5.3. Company Financials
- 12.1.5.4. SWOT Analysis
- 12.1.6 Decathlon Sports Pvt Ltd
- 12.1.6.1. Company Overview
- 12.1.6.2. Products
- 12.1.6.3. Company Financials
- 12.1.6.4. SWOT Analysis
- 12.1.7 Mitre International
- 12.1.7.1. Company Overview
- 12.1.7.2. Products
- 12.1.7.3. Company Financials
- 12.1.7.4. SWOT Analysis
- 12.1.8 Umbro
- 12.1.8.1. Company Overview
- 12.1.8.2. Products
- 12.1.8.3. Company Financials
- 12.1.8.4. SWOT Analysis
- 12.1.9 Nike Inc
- 12.1.9.1. Company Overview
- 12.1.9.2. Products
- 12.1.9.3. Company Financials
- 12.1.9.4. SWOT Analysis
- 12.1.10 Select Sport AS
- 12.1.10.1. Company Overview
- 12.1.10.2. Products
- 12.1.10.3. Company Financials
- 12.1.10.4. SWOT Analysis
- 12.1.1 Adidas AG
- 12.2. Market Entropy
- 12.2.1 Company's Key Areas Served
- 12.2.2 Recent Developments
- 12.3. Company Market Share Analysis 2025
- 12.3.1 Top 5 Companies Market Share Analysis
- 12.3.2 Top 3 Companies Market Share Analysis
- 12.4. List of Potential Customers
- 13. Research Methodology
List of Figures
- Figure 1: Global Football Industry Revenue Breakdown (Million, %) by Region 2025 & 2033
- Figure 2: North America Football Industry Revenue (Million), by Size 2025 & 2033
- Figure 3: North America Football Industry Revenue Share (%), by Size 2025 & 2033
- Figure 4: North America Football Industry Revenue (Million), by Distribution Channel 2025 & 2033
- Figure 5: North America Football Industry Revenue Share (%), by Distribution Channel 2025 & 2033
- Figure 6: North America Football Industry Revenue (Million), by Country 2025 & 2033
- Figure 7: North America Football Industry Revenue Share (%), by Country 2025 & 2033
- Figure 8: Europe Football Industry Revenue (Million), by Size 2025 & 2033
- Figure 9: Europe Football Industry Revenue Share (%), by Size 2025 & 2033
- Figure 10: Europe Football Industry Revenue (Million), by Distribution Channel 2025 & 2033
- Figure 11: Europe Football Industry Revenue Share (%), by Distribution Channel 2025 & 2033
- Figure 12: Europe Football Industry Revenue (Million), by Country 2025 & 2033
- Figure 13: Europe Football Industry Revenue Share (%), by Country 2025 & 2033
- Figure 14: Asia Pacific Football Industry Revenue (Million), by Size 2025 & 2033
- Figure 15: Asia Pacific Football Industry Revenue Share (%), by Size 2025 & 2033
- Figure 16: Asia Pacific Football Industry Revenue (Million), by Distribution Channel 2025 & 2033
- Figure 17: Asia Pacific Football Industry Revenue Share (%), by Distribution Channel 2025 & 2033
- Figure 18: Asia Pacific Football Industry Revenue (Million), by Country 2025 & 2033
- Figure 19: Asia Pacific Football Industry Revenue Share (%), by Country 2025 & 2033
- Figure 20: South America Football Industry Revenue (Million), by Size 2025 & 2033
- Figure 21: South America Football Industry Revenue Share (%), by Size 2025 & 2033
- Figure 22: South America Football Industry Revenue (Million), by Distribution Channel 2025 & 2033
- Figure 23: South America Football Industry Revenue Share (%), by Distribution Channel 2025 & 2033
- Figure 24: South America Football Industry Revenue (Million), by Country 2025 & 2033
- Figure 25: South America Football Industry Revenue Share (%), by Country 2025 & 2033
- Figure 26: Middle East and Africa Football Industry Revenue (Million), by Size 2025 & 2033
- Figure 27: Middle East and Africa Football Industry Revenue Share (%), by Size 2025 & 2033
- Figure 28: Middle East and Africa Football Industry Revenue (Million), by Distribution Channel 2025 & 2033
- Figure 29: Middle East and Africa Football Industry Revenue Share (%), by Distribution Channel 2025 & 2033
- Figure 30: Middle East and Africa Football Industry Revenue (Million), by Country 2025 & 2033
- Figure 31: Middle East and Africa Football Industry Revenue Share (%), by Country 2025 & 2033
List of Tables
- Table 1: Global Football Industry Revenue Million Forecast, by Size 2020 & 2033
- Table 2: Global Football Industry Revenue Million Forecast, by Distribution Channel 2020 & 2033
- Table 3: Global Football Industry Revenue Million Forecast, by Region 2020 & 2033
- Table 4: Global Football Industry Revenue Million Forecast, by Size 2020 & 2033
- Table 5: Global Football Industry Revenue Million Forecast, by Distribution Channel 2020 & 2033
- Table 6: Global Football Industry Revenue Million Forecast, by Country 2020 & 2033
- Table 7: United States Football Industry Revenue (Million) Forecast, by Application 2020 & 2033
- Table 8: Canada Football Industry Revenue (Million) Forecast, by Application 2020 & 2033
- Table 9: Mexico Football Industry Revenue (Million) Forecast, by Application 2020 & 2033
- Table 10: Rest of North America Football Industry Revenue (Million) Forecast, by Application 2020 & 2033
- Table 11: Global Football Industry Revenue Million Forecast, by Size 2020 & 2033
- Table 12: Global Football Industry Revenue Million Forecast, by Distribution Channel 2020 & 2033
- Table 13: Global Football Industry Revenue Million Forecast, by Country 2020 & 2033
- Table 14: Germany Football Industry Revenue (Million) Forecast, by Application 2020 & 2033
- Table 15: United Kingdom Football Industry Revenue (Million) Forecast, by Application 2020 & 2033
- Table 16: France Football Industry Revenue (Million) Forecast, by Application 2020 & 2033
- Table 17: Spain Football Industry Revenue (Million) Forecast, by Application 2020 & 2033
- Table 18: Italy Football Industry Revenue (Million) Forecast, by Application 2020 & 2033
- Table 19: Russia Football Industry Revenue (Million) Forecast, by Application 2020 & 2033
- Table 20: Rest of Europe Football Industry Revenue (Million) Forecast, by Application 2020 & 2033
- Table 21: Global Football Industry Revenue Million Forecast, by Size 2020 & 2033
- Table 22: Global Football Industry Revenue Million Forecast, by Distribution Channel 2020 & 2033
- Table 23: Global Football Industry Revenue Million Forecast, by Country 2020 & 2033
- Table 24: China Football Industry Revenue (Million) Forecast, by Application 2020 & 2033
- Table 25: Japan Football Industry Revenue (Million) Forecast, by Application 2020 & 2033
- Table 26: India Football Industry Revenue (Million) Forecast, by Application 2020 & 2033
- Table 27: Australia Football Industry Revenue (Million) Forecast, by Application 2020 & 2033
- Table 28: Rest of Asia Pacific Football Industry Revenue (Million) Forecast, by Application 2020 & 2033
- Table 29: Global Football Industry Revenue Million Forecast, by Size 2020 & 2033
- Table 30: Global Football Industry Revenue Million Forecast, by Distribution Channel 2020 & 2033
- Table 31: Global Football Industry Revenue Million Forecast, by Country 2020 & 2033
- Table 32: Brazil Football Industry Revenue (Million) Forecast, by Application 2020 & 2033
- Table 33: Argentina Football Industry Revenue (Million) Forecast, by Application 2020 & 2033
- Table 34: Rest of South America Football Industry Revenue (Million) Forecast, by Application 2020 & 2033
- Table 35: Global Football Industry Revenue Million Forecast, by Size 2020 & 2033
- Table 36: Global Football Industry Revenue Million Forecast, by Distribution Channel 2020 & 2033
- Table 37: Global Football Industry Revenue Million Forecast, by Country 2020 & 2033
- Table 38: South Africa Football Industry Revenue (Million) Forecast, by Application 2020 & 2033
- Table 39: Saudi Arabia Football Industry Revenue (Million) Forecast, by Application 2020 & 2033
- Table 40: Rest of Middle East and Africa Football Industry Revenue (Million) Forecast, by Application 2020 & 2033
Frequently Asked Questions
1. What is the projected Compound Annual Growth Rate (CAGR) of the Football Industry?
The projected CAGR is approximately 4.09%.
2. Which companies are prominent players in the Football Industry?
Key companies in the market include Adidas AG, Baden Sports, Wilson Sporting Goods*List Not Exhaustive, Cambuci SA (Penalty), Puma SE, Decathlon Sports Pvt Ltd, Mitre International, Umbro, Nike Inc, Select Sport AS.
3. What are the main segments of the Football Industry?
The market segments include Size, Distribution Channel.
4. Can you provide details about the market size?
The market size is estimated to be USD 741.45 Million as of 2022.
5. What are some drivers contributing to market growth?
The Rise of Athleisure; Influence of Social Media.
6. What are the notable trends driving market growth?
Rising Active Participation in Football Leagues.
7. Are there any restraints impacting market growth?
Presence of Counterfeit Products.
8. Can you provide examples of recent developments in the market?
In October 2022, Nike launched a new High Visibility Premier League ball for the season 2022-23. The new winter ball provides increased visibility with the same Aerowsculpt technology as the regular Premier League 2022-23 ball.
9. What pricing options are available for accessing the report?
Pricing options include single-user, multi-user, and enterprise licenses priced at USD 4750, USD 5250, and USD 8750 respectively.
10. Is the market size provided in terms of value or volume?
The market size is provided in terms of value, measured in Million.
11. Are there any specific market keywords associated with the report?
Yes, the market keyword associated with the report is "Football Industry," which aids in identifying and referencing the specific market segment covered.
12. How do I determine which pricing option suits my needs best?
The pricing options vary based on user requirements and access needs. Individual users may opt for single-user licenses, while businesses requiring broader access may choose multi-user or enterprise licenses for cost-effective access to the report.
13. Are there any additional resources or data provided in the Football Industry report?
While the report offers comprehensive insights, it's advisable to review the specific contents or supplementary materials provided to ascertain if additional resources or data are available.
14. How can I stay updated on further developments or reports in the Football Industry?
To stay informed about further developments, trends, and reports in the Football Industry, consider subscribing to industry newsletters, following relevant companies and organizations, or regularly checking reputable industry news sources and publications.
Methodology
Step 1 - Identification of Relevant Samples Size from Population Database


Step 2 - Approaches for Defining Global Market Size (Value, Volume* & Price*)

Note*: In applicable scenarios
Step 3 - Data Sources
Primary Research
- Web Analytics
- Survey Reports
- Research Institute
- Latest Research Reports
- Opinion Leaders
Secondary Research
- Annual Reports
- White Paper
- Latest Press Release
- Industry Association
- Paid Database
- Investor Presentations

Step 4 - Data Triangulation
Involves using different sources of information in order to increase the validity of a study
These sources are likely to be stakeholders in a program - participants, other researchers, program staff, other community members, and so on.
Then we put all data in single framework & apply various statistical tools to find out the dynamic on the market.
During the analysis stage, feedback from the stakeholder groups would be compared to determine areas of agreement as well as areas of divergence