

Key Insights
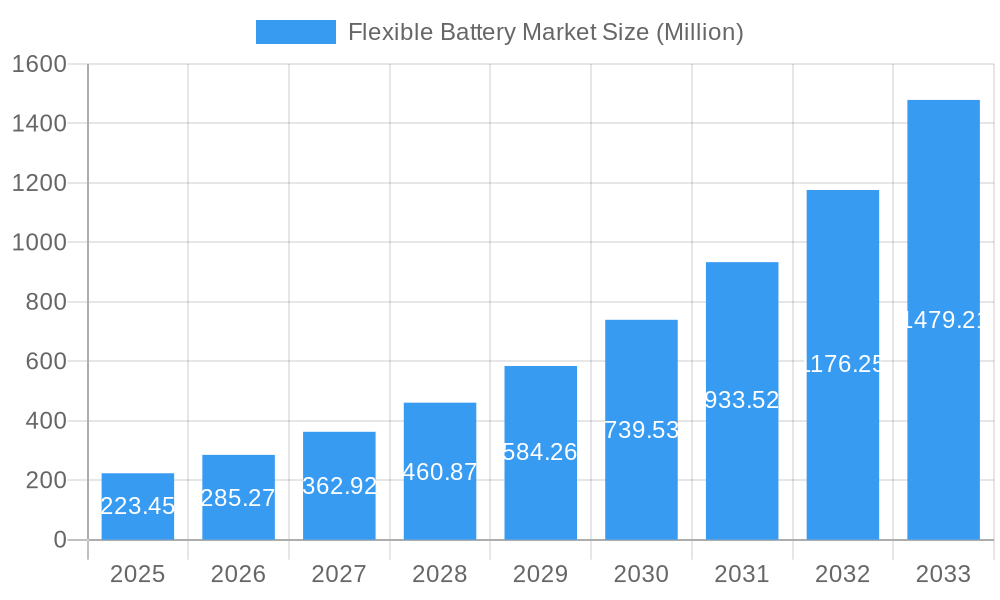
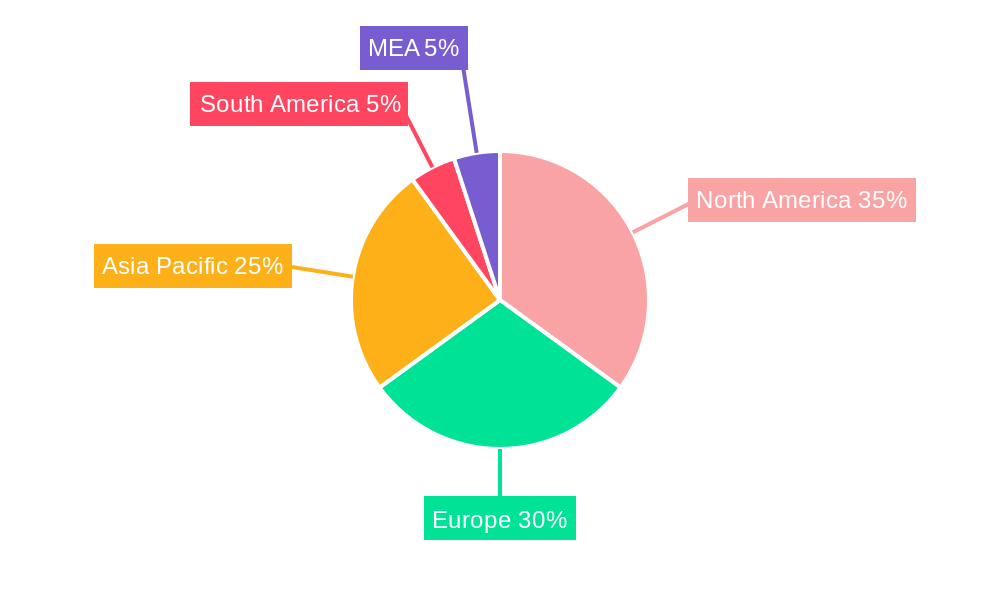
The flexible battery market is experiencing robust growth, projected to reach \$223.45 million in 2025 and exhibiting a remarkable Compound Annual Growth Rate (CAGR) of 27.70% from 2025 to 2033. This expansion is driven by the increasing demand for miniaturized and power-efficient energy storage solutions across diverse sectors. The rising adoption of flexible batteries in consumer electronics, particularly wearables and foldable devices, is a major catalyst. Furthermore, the burgeoning medical device industry, with its need for implantable and flexible power sources, significantly contributes to market growth. The integration of flexible batteries into smart packaging and smart cards offers further avenues for expansion, enabling innovative functionalities and enhanced product lifecycles. Technological advancements in thin-film and printed battery technologies are enhancing performance and reducing costs, further fueling market expansion. While challenges related to production scalability and long-term durability persist, ongoing research and development efforts are steadily addressing these limitations. Geographic distribution reveals a strong presence across North America and Europe, driven by established technological infrastructure and high consumer adoption. However, the Asia-Pacific region presents significant growth potential due to its expanding electronics manufacturing base and rising disposable incomes.
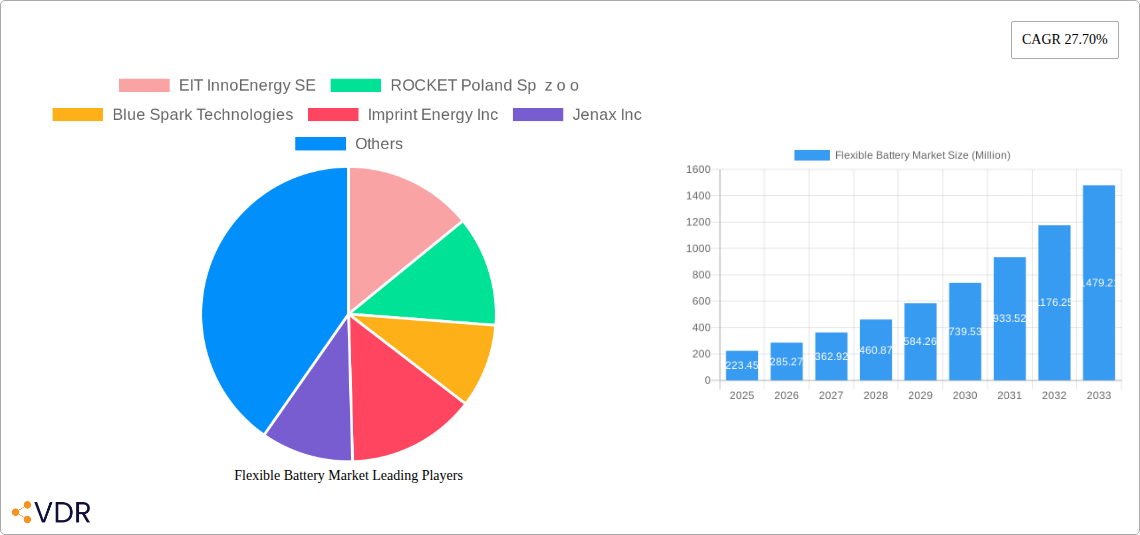
Flexible Battery Market Market Size (In Million)
The competitive landscape is characterized by a mix of established players and innovative startups. Companies like Panasonic Corporation leverage their extensive experience in battery technology, while smaller firms like Imprint Energy and Jenax are pushing the boundaries of flexible battery design and manufacturing. Strategic partnerships and collaborations are becoming increasingly crucial for market players seeking to accelerate innovation and access broader distribution channels. The continued miniaturization of electronics and the rise of the Internet of Things (IoT) are expected to further propel demand for flexible batteries in the coming years. This will likely increase the demand for more specialized applications, creating opportunities for niche players who specialize in specific applications or battery technologies. The market will likely witness a growing emphasis on sustainable and environmentally friendly manufacturing processes to meet increasing consumer and regulatory demands for responsible production.
Flexible Battery Market Company Market Share
Flexible Battery Market: A Comprehensive Market Report (2019-2033)
This comprehensive report provides an in-depth analysis of the flexible battery market, encompassing market dynamics, growth trends, regional segmentation, product landscape, key players, and future outlook. With a study period spanning 2019-2033, a base year of 2025, and a forecast period of 2025-2033, this report is an invaluable resource for industry professionals, investors, and researchers seeking to understand and capitalize on the opportunities within this rapidly evolving market. The report's detailed analysis includes both parent markets (energy storage solutions) and child markets (specific applications like consumer electronics and medical devices), ensuring a holistic understanding of the market landscape. Expected market size in Million units for 2025 is xx.
Flexible Battery Market Market Dynamics & Structure
The flexible battery market is characterized by a moderately concentrated landscape, with key players vying for market share through innovation and strategic partnerships. Technological advancements, particularly in thin-film and printed battery technologies, are driving market growth. Regulatory frameworks, focused on safety and environmental concerns, influence product development and market access. Competitive substitutes, such as traditional rigid batteries, continue to exist, though the advantages of flexibility are increasingly driving adoption. End-user demographics are diversifying, with increasing demand from consumer electronics, medical devices, and smart packaging sectors. M&A activity is expected to increase as larger players seek to expand their market reach and acquire specialized technologies.
- Market Concentration: Moderately concentrated, with top 5 players holding approximately xx% market share in 2025.
- Technological Innovation Drivers: Advancements in materials science, printing techniques, and energy density are key drivers.
- Regulatory Frameworks: Safety standards and environmental regulations influence product design and manufacturing processes.
- Competitive Product Substitutes: Traditional rigid batteries pose competition, but the advantages of flexibility are creating a shift.
- End-User Demographics: Growing adoption across diverse sectors, including consumer electronics, medical devices, and wearables.
- M&A Trends: An increasing number of mergers and acquisitions are anticipated in the forecast period, with xx deals expected between 2025 and 2033.
Flexible Battery Market Growth Trends & Insights
The flexible battery market is poised for robust expansion, propelled by the burgeoning demand for portable, adaptable, and innovative electronic devices. Industry projections indicate a substantial Compound Annual Growth Rate (CAGR) of [Insert Specific CAGR Here, e.g., 18.5%] during the forecast period of 2025-2033, with the market size anticipated to reach [Insert Specific Market Size in Millions/Billions Here] by 2033. This accelerated growth trajectory is a direct consequence of significant technological breakthroughs. Innovations such as high-capacity, ultra-thin-film batteries and advanced printed battery technologies are enabling the creation of devices that are not only smaller and lighter but also offer unprecedented levels of flexibility. Complementing these technological advancements, a fundamental shift in consumer behavior towards increasingly mobile-centric and interconnected lifestyles is further amplifying market adoption. The market penetration rate for flexible batteries is expected to climb from an estimated [Insert Specific Penetration Rate in 2025 Here, e.g., 12%] in 2025 to a significant [Insert Specific Penetration Rate by 2033 Here, e.g., 35%] by 2033. Ongoing research and development are continuously enhancing battery safety features and overall performance, making them a more viable and attractive power source for a wider array of applications.
Dominant Regions, Countries, or Segments in Flexible Battery Market
The Asia-Pacific region is projected to emerge as the leading powerhouse in the flexible battery market throughout the forecast period. This dominance will be underpinned by the region's insatiable demand from the consumer electronics sector and the presence of established, cutting-edge manufacturing hubs. North America and Europe are also expected to witness considerable growth, driven by the expanding adoption of flexible batteries in critical sectors such as advanced medical devices and innovative smart packaging solutions.
- Dominant Segment (Type): Thin-Film Batteries are anticipated to command the largest market share, owing to their superior energy density, seamless integration capabilities, and excellent scalability for mass production.
- Dominant Segment (Application): Consumer Electronics will continue to be the largest application segment, with Medical Devices following closely and exhibiting rapid growth due to the increasing need for miniaturized and wearable health monitoring solutions.
- Key Drivers (Asia-Pacific): A robust and advanced manufacturing infrastructure, exceptionally high consumer electronics demand, and proactive government policies providing incentives for innovation and production.
- Key Drivers (North America): A rapidly expanding medical device market, high disposable incomes among consumers, and a pronounced trend towards the adoption of sophisticated wearable technology.
- Key Drivers (Europe): A strong commitment to developing and adopting sustainable technologies, coupled with stringent environmental regulations that actively encourage and necessitate the development of innovative and eco-friendly battery solutions.
Flexible Battery Market Product Landscape
The flexible battery market offers a diverse range of products, including thin-film batteries, printed batteries, and fabric-based batteries. These products are designed for various applications, leveraging their unique flexibility and form factors. Recent innovations focus on enhancing energy density, improving safety features, and extending lifespan. Key selling propositions include improved portability, conformability to complex shapes, and seamless integration into wearable devices.
Key Drivers, Barriers & Challenges in Flexible Battery Market
Key Drivers:
- The accelerating demand for flexible and integrated electronics across a multitude of industries, including wearables, IoT devices, and medical implants.
- Continuous technological advancements that are consistently improving battery performance, energy density, flexibility, and overall safety features.
- The pervasive and growing adoption of wearable technology and the proliferation of Internet of Things (IoT) devices, which necessitate compact and flexible power sources.
- The increasing trend towards miniaturization and custom form factors in electronic product design.
Challenges:
- Manufacturing Costs: Flexible batteries often incur higher manufacturing costs compared to their traditional, rigid counterparts, impacting initial adoption and pricing strategies.
- Performance Limitations: While rapidly improving, some flexible battery technologies may still face limitations in terms of lifespan and overall energy capacity when compared to certain established rigid battery architectures.
- Safety and Regulatory Hurdles: Ensuring consistent safety standards and navigating complex regulatory compliance for novel battery chemistries and form factors can be challenging.
- Supply Chain Volatility: Dependencies on specific raw materials and the potential for disruptions in global supply chains can impact the consistent availability and cost of key components.
- Scalability of Production: Achieving cost-effective, high-volume manufacturing for certain flexible battery technologies remains an ongoing area of development.
Emerging Opportunities in Flexible Battery Market
Emerging opportunities lie in the development of flexible batteries for next-generation wearable devices, implantable medical devices, and smart packaging. Untapped markets include flexible energy storage solutions for the automotive and aerospace industries. The increasing consumer preference for sustainable and eco-friendly products presents opportunities for biodegradable and recyclable flexible batteries.
Growth Accelerators in the Flexible Battery Market Industry
Technological breakthroughs in materials science and manufacturing processes are driving long-term growth. Strategic partnerships between battery manufacturers and technology companies are fostering innovation and accelerating market adoption. Expansion into new application areas, such as flexible solar cells and energy harvesting, will further contribute to market expansion.
Key Players Shaping the Flexible Battery Market Market
- EIT InnoEnergy SE
- ROCKET Poland Sp z o o
- Blue Spark Technologies
- Imprint Energy Inc
- Jenax Inc
- Molex
- BrightVolt Inc
- Energy Diagnostics Limited
- Enfucell OY Ltd
- Panasonic Corporation
- LG Chem
- Samsung SDI
- Winston Global Energy Co., Ltd.
- SANYO Energy (a subsidiary of Panasonic)
Notable Milestones in Flexible Battery Market Sector
- July 2023: Researchers at the University of Houston developed a fully stretchable fabric-based lithium-ion battery, paving the way for flexible wearable electronics.
- August 2023: Researchers at Nanyang Technological University developed a flexible battery as thin as a human cornea, potentially revolutionizing smart contact lenses.
In-Depth Flexible Battery Market Market Outlook
The flexible battery market is on the cusp of transformative growth, driven by relentless technological innovation and the ever-expanding spectrum of applications across diverse sectors. Strategic alliances and collaborations will be pivotal in accelerating product development and market penetration. Focused research and development efforts, particularly in areas like solid-state flexible batteries and advanced materials, will unlock new possibilities for energy storage. The escalating demand for portable, customizable, and aesthetically integrated power solutions will continue to be a primary market accelerator. Significant opportunities lie ahead for companies that can innovate to create specialized products tailored for niche applications, such as flexible displays, smart textiles, and bio-integrated electronics. Furthermore, a paramount focus on sustainable manufacturing practices and the utilization of eco-friendly materials will be crucial for long-term success and for meeting the evolving environmental consciousness of both consumers and regulatory bodies.
Flexible Battery Market Segmentation
-
1. Type
- 1.1. Thin-Film Batteries
- 1.2. Printed Batteries
-
2. Application
- 2.1. Consumer Electronics
- 2.2. Medical Devices
- 2.3. Smart Packaging
- 2.4. Smart Cards
- 2.5. Other Applications
Flexible Battery Market Segmentation By Geography
-
1. North America
- 1.1. United States
- 1.2. Canada
- 1.3. Rest of North America
-
2. Europe
- 2.1. Germany
- 2.2. France
- 2.3. United Kingdom
- 2.4. Italy
- 2.5. Spain
- 2.6. NORDIC
- 2.7. Turkey
- 2.8. Russia
- 2.9. Rest of Europe
-
3. Asia Pacific
- 3.1. China
- 3.2. India
- 3.3. Japan
- 3.4. South Korea
- 3.5. Malaysia
- 3.6. Thailand
- 3.7. Indonesia
- 3.8. Vietnam
- 3.9. Rest of Asia Pacific
-
4. Middle East and Africa
- 4.1. Saudi Arabia
- 4.2. UAE
- 4.3. South Africa
- 4.4. Qatar
- 4.5. Egypt
- 4.6. Nigeria
- 4.7. Rest of Middle East and Africa
-
5. South America
- 5.1. Brazil
- 5.2. Argentina
- 5.3. Colombia
- 5.4. Rest of South America
Flexible Battery Market Regional Market Share
Geographic Coverage of Flexible Battery Market
Flexible Battery Market REPORT HIGHLIGHTS
| Aspects | Details |
|---|---|
| Study Period | 2020-2034 |
| Base Year | 2025 |
| Estimated Year | 2026 |
| Forecast Period | 2026-2034 |
| Historical Period | 2020-2025 |
| Growth Rate | CAGR of 27.70% from 2020-2034 |
| Segmentation |
|
Table of Contents
- 1. Introduction
- 1.1. Research Scope
- 1.2. Market Segmentation
- 1.3. Research Objective
- 1.4. Definitions and Assumptions
- 2. Executive Summary
- 2.1. Market Snapshot
- 3. Market Dynamics
- 3.1. Market Drivers
- 3.2. Market Restrains
- 3.3. Market Trends
- 3.4. Market Opportunities
- 4. Market Factor Analysis
- 4.1. Porters Five Forces
- 4.1.1. Bargaining Power of Suppliers
- 4.1.2. Bargaining Power of Buyers
- 4.1.3. Threat of New Entrants
- 4.1.4. Threat of Substitutes
- 4.1.5. Competitive Rivalry
- 4.2. PESTEL analysis
- 4.3. BCG Analysis
- 4.3.1. Stars (High Growth, High Market Share)
- 4.3.2. Cash Cows (Low Growth, High Market Share)
- 4.3.3. Question Mark (High Growth, Low Market Share)
- 4.3.4. Dogs (Low Growth, Low Market Share)
- 4.4. Ansoff Matrix Analysis
- 4.5. Supply Chain Analysis
- 4.6. Regulatory Landscape
- 4.7. Current Market Potential and Opportunity Assessment (TAM–SAM–SOM Framework)
- 4.8. VDR Analyst Note
- 4.1. Porters Five Forces
- 5. Market Analysis, Insights and Forecast 2021-2033
- 5.1. Market Analysis, Insights and Forecast - by Type
- 5.1.1. Thin-Film Batteries
- 5.1.2. Printed Batteries
- 5.2. Market Analysis, Insights and Forecast - by Application
- 5.2.1. Consumer Electronics
- 5.2.2. Medical Devices
- 5.2.3. Smart Packaging
- 5.2.4. Smart Cards
- 5.2.5. Other Applications
- 5.3. Market Analysis, Insights and Forecast - by Region
- 5.3.1. North America
- 5.3.2. Europe
- 5.3.3. Asia Pacific
- 5.3.4. Middle East and Africa
- 5.3.5. South America
- 5.1. Market Analysis, Insights and Forecast - by Type
- 6. Global Flexible Battery Market Analysis, Insights and Forecast, 2021-2033
- 6.1. Market Analysis, Insights and Forecast - by Type
- 6.1.1. Thin-Film Batteries
- 6.1.2. Printed Batteries
- 6.2. Market Analysis, Insights and Forecast - by Application
- 6.2.1. Consumer Electronics
- 6.2.2. Medical Devices
- 6.2.3. Smart Packaging
- 6.2.4. Smart Cards
- 6.2.5. Other Applications
- 6.1. Market Analysis, Insights and Forecast - by Type
- 7. North America Flexible Battery Market Analysis, Insights and Forecast, 2021-2033
- 7.1. Market Analysis, Insights and Forecast - by Type
- 7.1.1. Thin-Film Batteries
- 7.1.2. Printed Batteries
- 7.2. Market Analysis, Insights and Forecast - by Application
- 7.2.1. Consumer Electronics
- 7.2.2. Medical Devices
- 7.2.3. Smart Packaging
- 7.2.4. Smart Cards
- 7.2.5. Other Applications
- 7.1. Market Analysis, Insights and Forecast - by Type
- 8. Europe Flexible Battery Market Analysis, Insights and Forecast, 2021-2033
- 8.1. Market Analysis, Insights and Forecast - by Type
- 8.1.1. Thin-Film Batteries
- 8.1.2. Printed Batteries
- 8.2. Market Analysis, Insights and Forecast - by Application
- 8.2.1. Consumer Electronics
- 8.2.2. Medical Devices
- 8.2.3. Smart Packaging
- 8.2.4. Smart Cards
- 8.2.5. Other Applications
- 8.1. Market Analysis, Insights and Forecast - by Type
- 9. Asia Pacific Flexible Battery Market Analysis, Insights and Forecast, 2021-2033
- 9.1. Market Analysis, Insights and Forecast - by Type
- 9.1.1. Thin-Film Batteries
- 9.1.2. Printed Batteries
- 9.2. Market Analysis, Insights and Forecast - by Application
- 9.2.1. Consumer Electronics
- 9.2.2. Medical Devices
- 9.2.3. Smart Packaging
- 9.2.4. Smart Cards
- 9.2.5. Other Applications
- 9.1. Market Analysis, Insights and Forecast - by Type
- 10. Middle East and Africa Flexible Battery Market Analysis, Insights and Forecast, 2021-2033
- 10.1. Market Analysis, Insights and Forecast - by Type
- 10.1.1. Thin-Film Batteries
- 10.1.2. Printed Batteries
- 10.2. Market Analysis, Insights and Forecast - by Application
- 10.2.1. Consumer Electronics
- 10.2.2. Medical Devices
- 10.2.3. Smart Packaging
- 10.2.4. Smart Cards
- 10.2.5. Other Applications
- 10.1. Market Analysis, Insights and Forecast - by Type
- 11. South America Flexible Battery Market Analysis, Insights and Forecast, 2021-2033
- 11.1. Market Analysis, Insights and Forecast - by Type
- 11.1.1. Thin-Film Batteries
- 11.1.2. Printed Batteries
- 11.2. Market Analysis, Insights and Forecast - by Application
- 11.2.1. Consumer Electronics
- 11.2.2. Medical Devices
- 11.2.3. Smart Packaging
- 11.2.4. Smart Cards
- 11.2.5. Other Applications
- 11.1. Market Analysis, Insights and Forecast - by Type
- 12. Competitive Analysis
- 12.1. Company Profiles
- 12.1.1 EIT InnoEnergy SE
- 12.1.1.1. Company Overview
- 12.1.1.2. Products
- 12.1.1.3. Company Financials
- 12.1.1.4. SWOT Analysis
- 12.1.2 ROCKET Poland Sp z o o
- 12.1.2.1. Company Overview
- 12.1.2.2. Products
- 12.1.2.3. Company Financials
- 12.1.2.4. SWOT Analysis
- 12.1.3 Blue Spark Technologies
- 12.1.3.1. Company Overview
- 12.1.3.2. Products
- 12.1.3.3. Company Financials
- 12.1.3.4. SWOT Analysis
- 12.1.4 Imprint Energy Inc
- 12.1.4.1. Company Overview
- 12.1.4.2. Products
- 12.1.4.3. Company Financials
- 12.1.4.4. SWOT Analysis
- 12.1.5 Jenax Inc
- 12.1.5.1. Company Overview
- 12.1.5.2. Products
- 12.1.5.3. Company Financials
- 12.1.5.4. SWOT Analysis
- 12.1.6 Molex
- 12.1.6.1. Company Overview
- 12.1.6.2. Products
- 12.1.6.3. Company Financials
- 12.1.6.4. SWOT Analysis
- 12.1.7 BrightVolt Inc
- 12.1.7.1. Company Overview
- 12.1.7.2. Products
- 12.1.7.3. Company Financials
- 12.1.7.4. SWOT Analysis
- 12.1.8 Energy Diagnostics Limited
- 12.1.8.1. Company Overview
- 12.1.8.2. Products
- 12.1.8.3. Company Financials
- 12.1.8.4. SWOT Analysis
- 12.1.9 Enfucell OY Ltd
- 12.1.9.1. Company Overview
- 12.1.9.2. Products
- 12.1.9.3. Company Financials
- 12.1.9.4. SWOT Analysis
- 12.1.10 Panasonic Corporation
- 12.1.10.1. Company Overview
- 12.1.10.2. Products
- 12.1.10.3. Company Financials
- 12.1.10.4. SWOT Analysis
- 12.1.1 EIT InnoEnergy SE
- 12.2. Market Entropy
- 12.2.1 Company's Key Areas Served
- 12.2.2 Recent Developments
- 12.3. Company Market Share Analysis 2025
- 12.3.1 Top 5 Companies Market Share Analysis
- 12.3.2 Top 3 Companies Market Share Analysis
- 12.4. List of Potential Customers
- 13. Research Methodology
List of Figures
- Figure 1: Global Flexible Battery Market Revenue Breakdown (Million, %) by Region 2025 & 2033
- Figure 2: Global Flexible Battery Market Volume Breakdown (K Unit, %) by Region 2025 & 2033
- Figure 3: North America Flexible Battery Market Revenue (Million), by Type 2025 & 2033
- Figure 4: North America Flexible Battery Market Volume (K Unit), by Type 2025 & 2033
- Figure 5: North America Flexible Battery Market Revenue Share (%), by Type 2025 & 2033
- Figure 6: North America Flexible Battery Market Volume Share (%), by Type 2025 & 2033
- Figure 7: North America Flexible Battery Market Revenue (Million), by Application 2025 & 2033
- Figure 8: North America Flexible Battery Market Volume (K Unit), by Application 2025 & 2033
- Figure 9: North America Flexible Battery Market Revenue Share (%), by Application 2025 & 2033
- Figure 10: North America Flexible Battery Market Volume Share (%), by Application 2025 & 2033
- Figure 11: North America Flexible Battery Market Revenue (Million), by Country 2025 & 2033
- Figure 12: North America Flexible Battery Market Volume (K Unit), by Country 2025 & 2033
- Figure 13: North America Flexible Battery Market Revenue Share (%), by Country 2025 & 2033
- Figure 14: North America Flexible Battery Market Volume Share (%), by Country 2025 & 2033
- Figure 15: Europe Flexible Battery Market Revenue (Million), by Type 2025 & 2033
- Figure 16: Europe Flexible Battery Market Volume (K Unit), by Type 2025 & 2033
- Figure 17: Europe Flexible Battery Market Revenue Share (%), by Type 2025 & 2033
- Figure 18: Europe Flexible Battery Market Volume Share (%), by Type 2025 & 2033
- Figure 19: Europe Flexible Battery Market Revenue (Million), by Application 2025 & 2033
- Figure 20: Europe Flexible Battery Market Volume (K Unit), by Application 2025 & 2033
- Figure 21: Europe Flexible Battery Market Revenue Share (%), by Application 2025 & 2033
- Figure 22: Europe Flexible Battery Market Volume Share (%), by Application 2025 & 2033
- Figure 23: Europe Flexible Battery Market Revenue (Million), by Country 2025 & 2033
- Figure 24: Europe Flexible Battery Market Volume (K Unit), by Country 2025 & 2033
- Figure 25: Europe Flexible Battery Market Revenue Share (%), by Country 2025 & 2033
- Figure 26: Europe Flexible Battery Market Volume Share (%), by Country 2025 & 2033
- Figure 27: Asia Pacific Flexible Battery Market Revenue (Million), by Type 2025 & 2033
- Figure 28: Asia Pacific Flexible Battery Market Volume (K Unit), by Type 2025 & 2033
- Figure 29: Asia Pacific Flexible Battery Market Revenue Share (%), by Type 2025 & 2033
- Figure 30: Asia Pacific Flexible Battery Market Volume Share (%), by Type 2025 & 2033
- Figure 31: Asia Pacific Flexible Battery Market Revenue (Million), by Application 2025 & 2033
- Figure 32: Asia Pacific Flexible Battery Market Volume (K Unit), by Application 2025 & 2033
- Figure 33: Asia Pacific Flexible Battery Market Revenue Share (%), by Application 2025 & 2033
- Figure 34: Asia Pacific Flexible Battery Market Volume Share (%), by Application 2025 & 2033
- Figure 35: Asia Pacific Flexible Battery Market Revenue (Million), by Country 2025 & 2033
- Figure 36: Asia Pacific Flexible Battery Market Volume (K Unit), by Country 2025 & 2033
- Figure 37: Asia Pacific Flexible Battery Market Revenue Share (%), by Country 2025 & 2033
- Figure 38: Asia Pacific Flexible Battery Market Volume Share (%), by Country 2025 & 2033
- Figure 39: Middle East and Africa Flexible Battery Market Revenue (Million), by Type 2025 & 2033
- Figure 40: Middle East and Africa Flexible Battery Market Volume (K Unit), by Type 2025 & 2033
- Figure 41: Middle East and Africa Flexible Battery Market Revenue Share (%), by Type 2025 & 2033
- Figure 42: Middle East and Africa Flexible Battery Market Volume Share (%), by Type 2025 & 2033
- Figure 43: Middle East and Africa Flexible Battery Market Revenue (Million), by Application 2025 & 2033
- Figure 44: Middle East and Africa Flexible Battery Market Volume (K Unit), by Application 2025 & 2033
- Figure 45: Middle East and Africa Flexible Battery Market Revenue Share (%), by Application 2025 & 2033
- Figure 46: Middle East and Africa Flexible Battery Market Volume Share (%), by Application 2025 & 2033
- Figure 47: Middle East and Africa Flexible Battery Market Revenue (Million), by Country 2025 & 2033
- Figure 48: Middle East and Africa Flexible Battery Market Volume (K Unit), by Country 2025 & 2033
- Figure 49: Middle East and Africa Flexible Battery Market Revenue Share (%), by Country 2025 & 2033
- Figure 50: Middle East and Africa Flexible Battery Market Volume Share (%), by Country 2025 & 2033
- Figure 51: South America Flexible Battery Market Revenue (Million), by Type 2025 & 2033
- Figure 52: South America Flexible Battery Market Volume (K Unit), by Type 2025 & 2033
- Figure 53: South America Flexible Battery Market Revenue Share (%), by Type 2025 & 2033
- Figure 54: South America Flexible Battery Market Volume Share (%), by Type 2025 & 2033
- Figure 55: South America Flexible Battery Market Revenue (Million), by Application 2025 & 2033
- Figure 56: South America Flexible Battery Market Volume (K Unit), by Application 2025 & 2033
- Figure 57: South America Flexible Battery Market Revenue Share (%), by Application 2025 & 2033
- Figure 58: South America Flexible Battery Market Volume Share (%), by Application 2025 & 2033
- Figure 59: South America Flexible Battery Market Revenue (Million), by Country 2025 & 2033
- Figure 60: South America Flexible Battery Market Volume (K Unit), by Country 2025 & 2033
- Figure 61: South America Flexible Battery Market Revenue Share (%), by Country 2025 & 2033
- Figure 62: South America Flexible Battery Market Volume Share (%), by Country 2025 & 2033
List of Tables
- Table 1: Global Flexible Battery Market Revenue Million Forecast, by Type 2020 & 2033
- Table 2: Global Flexible Battery Market Volume K Unit Forecast, by Type 2020 & 2033
- Table 3: Global Flexible Battery Market Revenue Million Forecast, by Application 2020 & 2033
- Table 4: Global Flexible Battery Market Volume K Unit Forecast, by Application 2020 & 2033
- Table 5: Global Flexible Battery Market Revenue Million Forecast, by Region 2020 & 2033
- Table 6: Global Flexible Battery Market Volume K Unit Forecast, by Region 2020 & 2033
- Table 7: Global Flexible Battery Market Revenue Million Forecast, by Type 2020 & 2033
- Table 8: Global Flexible Battery Market Volume K Unit Forecast, by Type 2020 & 2033
- Table 9: Global Flexible Battery Market Revenue Million Forecast, by Application 2020 & 2033
- Table 10: Global Flexible Battery Market Volume K Unit Forecast, by Application 2020 & 2033
- Table 11: Global Flexible Battery Market Revenue Million Forecast, by Country 2020 & 2033
- Table 12: Global Flexible Battery Market Volume K Unit Forecast, by Country 2020 & 2033
- Table 13: United States Flexible Battery Market Revenue (Million) Forecast, by Application 2020 & 2033
- Table 14: United States Flexible Battery Market Volume (K Unit) Forecast, by Application 2020 & 2033
- Table 15: Canada Flexible Battery Market Revenue (Million) Forecast, by Application 2020 & 2033
- Table 16: Canada Flexible Battery Market Volume (K Unit) Forecast, by Application 2020 & 2033
- Table 17: Rest of North America Flexible Battery Market Revenue (Million) Forecast, by Application 2020 & 2033
- Table 18: Rest of North America Flexible Battery Market Volume (K Unit) Forecast, by Application 2020 & 2033
- Table 19: Global Flexible Battery Market Revenue Million Forecast, by Type 2020 & 2033
- Table 20: Global Flexible Battery Market Volume K Unit Forecast, by Type 2020 & 2033
- Table 21: Global Flexible Battery Market Revenue Million Forecast, by Application 2020 & 2033
- Table 22: Global Flexible Battery Market Volume K Unit Forecast, by Application 2020 & 2033
- Table 23: Global Flexible Battery Market Revenue Million Forecast, by Country 2020 & 2033
- Table 24: Global Flexible Battery Market Volume K Unit Forecast, by Country 2020 & 2033
- Table 25: Germany Flexible Battery Market Revenue (Million) Forecast, by Application 2020 & 2033
- Table 26: Germany Flexible Battery Market Volume (K Unit) Forecast, by Application 2020 & 2033
- Table 27: France Flexible Battery Market Revenue (Million) Forecast, by Application 2020 & 2033
- Table 28: France Flexible Battery Market Volume (K Unit) Forecast, by Application 2020 & 2033
- Table 29: United Kingdom Flexible Battery Market Revenue (Million) Forecast, by Application 2020 & 2033
- Table 30: United Kingdom Flexible Battery Market Volume (K Unit) Forecast, by Application 2020 & 2033
- Table 31: Italy Flexible Battery Market Revenue (Million) Forecast, by Application 2020 & 2033
- Table 32: Italy Flexible Battery Market Volume (K Unit) Forecast, by Application 2020 & 2033
- Table 33: Spain Flexible Battery Market Revenue (Million) Forecast, by Application 2020 & 2033
- Table 34: Spain Flexible Battery Market Volume (K Unit) Forecast, by Application 2020 & 2033
- Table 35: NORDIC Flexible Battery Market Revenue (Million) Forecast, by Application 2020 & 2033
- Table 36: NORDIC Flexible Battery Market Volume (K Unit) Forecast, by Application 2020 & 2033
- Table 37: Turkey Flexible Battery Market Revenue (Million) Forecast, by Application 2020 & 2033
- Table 38: Turkey Flexible Battery Market Volume (K Unit) Forecast, by Application 2020 & 2033
- Table 39: Russia Flexible Battery Market Revenue (Million) Forecast, by Application 2020 & 2033
- Table 40: Russia Flexible Battery Market Volume (K Unit) Forecast, by Application 2020 & 2033
- Table 41: Rest of Europe Flexible Battery Market Revenue (Million) Forecast, by Application 2020 & 2033
- Table 42: Rest of Europe Flexible Battery Market Volume (K Unit) Forecast, by Application 2020 & 2033
- Table 43: Global Flexible Battery Market Revenue Million Forecast, by Type 2020 & 2033
- Table 44: Global Flexible Battery Market Volume K Unit Forecast, by Type 2020 & 2033
- Table 45: Global Flexible Battery Market Revenue Million Forecast, by Application 2020 & 2033
- Table 46: Global Flexible Battery Market Volume K Unit Forecast, by Application 2020 & 2033
- Table 47: Global Flexible Battery Market Revenue Million Forecast, by Country 2020 & 2033
- Table 48: Global Flexible Battery Market Volume K Unit Forecast, by Country 2020 & 2033
- Table 49: China Flexible Battery Market Revenue (Million) Forecast, by Application 2020 & 2033
- Table 50: China Flexible Battery Market Volume (K Unit) Forecast, by Application 2020 & 2033
- Table 51: India Flexible Battery Market Revenue (Million) Forecast, by Application 2020 & 2033
- Table 52: India Flexible Battery Market Volume (K Unit) Forecast, by Application 2020 & 2033
- Table 53: Japan Flexible Battery Market Revenue (Million) Forecast, by Application 2020 & 2033
- Table 54: Japan Flexible Battery Market Volume (K Unit) Forecast, by Application 2020 & 2033
- Table 55: South Korea Flexible Battery Market Revenue (Million) Forecast, by Application 2020 & 2033
- Table 56: South Korea Flexible Battery Market Volume (K Unit) Forecast, by Application 2020 & 2033
- Table 57: Malaysia Flexible Battery Market Revenue (Million) Forecast, by Application 2020 & 2033
- Table 58: Malaysia Flexible Battery Market Volume (K Unit) Forecast, by Application 2020 & 2033
- Table 59: Thailand Flexible Battery Market Revenue (Million) Forecast, by Application 2020 & 2033
- Table 60: Thailand Flexible Battery Market Volume (K Unit) Forecast, by Application 2020 & 2033
- Table 61: Indonesia Flexible Battery Market Revenue (Million) Forecast, by Application 2020 & 2033
- Table 62: Indonesia Flexible Battery Market Volume (K Unit) Forecast, by Application 2020 & 2033
- Table 63: Vietnam Flexible Battery Market Revenue (Million) Forecast, by Application 2020 & 2033
- Table 64: Vietnam Flexible Battery Market Volume (K Unit) Forecast, by Application 2020 & 2033
- Table 65: Rest of Asia Pacific Flexible Battery Market Revenue (Million) Forecast, by Application 2020 & 2033
- Table 66: Rest of Asia Pacific Flexible Battery Market Volume (K Unit) Forecast, by Application 2020 & 2033
- Table 67: Global Flexible Battery Market Revenue Million Forecast, by Type 2020 & 2033
- Table 68: Global Flexible Battery Market Volume K Unit Forecast, by Type 2020 & 2033
- Table 69: Global Flexible Battery Market Revenue Million Forecast, by Application 2020 & 2033
- Table 70: Global Flexible Battery Market Volume K Unit Forecast, by Application 2020 & 2033
- Table 71: Global Flexible Battery Market Revenue Million Forecast, by Country 2020 & 2033
- Table 72: Global Flexible Battery Market Volume K Unit Forecast, by Country 2020 & 2033
- Table 73: Saudi Arabia Flexible Battery Market Revenue (Million) Forecast, by Application 2020 & 2033
- Table 74: Saudi Arabia Flexible Battery Market Volume (K Unit) Forecast, by Application 2020 & 2033
- Table 75: UAE Flexible Battery Market Revenue (Million) Forecast, by Application 2020 & 2033
- Table 76: UAE Flexible Battery Market Volume (K Unit) Forecast, by Application 2020 & 2033
- Table 77: South Africa Flexible Battery Market Revenue (Million) Forecast, by Application 2020 & 2033
- Table 78: South Africa Flexible Battery Market Volume (K Unit) Forecast, by Application 2020 & 2033
- Table 79: Qatar Flexible Battery Market Revenue (Million) Forecast, by Application 2020 & 2033
- Table 80: Qatar Flexible Battery Market Volume (K Unit) Forecast, by Application 2020 & 2033
- Table 81: Egypt Flexible Battery Market Revenue (Million) Forecast, by Application 2020 & 2033
- Table 82: Egypt Flexible Battery Market Volume (K Unit) Forecast, by Application 2020 & 2033
- Table 83: Nigeria Flexible Battery Market Revenue (Million) Forecast, by Application 2020 & 2033
- Table 84: Nigeria Flexible Battery Market Volume (K Unit) Forecast, by Application 2020 & 2033
- Table 85: Rest of Middle East and Africa Flexible Battery Market Revenue (Million) Forecast, by Application 2020 & 2033
- Table 86: Rest of Middle East and Africa Flexible Battery Market Volume (K Unit) Forecast, by Application 2020 & 2033
- Table 87: Global Flexible Battery Market Revenue Million Forecast, by Type 2020 & 2033
- Table 88: Global Flexible Battery Market Volume K Unit Forecast, by Type 2020 & 2033
- Table 89: Global Flexible Battery Market Revenue Million Forecast, by Application 2020 & 2033
- Table 90: Global Flexible Battery Market Volume K Unit Forecast, by Application 2020 & 2033
- Table 91: Global Flexible Battery Market Revenue Million Forecast, by Country 2020 & 2033
- Table 92: Global Flexible Battery Market Volume K Unit Forecast, by Country 2020 & 2033
- Table 93: Brazil Flexible Battery Market Revenue (Million) Forecast, by Application 2020 & 2033
- Table 94: Brazil Flexible Battery Market Volume (K Unit) Forecast, by Application 2020 & 2033
- Table 95: Argentina Flexible Battery Market Revenue (Million) Forecast, by Application 2020 & 2033
- Table 96: Argentina Flexible Battery Market Volume (K Unit) Forecast, by Application 2020 & 2033
- Table 97: Colombia Flexible Battery Market Revenue (Million) Forecast, by Application 2020 & 2033
- Table 98: Colombia Flexible Battery Market Volume (K Unit) Forecast, by Application 2020 & 2033
- Table 99: Rest of South America Flexible Battery Market Revenue (Million) Forecast, by Application 2020 & 2033
- Table 100: Rest of South America Flexible Battery Market Volume (K Unit) Forecast, by Application 2020 & 2033
Frequently Asked Questions
1. What is the projected Compound Annual Growth Rate (CAGR) of the Flexible Battery Market?
The projected CAGR is approximately 27.70%.
2. Which companies are prominent players in the Flexible Battery Market?
Key companies in the market include EIT InnoEnergy SE, ROCKET Poland Sp z o o, Blue Spark Technologies, Imprint Energy Inc, Jenax Inc , Molex, BrightVolt Inc, Energy Diagnostics Limited, Enfucell OY Ltd, Panasonic Corporation.
3. What are the main segments of the Flexible Battery Market?
The market segments include Type, Application.
4. Can you provide details about the market size?
The market size is estimated to be USD 223.45 Million as of 2022.
5. What are some drivers contributing to market growth?
4.; Rapid Adoption of Healthcare Wearable Devices4.; Growing Penetration of Internet of Things (IoT) Applications.
6. What are the notable trends driving market growth?
Consumer Electronics Segment will Dominate the Market.
7. Are there any restraints impacting market growth?
4.; Availability of Alternate Battery Technologies Existing for Various Applications.
8. Can you provide examples of recent developments in the market?
July 2023: Researchers from the University of Houston in the United States developed a successful prototype of a fully stretchable fabric-based lithium-ion battery. According to the researchers, the battery could lead to stretchy laptops, phones, or even interactive sensors embedded in clothes that monitor health. The new battery offers improved safety, enhanced performance, and remarkable flexibility for new applications.
9. What pricing options are available for accessing the report?
Pricing options include single-user, multi-user, and enterprise licenses priced at USD 4750, USD 5250, and USD 8750 respectively.
10. Is the market size provided in terms of value or volume?
The market size is provided in terms of value, measured in Million and volume, measured in K Unit.
11. Are there any specific market keywords associated with the report?
Yes, the market keyword associated with the report is "Flexible Battery Market," which aids in identifying and referencing the specific market segment covered.
12. How do I determine which pricing option suits my needs best?
The pricing options vary based on user requirements and access needs. Individual users may opt for single-user licenses, while businesses requiring broader access may choose multi-user or enterprise licenses for cost-effective access to the report.
13. Are there any additional resources or data provided in the Flexible Battery Market report?
While the report offers comprehensive insights, it's advisable to review the specific contents or supplementary materials provided to ascertain if additional resources or data are available.
14. How can I stay updated on further developments or reports in the Flexible Battery Market?
To stay informed about further developments, trends, and reports in the Flexible Battery Market, consider subscribing to industry newsletters, following relevant companies and organizations, or regularly checking reputable industry news sources and publications.
Methodology
Step 1 - Identification of Relevant Samples Size from Population Database


Step 2 - Approaches for Defining Global Market Size (Value, Volume* & Price*)

Note*: In applicable scenarios
Step 3 - Data Sources
Primary Research
- Web Analytics
- Survey Reports
- Research Institute
- Latest Research Reports
- Opinion Leaders
Secondary Research
- Annual Reports
- White Paper
- Latest Press Release
- Industry Association
- Paid Database
- Investor Presentations

Step 4 - Data Triangulation
Involves using different sources of information in order to increase the validity of a study
These sources are likely to be stakeholders in a program - participants, other researchers, program staff, other community members, and so on.
Then we put all data in single framework & apply various statistical tools to find out the dynamic on the market.
During the analysis stage, feedback from the stakeholder groups would be compared to determine areas of agreement as well as areas of divergence