

Key Insights
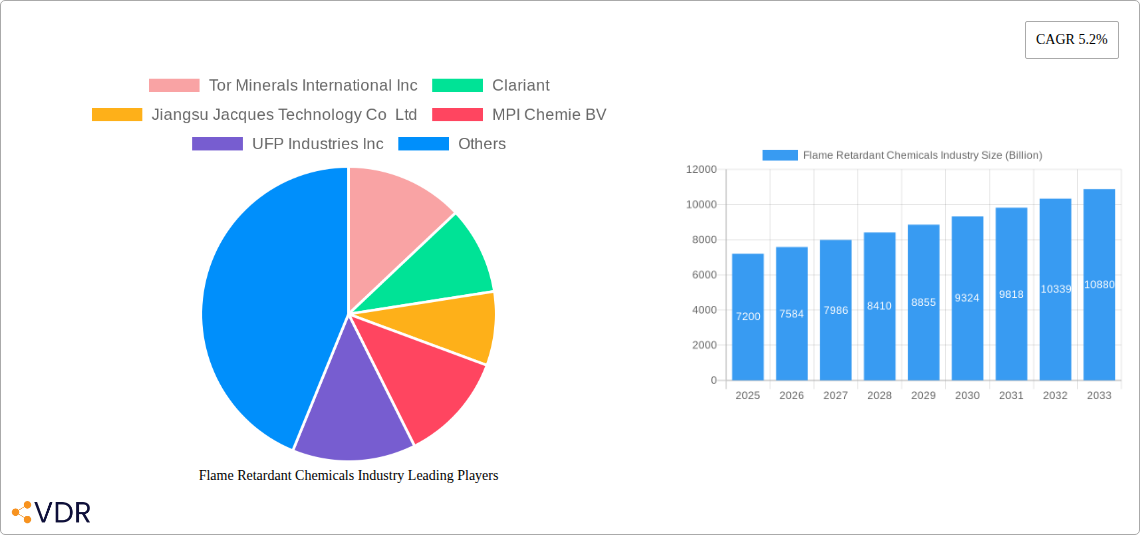
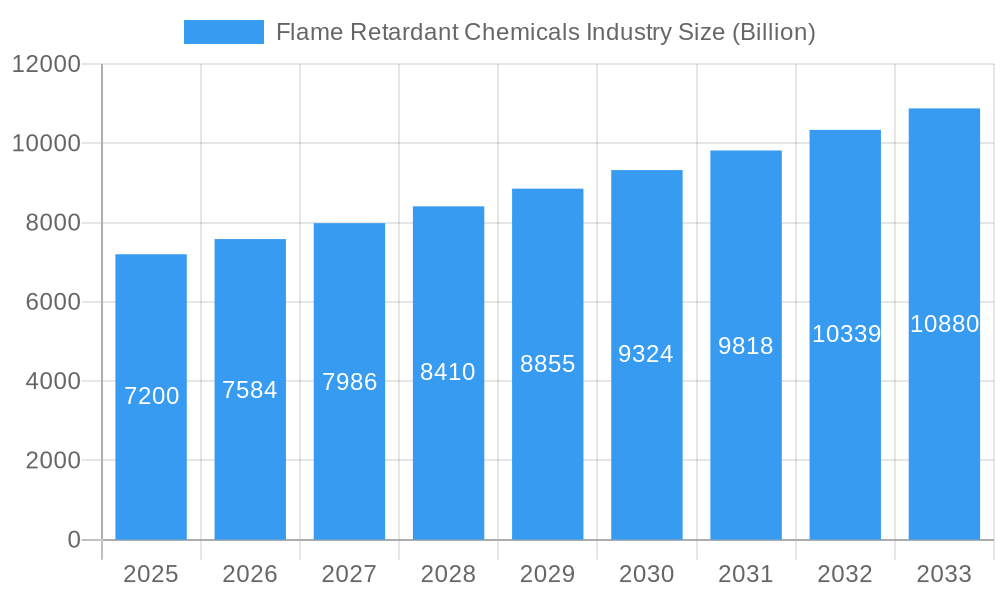
The global flame retardant chemicals market, valued at $7.2 billion in 2025, is projected to experience robust growth, driven by a compound annual growth rate (CAGR) of 5.2% from 2025 to 2033. This expansion is fueled by several key factors. The increasing demand for safety and fire protection across various end-use industries, particularly in electrical and electronics, buildings and construction, and transportation, is a primary driver. Stringent government regulations and building codes mandating the use of flame retardants in these sectors are further bolstering market growth. Furthermore, the rising adoption of advanced materials with enhanced flame-retardant properties, such as halogen-free alternatives, is shaping market trends. While the prevalence of halogenated flame retardants remains significant, environmental concerns are pushing the market towards a preference for non-halogenated options like aluminum hydroxide and magnesium hydroxide, influencing product segmentation and technological advancements within the industry.
Flame Retardant Chemicals Industry Market Size (In Billion)
However, the market also faces challenges. Fluctuations in raw material prices, particularly for metals used in inorganic flame retardants, can impact profitability. Concerns regarding the potential environmental and health implications of certain flame retardant chemicals are also leading to increased scrutiny and regulatory pressures, potentially hindering market expansion in specific regions. The competitive landscape is characterized by a mix of established multinational corporations and regional players, fostering innovation and driving price competitiveness. This dynamic environment necessitates strategic adaptation and a focus on sustainable and environmentally friendly solutions to ensure sustained growth within the flame retardant chemicals market. Future growth will depend heavily on the balance between satisfying increasing demand driven by safety requirements, and mitigating environmental and health concerns through the development and adoption of safer alternatives.
Flame Retardant Chemicals Industry Company Market Share
Flame Retardant Chemicals Industry Market Report: 2019-2033
This comprehensive report provides a detailed analysis of the Flame Retardant Chemicals industry, encompassing market dynamics, growth trends, regional insights, product landscapes, key players, and future outlook. The study period covers 2019-2033, with 2025 as the base and estimated year. The report is invaluable for industry professionals, investors, and strategic decision-makers seeking to navigate this dynamic market. The total market size is predicted to reach xx Billion by 2033.
Flame Retardant Chemicals Industry Market Dynamics & Structure
The Flame Retardant Chemicals market is characterized by a moderately concentrated landscape with several key players vying for market share. Technological innovation, driven by stricter safety regulations and evolving end-user demands, is a crucial dynamic. The market is heavily influenced by regulatory frameworks concerning the use of halogenated flame retardants, pushing the industry toward safer, non-halogenated alternatives. Competition from product substitutes, particularly in specific applications, presents a challenge. End-user demographics, particularly the growth of the electrical & electronics and construction sectors, are key growth drivers. M&A activity has been moderate, reflecting strategic consolidation and expansion efforts.
- Market Concentration: Moderately concentrated, with the top 10 players holding approximately xx% market share in 2024.
- Technological Innovation: Focus on non-halogenated and environmentally friendly alternatives is driving innovation.
- Regulatory Framework: Stringent regulations on hazardous substances significantly impact market dynamics.
- Competitive Substitutes: Bio-based and other novel flame retardants pose competitive threats in niche segments.
- M&A Trends: Strategic acquisitions and partnerships are aimed at expanding product portfolios and market reach. The number of M&A deals in the last 5 years averaged xx per year.
- Innovation Barriers: High R&D costs and stringent regulatory approvals pose challenges to innovation.
Flame Retardant Chemicals Industry Growth Trends & Insights
The Flame Retardant Chemicals market experienced steady growth from 2019 to 2024, driven by increasing demand from key end-use sectors. The market size reached xx Billion in 2024. Adoption rates of non-halogenated flame retardants are increasing due to environmental concerns. Technological disruptions, such as the development of novel flame retardant materials, are reshaping the market landscape. Shifts in consumer preferences towards sustainable and safer products are also influencing market growth. The Compound Annual Growth Rate (CAGR) from 2019 to 2024 was xx%, and is projected to reach xx% during the forecast period (2025-2033). Market penetration of non-halogenated flame retardants is expected to increase from xx% in 2024 to xx% by 2033.
Dominant Regions, Countries, or Segments in Flame Retardant Chemicals Industry
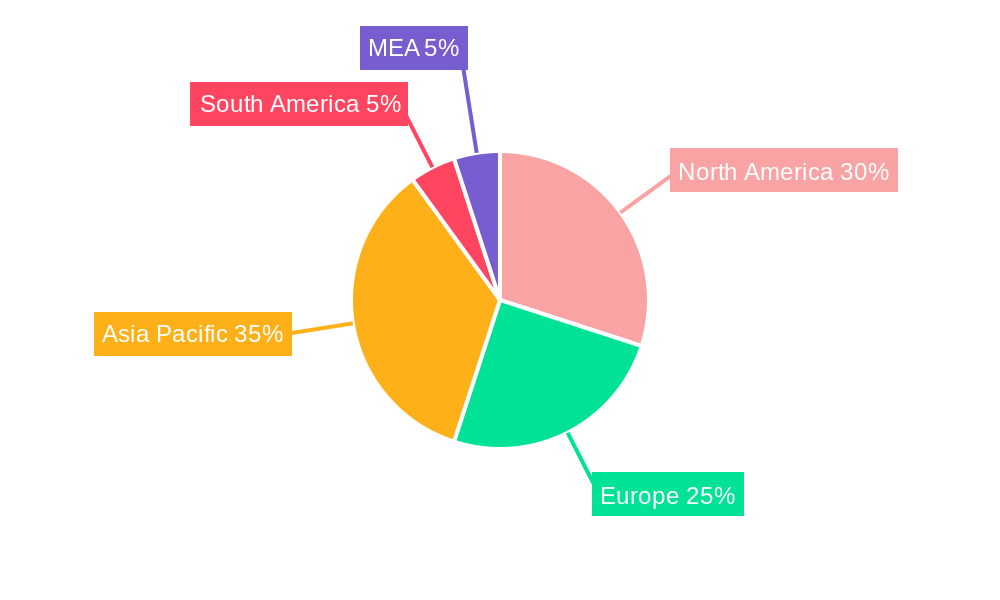
The Asia-Pacific region is currently the dominant market for flame retardant chemicals, driven by rapid industrialization, particularly in China and India. Within product types, non-halogenated flame retardants are witnessing the highest growth, reflecting the global shift towards environmentally friendly alternatives. Aluminum hydroxide and magnesium hydroxide are the leading inorganic flame retardants. The electrical and electronics sector remains the largest end-user segment, followed by the building and construction industry.
- Key Drivers in Asia-Pacific: Rapid infrastructure development, booming electronics manufacturing, and supportive government policies.
- Dominance Factors: High manufacturing capacity, lower labor costs, and increasing demand from emerging economies.
- Growth Potential: Significant potential exists in developing regions, particularly in Africa and South America.
- Market Share: The Asia-Pacific region holds approximately xx% of the global market share in 2024, with China accounting for xx%. North America holds xx%, and Europe holds xx%.
Flame Retardant Chemicals Industry Product Landscape
The flame retardant chemicals market offers a diverse range of products, including halogenated and non-halogenated options. Innovation focuses on enhancing performance characteristics, such as thermal stability, flame resistance, and processability. New product developments emphasize eco-friendly solutions and improved compatibility with various materials. Unique selling propositions include superior flame retardancy, improved processability, and enhanced durability. Technological advancements are centered around nanotechnology and the incorporation of novel chemical compounds.
Key Drivers, Barriers & Challenges in Flame Retardant Chemicals Industry
Key Drivers:
- Stringent safety regulations demanding higher flame retardancy.
- Growing demand from key end-use sectors like electronics and construction.
- Development of high-performance and eco-friendly flame retardants.
Key Challenges and Restraints:
- Volatility in raw material prices impacting profitability.
- Stringent environmental regulations and associated compliance costs.
- Intense competition from both established and emerging players. This translates to a price-sensitive market with xx% of the market driven by price competition in 2024.
Emerging Opportunities in Flame Retardant Chemicals Industry
Emerging opportunities lie in the development of bio-based and recycled flame retardants, catering to the growing demand for sustainable solutions. Untapped markets exist in developing economies, particularly in infrastructure and renewable energy applications. Innovative applications, such as flame-retardant coatings and textiles, offer significant growth potential. Evolving consumer preferences towards eco-friendly products are opening doors for sustainable flame retardant solutions.
Growth Accelerators in the Flame Retardant Chemicals Industry
Technological breakthroughs in materials science are leading to the development of more efficient and eco-friendly flame retardants. Strategic partnerships and collaborations among industry players are fostering innovation and accelerating market penetration. Expansion strategies focused on emerging markets and new applications will further propel market growth. The development of additive manufacturing techniques using flame-retardant materials will also contribute to market expansion.
Key Players Shaping the Flame Retardant Chemicals Industry Market
- Tor Minerals International Inc
- Clariant
- Jiangsu Jacques Technology Co Ltd
- MPI Chemie BV
- UFP Industries Inc
- Italmatch Chemicals SpA
- LANXESS
- Kemipex
- BASF SE
- Tosoh Corporation
- RTP Company
- Dow
- DAIHACHI CHEMICAL INDUSTRY CO LTD
- Sanwa Chemical Co Ltd
- Nabaltec AG
- Thor
- ICL Group
- DIC CORPORATION
- Shandong Brother Sci & Tech Co Ltd
- J M Huber Corporation
- Albemarle Corporation
- Nyacol Nano Technologies Inc
- Eti Maden
- Apexical Inc
- RIN KAGAKU KOGYO Co Ltd
Notable Milestones in Flame Retardant Chemicals Industry Sector
- September 2022: LANXESS launched new phosphorous-based flame retardants with enhanced thermal and mechanical stability.
- July 2022: BASF SE partnered with THOR GmBH, strengthening its non-halogenated flame retardant additive portfolio.
- April 2022: BASF launched a new flame retardant product range for the electronics industry, featuring corrosion-resistant polyphthalamides.
In-Depth Flame Retardant Chemicals Industry Market Outlook
The Flame Retardant Chemicals market is poised for robust growth, driven by ongoing technological advancements, increasing regulatory pressures, and expanding applications across various sectors. Strategic partnerships and investments in R&D will further fuel market expansion. The focus on sustainable and environmentally friendly solutions presents significant opportunities for innovative players. The market is projected to experience a CAGR of xx% from 2025 to 2033, reaching a market size of xx Billion by 2033. Companies focusing on sustainable solutions and niche applications are likely to gain a competitive edge in the years to come.
Flame Retardant Chemicals Industry Segmentation
-
1. Product Type
-
1.1. Non-halogenated Flame Retardant Chemicals
-
1.1.1. Inorganic
- 1.1.1.1. Aluminum Hydroxide
- 1.1.1.2. Magnesium Hydroxide
- 1.1.1.3. Boron Compounds
- 1.1.2. Phosphorus
- 1.1.3. Nitrogen
- 1.1.4. Other Product Types
-
1.1.1. Inorganic
-
1.2. Halogenated Flame Retardants Chemicals
- 1.2.1. Brominated Compounds
- 1.2.2. Chlorinated Compounds
-
1.1. Non-halogenated Flame Retardant Chemicals
-
2. End-user Industry
- 2.1. Electrical and Electronics
- 2.2. Buildings and Construction
- 2.3. Transportation
- 2.4. Textiles and Furniture
Flame Retardant Chemicals Industry Segmentation By Geography
-
1. Asia Pacific
- 1.1. China
- 1.2. India
- 1.3. Japan
- 1.4. South Korea
- 1.5. Australia and New Zealand
- 1.6. Rest of Asia Pacific
-
2. North America
- 2.1. United States
- 2.2. Canada
- 2.3. Mexico
- 2.4. Rest of North America
-
3. Europe
- 3.1. Germany
- 3.2. United Kingdom
- 3.3. Italy
- 3.4. France
- 3.5. Spain
- 3.6. Rest of Europe
-
4. South America
- 4.1. Brazil
- 4.2. Argentina
- 4.3. Rest of South America
- 5. Middle East
-
6. Saudi Arabia
- 6.1. South Africa
- 6.2. Qatar
- 6.3. Rest of Middle East
Flame Retardant Chemicals Industry Regional Market Share
Geographic Coverage of Flame Retardant Chemicals Industry
Flame Retardant Chemicals Industry REPORT HIGHLIGHTS
| Aspects | Details |
|---|---|
| Study Period | 2020-2034 |
| Base Year | 2025 |
| Estimated Year | 2026 |
| Forecast Period | 2026-2034 |
| Historical Period | 2020-2025 |
| Growth Rate | CAGR of 5.2% from 2020-2034 |
| Segmentation |
|
Table of Contents
- 1. Introduction
- 1.1. Research Scope
- 1.2. Market Segmentation
- 1.3. Research Objective
- 1.4. Definitions and Assumptions
- 2. Executive Summary
- 2.1. Market Snapshot
- 3. Market Dynamics
- 3.1. Market Drivers
- 3.2. Market Restrains
- 3.3. Market Trends
- 3.4. Market Opportunities
- 4. Market Factor Analysis
- 4.1. Porters Five Forces
- 4.1.1. Bargaining Power of Suppliers
- 4.1.2. Bargaining Power of Buyers
- 4.1.3. Threat of New Entrants
- 4.1.4. Threat of Substitutes
- 4.1.5. Competitive Rivalry
- 4.2. PESTEL analysis
- 4.3. BCG Analysis
- 4.3.1. Stars (High Growth, High Market Share)
- 4.3.2. Cash Cows (Low Growth, High Market Share)
- 4.3.3. Question Mark (High Growth, Low Market Share)
- 4.3.4. Dogs (Low Growth, Low Market Share)
- 4.4. Ansoff Matrix Analysis
- 4.5. Supply Chain Analysis
- 4.6. Regulatory Landscape
- 4.7. Current Market Potential and Opportunity Assessment (TAM–SAM–SOM Framework)
- 4.8. VDR Analyst Note
- 4.1. Porters Five Forces
- 5. Market Analysis, Insights and Forecast 2021-2033
- 5.1. Market Analysis, Insights and Forecast - by Product Type
- 5.1.1. Non-halogenated Flame Retardant Chemicals
- 5.1.1.1. Inorganic
- 5.1.1.1.1. Aluminum Hydroxide
- 5.1.1.1.2. Magnesium Hydroxide
- 5.1.1.1.3. Boron Compounds
- 5.1.1.2. Phosphorus
- 5.1.1.3. Nitrogen
- 5.1.1.4. Other Product Types
- 5.1.1.1. Inorganic
- 5.1.2. Halogenated Flame Retardants Chemicals
- 5.1.2.1. Brominated Compounds
- 5.1.2.2. Chlorinated Compounds
- 5.1.1. Non-halogenated Flame Retardant Chemicals
- 5.2. Market Analysis, Insights and Forecast - by End-user Industry
- 5.2.1. Electrical and Electronics
- 5.2.2. Buildings and Construction
- 5.2.3. Transportation
- 5.2.4. Textiles and Furniture
- 5.3. Market Analysis, Insights and Forecast - by Region
- 5.3.1. Asia Pacific
- 5.3.2. North America
- 5.3.3. Europe
- 5.3.4. South America
- 5.3.5. Middle East
- 5.3.6. Saudi Arabia
- 5.1. Market Analysis, Insights and Forecast - by Product Type
- 6. Global Flame Retardant Chemicals Industry Analysis, Insights and Forecast, 2021-2033
- 6.1. Market Analysis, Insights and Forecast - by Product Type
- 6.1.1. Non-halogenated Flame Retardant Chemicals
- 6.1.1.1. Inorganic
- 6.1.1.1.1. Aluminum Hydroxide
- 6.1.1.1.2. Magnesium Hydroxide
- 6.1.1.1.3. Boron Compounds
- 6.1.1.2. Phosphorus
- 6.1.1.3. Nitrogen
- 6.1.1.4. Other Product Types
- 6.1.1.1. Inorganic
- 6.1.2. Halogenated Flame Retardants Chemicals
- 6.1.2.1. Brominated Compounds
- 6.1.2.2. Chlorinated Compounds
- 6.1.1. Non-halogenated Flame Retardant Chemicals
- 6.2. Market Analysis, Insights and Forecast - by End-user Industry
- 6.2.1. Electrical and Electronics
- 6.2.2. Buildings and Construction
- 6.2.3. Transportation
- 6.2.4. Textiles and Furniture
- 6.1. Market Analysis, Insights and Forecast - by Product Type
- 7. Asia Pacific Flame Retardant Chemicals Industry Analysis, Insights and Forecast, 2021-2033
- 7.1. Market Analysis, Insights and Forecast - by Product Type
- 7.1.1. Non-halogenated Flame Retardant Chemicals
- 7.1.1.1. Inorganic
- 7.1.1.1.1. Aluminum Hydroxide
- 7.1.1.1.2. Magnesium Hydroxide
- 7.1.1.1.3. Boron Compounds
- 7.1.1.2. Phosphorus
- 7.1.1.3. Nitrogen
- 7.1.1.4. Other Product Types
- 7.1.1.1. Inorganic
- 7.1.2. Halogenated Flame Retardants Chemicals
- 7.1.2.1. Brominated Compounds
- 7.1.2.2. Chlorinated Compounds
- 7.1.1. Non-halogenated Flame Retardant Chemicals
- 7.2. Market Analysis, Insights and Forecast - by End-user Industry
- 7.2.1. Electrical and Electronics
- 7.2.2. Buildings and Construction
- 7.2.3. Transportation
- 7.2.4. Textiles and Furniture
- 7.1. Market Analysis, Insights and Forecast - by Product Type
- 8. North America Flame Retardant Chemicals Industry Analysis, Insights and Forecast, 2021-2033
- 8.1. Market Analysis, Insights and Forecast - by Product Type
- 8.1.1. Non-halogenated Flame Retardant Chemicals
- 8.1.1.1. Inorganic
- 8.1.1.1.1. Aluminum Hydroxide
- 8.1.1.1.2. Magnesium Hydroxide
- 8.1.1.1.3. Boron Compounds
- 8.1.1.2. Phosphorus
- 8.1.1.3. Nitrogen
- 8.1.1.4. Other Product Types
- 8.1.1.1. Inorganic
- 8.1.2. Halogenated Flame Retardants Chemicals
- 8.1.2.1. Brominated Compounds
- 8.1.2.2. Chlorinated Compounds
- 8.1.1. Non-halogenated Flame Retardant Chemicals
- 8.2. Market Analysis, Insights and Forecast - by End-user Industry
- 8.2.1. Electrical and Electronics
- 8.2.2. Buildings and Construction
- 8.2.3. Transportation
- 8.2.4. Textiles and Furniture
- 8.1. Market Analysis, Insights and Forecast - by Product Type
- 9. Europe Flame Retardant Chemicals Industry Analysis, Insights and Forecast, 2021-2033
- 9.1. Market Analysis, Insights and Forecast - by Product Type
- 9.1.1. Non-halogenated Flame Retardant Chemicals
- 9.1.1.1. Inorganic
- 9.1.1.1.1. Aluminum Hydroxide
- 9.1.1.1.2. Magnesium Hydroxide
- 9.1.1.1.3. Boron Compounds
- 9.1.1.2. Phosphorus
- 9.1.1.3. Nitrogen
- 9.1.1.4. Other Product Types
- 9.1.1.1. Inorganic
- 9.1.2. Halogenated Flame Retardants Chemicals
- 9.1.2.1. Brominated Compounds
- 9.1.2.2. Chlorinated Compounds
- 9.1.1. Non-halogenated Flame Retardant Chemicals
- 9.2. Market Analysis, Insights and Forecast - by End-user Industry
- 9.2.1. Electrical and Electronics
- 9.2.2. Buildings and Construction
- 9.2.3. Transportation
- 9.2.4. Textiles and Furniture
- 9.1. Market Analysis, Insights and Forecast - by Product Type
- 10. South America Flame Retardant Chemicals Industry Analysis, Insights and Forecast, 2021-2033
- 10.1. Market Analysis, Insights and Forecast - by Product Type
- 10.1.1. Non-halogenated Flame Retardant Chemicals
- 10.1.1.1. Inorganic
- 10.1.1.1.1. Aluminum Hydroxide
- 10.1.1.1.2. Magnesium Hydroxide
- 10.1.1.1.3. Boron Compounds
- 10.1.1.2. Phosphorus
- 10.1.1.3. Nitrogen
- 10.1.1.4. Other Product Types
- 10.1.1.1. Inorganic
- 10.1.2. Halogenated Flame Retardants Chemicals
- 10.1.2.1. Brominated Compounds
- 10.1.2.2. Chlorinated Compounds
- 10.1.1. Non-halogenated Flame Retardant Chemicals
- 10.2. Market Analysis, Insights and Forecast - by End-user Industry
- 10.2.1. Electrical and Electronics
- 10.2.2. Buildings and Construction
- 10.2.3. Transportation
- 10.2.4. Textiles and Furniture
- 10.1. Market Analysis, Insights and Forecast - by Product Type
- 11. Middle East Flame Retardant Chemicals Industry Analysis, Insights and Forecast, 2021-2033
- 11.1. Market Analysis, Insights and Forecast - by Product Type
- 11.1.1. Non-halogenated Flame Retardant Chemicals
- 11.1.1.1. Inorganic
- 11.1.1.1.1. Aluminum Hydroxide
- 11.1.1.1.2. Magnesium Hydroxide
- 11.1.1.1.3. Boron Compounds
- 11.1.1.2. Phosphorus
- 11.1.1.3. Nitrogen
- 11.1.1.4. Other Product Types
- 11.1.1.1. Inorganic
- 11.1.2. Halogenated Flame Retardants Chemicals
- 11.1.2.1. Brominated Compounds
- 11.1.2.2. Chlorinated Compounds
- 11.1.1. Non-halogenated Flame Retardant Chemicals
- 11.2. Market Analysis, Insights and Forecast - by End-user Industry
- 11.2.1. Electrical and Electronics
- 11.2.2. Buildings and Construction
- 11.2.3. Transportation
- 11.2.4. Textiles and Furniture
- 11.1. Market Analysis, Insights and Forecast - by Product Type
- 12. Saudi Arabia Flame Retardant Chemicals Industry Analysis, Insights and Forecast, 2021-2033
- 12.1. Market Analysis, Insights and Forecast - by Product Type
- 12.1.1. Non-halogenated Flame Retardant Chemicals
- 12.1.1.1. Inorganic
- 12.1.1.1.1. Aluminum Hydroxide
- 12.1.1.1.2. Magnesium Hydroxide
- 12.1.1.1.3. Boron Compounds
- 12.1.1.2. Phosphorus
- 12.1.1.3. Nitrogen
- 12.1.1.4. Other Product Types
- 12.1.1.1. Inorganic
- 12.1.2. Halogenated Flame Retardants Chemicals
- 12.1.2.1. Brominated Compounds
- 12.1.2.2. Chlorinated Compounds
- 12.1.1. Non-halogenated Flame Retardant Chemicals
- 12.2. Market Analysis, Insights and Forecast - by End-user Industry
- 12.2.1. Electrical and Electronics
- 12.2.2. Buildings and Construction
- 12.2.3. Transportation
- 12.2.4. Textiles and Furniture
- 12.1. Market Analysis, Insights and Forecast - by Product Type
- 13. Competitive Analysis
- 13.1. Company Profiles
- 13.1.1 Tor Minerals International Inc
- 13.1.1.1. Company Overview
- 13.1.1.2. Products
- 13.1.1.3. Company Financials
- 13.1.1.4. SWOT Analysis
- 13.1.2 Clariant
- 13.1.2.1. Company Overview
- 13.1.2.2. Products
- 13.1.2.3. Company Financials
- 13.1.2.4. SWOT Analysis
- 13.1.3 Jiangsu Jacques Technology Co Ltd
- 13.1.3.1. Company Overview
- 13.1.3.2. Products
- 13.1.3.3. Company Financials
- 13.1.3.4. SWOT Analysis
- 13.1.4 MPI Chemie BV
- 13.1.4.1. Company Overview
- 13.1.4.2. Products
- 13.1.4.3. Company Financials
- 13.1.4.4. SWOT Analysis
- 13.1.5 UFP Industries Inc
- 13.1.5.1. Company Overview
- 13.1.5.2. Products
- 13.1.5.3. Company Financials
- 13.1.5.4. SWOT Analysis
- 13.1.6 Italmatch Chemicals SpA
- 13.1.6.1. Company Overview
- 13.1.6.2. Products
- 13.1.6.3. Company Financials
- 13.1.6.4. SWOT Analysis
- 13.1.7 LANXESS
- 13.1.7.1. Company Overview
- 13.1.7.2. Products
- 13.1.7.3. Company Financials
- 13.1.7.4. SWOT Analysis
- 13.1.8 Kemipex
- 13.1.8.1. Company Overview
- 13.1.8.2. Products
- 13.1.8.3. Company Financials
- 13.1.8.4. SWOT Analysis
- 13.1.9 BASF SE
- 13.1.9.1. Company Overview
- 13.1.9.2. Products
- 13.1.9.3. Company Financials
- 13.1.9.4. SWOT Analysis
- 13.1.10 Tosoh Corporation
- 13.1.10.1. Company Overview
- 13.1.10.2. Products
- 13.1.10.3. Company Financials
- 13.1.10.4. SWOT Analysis
- 13.1.11 RTP Company
- 13.1.11.1. Company Overview
- 13.1.11.2. Products
- 13.1.11.3. Company Financials
- 13.1.11.4. SWOT Analysis
- 13.1.12 Dow
- 13.1.12.1. Company Overview
- 13.1.12.2. Products
- 13.1.12.3. Company Financials
- 13.1.12.4. SWOT Analysis
- 13.1.13 DAIHACHI CHEMICAL INDUSTRY CO LTD
- 13.1.13.1. Company Overview
- 13.1.13.2. Products
- 13.1.13.3. Company Financials
- 13.1.13.4. SWOT Analysis
- 13.1.14 Sanwa Chemical Co Ltd
- 13.1.14.1. Company Overview
- 13.1.14.2. Products
- 13.1.14.3. Company Financials
- 13.1.14.4. SWOT Analysis
- 13.1.15 Nabaltec AG
- 13.1.15.1. Company Overview
- 13.1.15.2. Products
- 13.1.15.3. Company Financials
- 13.1.15.4. SWOT Analysis
- 13.1.16 Thor
- 13.1.16.1. Company Overview
- 13.1.16.2. Products
- 13.1.16.3. Company Financials
- 13.1.16.4. SWOT Analysis
- 13.1.17 ICL Group
- 13.1.17.1. Company Overview
- 13.1.17.2. Products
- 13.1.17.3. Company Financials
- 13.1.17.4. SWOT Analysis
- 13.1.18 DIC CORPORATION
- 13.1.18.1. Company Overview
- 13.1.18.2. Products
- 13.1.18.3. Company Financials
- 13.1.18.4. SWOT Analysis
- 13.1.19 Shandong Brother Sci & Tech Co Ltd
- 13.1.19.1. Company Overview
- 13.1.19.2. Products
- 13.1.19.3. Company Financials
- 13.1.19.4. SWOT Analysis
- 13.1.20 J M Huber Corporation
- 13.1.20.1. Company Overview
- 13.1.20.2. Products
- 13.1.20.3. Company Financials
- 13.1.20.4. SWOT Analysis
- 13.1.21 Albemarle Corporation
- 13.1.21.1. Company Overview
- 13.1.21.2. Products
- 13.1.21.3. Company Financials
- 13.1.21.4. SWOT Analysis
- 13.1.22 Nyacol Nano Technologies Inc
- 13.1.22.1. Company Overview
- 13.1.22.2. Products
- 13.1.22.3. Company Financials
- 13.1.22.4. SWOT Analysis
- 13.1.23 Eti Maden
- 13.1.23.1. Company Overview
- 13.1.23.2. Products
- 13.1.23.3. Company Financials
- 13.1.23.4. SWOT Analysis
- 13.1.24 Apexical Inc
- 13.1.24.1. Company Overview
- 13.1.24.2. Products
- 13.1.24.3. Company Financials
- 13.1.24.4. SWOT Analysis
- 13.1.25 RIN KAGAKU KOGYO Co Ltd
- 13.1.25.1. Company Overview
- 13.1.25.2. Products
- 13.1.25.3. Company Financials
- 13.1.25.4. SWOT Analysis
- 13.1.1 Tor Minerals International Inc
- 13.2. Market Entropy
- 13.2.1 Company's Key Areas Served
- 13.2.2 Recent Developments
- 13.3. Company Market Share Analysis 2025
- 13.3.1 Top 5 Companies Market Share Analysis
- 13.3.2 Top 3 Companies Market Share Analysis
- 13.4. List of Potential Customers
- 14. Research Methodology
List of Figures
- Figure 1: Global Flame Retardant Chemicals Industry Revenue Breakdown (Billion, %) by Region 2025 & 2033
- Figure 2: Global Flame Retardant Chemicals Industry Volume Breakdown (K Tons, %) by Region 2025 & 2033
- Figure 3: Asia Pacific Flame Retardant Chemicals Industry Revenue (Billion), by Product Type 2025 & 2033
- Figure 4: Asia Pacific Flame Retardant Chemicals Industry Volume (K Tons), by Product Type 2025 & 2033
- Figure 5: Asia Pacific Flame Retardant Chemicals Industry Revenue Share (%), by Product Type 2025 & 2033
- Figure 6: Asia Pacific Flame Retardant Chemicals Industry Volume Share (%), by Product Type 2025 & 2033
- Figure 7: Asia Pacific Flame Retardant Chemicals Industry Revenue (Billion), by End-user Industry 2025 & 2033
- Figure 8: Asia Pacific Flame Retardant Chemicals Industry Volume (K Tons), by End-user Industry 2025 & 2033
- Figure 9: Asia Pacific Flame Retardant Chemicals Industry Revenue Share (%), by End-user Industry 2025 & 2033
- Figure 10: Asia Pacific Flame Retardant Chemicals Industry Volume Share (%), by End-user Industry 2025 & 2033
- Figure 11: Asia Pacific Flame Retardant Chemicals Industry Revenue (Billion), by Country 2025 & 2033
- Figure 12: Asia Pacific Flame Retardant Chemicals Industry Volume (K Tons), by Country 2025 & 2033
- Figure 13: Asia Pacific Flame Retardant Chemicals Industry Revenue Share (%), by Country 2025 & 2033
- Figure 14: Asia Pacific Flame Retardant Chemicals Industry Volume Share (%), by Country 2025 & 2033
- Figure 15: North America Flame Retardant Chemicals Industry Revenue (Billion), by Product Type 2025 & 2033
- Figure 16: North America Flame Retardant Chemicals Industry Volume (K Tons), by Product Type 2025 & 2033
- Figure 17: North America Flame Retardant Chemicals Industry Revenue Share (%), by Product Type 2025 & 2033
- Figure 18: North America Flame Retardant Chemicals Industry Volume Share (%), by Product Type 2025 & 2033
- Figure 19: North America Flame Retardant Chemicals Industry Revenue (Billion), by End-user Industry 2025 & 2033
- Figure 20: North America Flame Retardant Chemicals Industry Volume (K Tons), by End-user Industry 2025 & 2033
- Figure 21: North America Flame Retardant Chemicals Industry Revenue Share (%), by End-user Industry 2025 & 2033
- Figure 22: North America Flame Retardant Chemicals Industry Volume Share (%), by End-user Industry 2025 & 2033
- Figure 23: North America Flame Retardant Chemicals Industry Revenue (Billion), by Country 2025 & 2033
- Figure 24: North America Flame Retardant Chemicals Industry Volume (K Tons), by Country 2025 & 2033
- Figure 25: North America Flame Retardant Chemicals Industry Revenue Share (%), by Country 2025 & 2033
- Figure 26: North America Flame Retardant Chemicals Industry Volume Share (%), by Country 2025 & 2033
- Figure 27: Europe Flame Retardant Chemicals Industry Revenue (Billion), by Product Type 2025 & 2033
- Figure 28: Europe Flame Retardant Chemicals Industry Volume (K Tons), by Product Type 2025 & 2033
- Figure 29: Europe Flame Retardant Chemicals Industry Revenue Share (%), by Product Type 2025 & 2033
- Figure 30: Europe Flame Retardant Chemicals Industry Volume Share (%), by Product Type 2025 & 2033
- Figure 31: Europe Flame Retardant Chemicals Industry Revenue (Billion), by End-user Industry 2025 & 2033
- Figure 32: Europe Flame Retardant Chemicals Industry Volume (K Tons), by End-user Industry 2025 & 2033
- Figure 33: Europe Flame Retardant Chemicals Industry Revenue Share (%), by End-user Industry 2025 & 2033
- Figure 34: Europe Flame Retardant Chemicals Industry Volume Share (%), by End-user Industry 2025 & 2033
- Figure 35: Europe Flame Retardant Chemicals Industry Revenue (Billion), by Country 2025 & 2033
- Figure 36: Europe Flame Retardant Chemicals Industry Volume (K Tons), by Country 2025 & 2033
- Figure 37: Europe Flame Retardant Chemicals Industry Revenue Share (%), by Country 2025 & 2033
- Figure 38: Europe Flame Retardant Chemicals Industry Volume Share (%), by Country 2025 & 2033
- Figure 39: South America Flame Retardant Chemicals Industry Revenue (Billion), by Product Type 2025 & 2033
- Figure 40: South America Flame Retardant Chemicals Industry Volume (K Tons), by Product Type 2025 & 2033
- Figure 41: South America Flame Retardant Chemicals Industry Revenue Share (%), by Product Type 2025 & 2033
- Figure 42: South America Flame Retardant Chemicals Industry Volume Share (%), by Product Type 2025 & 2033
- Figure 43: South America Flame Retardant Chemicals Industry Revenue (Billion), by End-user Industry 2025 & 2033
- Figure 44: South America Flame Retardant Chemicals Industry Volume (K Tons), by End-user Industry 2025 & 2033
- Figure 45: South America Flame Retardant Chemicals Industry Revenue Share (%), by End-user Industry 2025 & 2033
- Figure 46: South America Flame Retardant Chemicals Industry Volume Share (%), by End-user Industry 2025 & 2033
- Figure 47: South America Flame Retardant Chemicals Industry Revenue (Billion), by Country 2025 & 2033
- Figure 48: South America Flame Retardant Chemicals Industry Volume (K Tons), by Country 2025 & 2033
- Figure 49: South America Flame Retardant Chemicals Industry Revenue Share (%), by Country 2025 & 2033
- Figure 50: South America Flame Retardant Chemicals Industry Volume Share (%), by Country 2025 & 2033
- Figure 51: Middle East Flame Retardant Chemicals Industry Revenue (Billion), by Product Type 2025 & 2033
- Figure 52: Middle East Flame Retardant Chemicals Industry Volume (K Tons), by Product Type 2025 & 2033
- Figure 53: Middle East Flame Retardant Chemicals Industry Revenue Share (%), by Product Type 2025 & 2033
- Figure 54: Middle East Flame Retardant Chemicals Industry Volume Share (%), by Product Type 2025 & 2033
- Figure 55: Middle East Flame Retardant Chemicals Industry Revenue (Billion), by End-user Industry 2025 & 2033
- Figure 56: Middle East Flame Retardant Chemicals Industry Volume (K Tons), by End-user Industry 2025 & 2033
- Figure 57: Middle East Flame Retardant Chemicals Industry Revenue Share (%), by End-user Industry 2025 & 2033
- Figure 58: Middle East Flame Retardant Chemicals Industry Volume Share (%), by End-user Industry 2025 & 2033
- Figure 59: Middle East Flame Retardant Chemicals Industry Revenue (Billion), by Country 2025 & 2033
- Figure 60: Middle East Flame Retardant Chemicals Industry Volume (K Tons), by Country 2025 & 2033
- Figure 61: Middle East Flame Retardant Chemicals Industry Revenue Share (%), by Country 2025 & 2033
- Figure 62: Middle East Flame Retardant Chemicals Industry Volume Share (%), by Country 2025 & 2033
- Figure 63: Saudi Arabia Flame Retardant Chemicals Industry Revenue (Billion), by Product Type 2025 & 2033
- Figure 64: Saudi Arabia Flame Retardant Chemicals Industry Volume (K Tons), by Product Type 2025 & 2033
- Figure 65: Saudi Arabia Flame Retardant Chemicals Industry Revenue Share (%), by Product Type 2025 & 2033
- Figure 66: Saudi Arabia Flame Retardant Chemicals Industry Volume Share (%), by Product Type 2025 & 2033
- Figure 67: Saudi Arabia Flame Retardant Chemicals Industry Revenue (Billion), by End-user Industry 2025 & 2033
- Figure 68: Saudi Arabia Flame Retardant Chemicals Industry Volume (K Tons), by End-user Industry 2025 & 2033
- Figure 69: Saudi Arabia Flame Retardant Chemicals Industry Revenue Share (%), by End-user Industry 2025 & 2033
- Figure 70: Saudi Arabia Flame Retardant Chemicals Industry Volume Share (%), by End-user Industry 2025 & 2033
- Figure 71: Saudi Arabia Flame Retardant Chemicals Industry Revenue (Billion), by Country 2025 & 2033
- Figure 72: Saudi Arabia Flame Retardant Chemicals Industry Volume (K Tons), by Country 2025 & 2033
- Figure 73: Saudi Arabia Flame Retardant Chemicals Industry Revenue Share (%), by Country 2025 & 2033
- Figure 74: Saudi Arabia Flame Retardant Chemicals Industry Volume Share (%), by Country 2025 & 2033
List of Tables
- Table 1: Global Flame Retardant Chemicals Industry Revenue Billion Forecast, by Product Type 2020 & 2033
- Table 2: Global Flame Retardant Chemicals Industry Volume K Tons Forecast, by Product Type 2020 & 2033
- Table 3: Global Flame Retardant Chemicals Industry Revenue Billion Forecast, by End-user Industry 2020 & 2033
- Table 4: Global Flame Retardant Chemicals Industry Volume K Tons Forecast, by End-user Industry 2020 & 2033
- Table 5: Global Flame Retardant Chemicals Industry Revenue Billion Forecast, by Region 2020 & 2033
- Table 6: Global Flame Retardant Chemicals Industry Volume K Tons Forecast, by Region 2020 & 2033
- Table 7: Global Flame Retardant Chemicals Industry Revenue Billion Forecast, by Product Type 2020 & 2033
- Table 8: Global Flame Retardant Chemicals Industry Volume K Tons Forecast, by Product Type 2020 & 2033
- Table 9: Global Flame Retardant Chemicals Industry Revenue Billion Forecast, by End-user Industry 2020 & 2033
- Table 10: Global Flame Retardant Chemicals Industry Volume K Tons Forecast, by End-user Industry 2020 & 2033
- Table 11: Global Flame Retardant Chemicals Industry Revenue Billion Forecast, by Country 2020 & 2033
- Table 12: Global Flame Retardant Chemicals Industry Volume K Tons Forecast, by Country 2020 & 2033
- Table 13: China Flame Retardant Chemicals Industry Revenue (Billion) Forecast, by Application 2020 & 2033
- Table 14: China Flame Retardant Chemicals Industry Volume (K Tons) Forecast, by Application 2020 & 2033
- Table 15: India Flame Retardant Chemicals Industry Revenue (Billion) Forecast, by Application 2020 & 2033
- Table 16: India Flame Retardant Chemicals Industry Volume (K Tons) Forecast, by Application 2020 & 2033
- Table 17: Japan Flame Retardant Chemicals Industry Revenue (Billion) Forecast, by Application 2020 & 2033
- Table 18: Japan Flame Retardant Chemicals Industry Volume (K Tons) Forecast, by Application 2020 & 2033
- Table 19: South Korea Flame Retardant Chemicals Industry Revenue (Billion) Forecast, by Application 2020 & 2033
- Table 20: South Korea Flame Retardant Chemicals Industry Volume (K Tons) Forecast, by Application 2020 & 2033
- Table 21: Australia and New Zealand Flame Retardant Chemicals Industry Revenue (Billion) Forecast, by Application 2020 & 2033
- Table 22: Australia and New Zealand Flame Retardant Chemicals Industry Volume (K Tons) Forecast, by Application 2020 & 2033
- Table 23: Rest of Asia Pacific Flame Retardant Chemicals Industry Revenue (Billion) Forecast, by Application 2020 & 2033
- Table 24: Rest of Asia Pacific Flame Retardant Chemicals Industry Volume (K Tons) Forecast, by Application 2020 & 2033
- Table 25: Global Flame Retardant Chemicals Industry Revenue Billion Forecast, by Product Type 2020 & 2033
- Table 26: Global Flame Retardant Chemicals Industry Volume K Tons Forecast, by Product Type 2020 & 2033
- Table 27: Global Flame Retardant Chemicals Industry Revenue Billion Forecast, by End-user Industry 2020 & 2033
- Table 28: Global Flame Retardant Chemicals Industry Volume K Tons Forecast, by End-user Industry 2020 & 2033
- Table 29: Global Flame Retardant Chemicals Industry Revenue Billion Forecast, by Country 2020 & 2033
- Table 30: Global Flame Retardant Chemicals Industry Volume K Tons Forecast, by Country 2020 & 2033
- Table 31: United States Flame Retardant Chemicals Industry Revenue (Billion) Forecast, by Application 2020 & 2033
- Table 32: United States Flame Retardant Chemicals Industry Volume (K Tons) Forecast, by Application 2020 & 2033
- Table 33: Canada Flame Retardant Chemicals Industry Revenue (Billion) Forecast, by Application 2020 & 2033
- Table 34: Canada Flame Retardant Chemicals Industry Volume (K Tons) Forecast, by Application 2020 & 2033
- Table 35: Mexico Flame Retardant Chemicals Industry Revenue (Billion) Forecast, by Application 2020 & 2033
- Table 36: Mexico Flame Retardant Chemicals Industry Volume (K Tons) Forecast, by Application 2020 & 2033
- Table 37: Rest of North America Flame Retardant Chemicals Industry Revenue (Billion) Forecast, by Application 2020 & 2033
- Table 38: Rest of North America Flame Retardant Chemicals Industry Volume (K Tons) Forecast, by Application 2020 & 2033
- Table 39: Global Flame Retardant Chemicals Industry Revenue Billion Forecast, by Product Type 2020 & 2033
- Table 40: Global Flame Retardant Chemicals Industry Volume K Tons Forecast, by Product Type 2020 & 2033
- Table 41: Global Flame Retardant Chemicals Industry Revenue Billion Forecast, by End-user Industry 2020 & 2033
- Table 42: Global Flame Retardant Chemicals Industry Volume K Tons Forecast, by End-user Industry 2020 & 2033
- Table 43: Global Flame Retardant Chemicals Industry Revenue Billion Forecast, by Country 2020 & 2033
- Table 44: Global Flame Retardant Chemicals Industry Volume K Tons Forecast, by Country 2020 & 2033
- Table 45: Germany Flame Retardant Chemicals Industry Revenue (Billion) Forecast, by Application 2020 & 2033
- Table 46: Germany Flame Retardant Chemicals Industry Volume (K Tons) Forecast, by Application 2020 & 2033
- Table 47: United Kingdom Flame Retardant Chemicals Industry Revenue (Billion) Forecast, by Application 2020 & 2033
- Table 48: United Kingdom Flame Retardant Chemicals Industry Volume (K Tons) Forecast, by Application 2020 & 2033
- Table 49: Italy Flame Retardant Chemicals Industry Revenue (Billion) Forecast, by Application 2020 & 2033
- Table 50: Italy Flame Retardant Chemicals Industry Volume (K Tons) Forecast, by Application 2020 & 2033
- Table 51: France Flame Retardant Chemicals Industry Revenue (Billion) Forecast, by Application 2020 & 2033
- Table 52: France Flame Retardant Chemicals Industry Volume (K Tons) Forecast, by Application 2020 & 2033
- Table 53: Spain Flame Retardant Chemicals Industry Revenue (Billion) Forecast, by Application 2020 & 2033
- Table 54: Spain Flame Retardant Chemicals Industry Volume (K Tons) Forecast, by Application 2020 & 2033
- Table 55: Rest of Europe Flame Retardant Chemicals Industry Revenue (Billion) Forecast, by Application 2020 & 2033
- Table 56: Rest of Europe Flame Retardant Chemicals Industry Volume (K Tons) Forecast, by Application 2020 & 2033
- Table 57: Global Flame Retardant Chemicals Industry Revenue Billion Forecast, by Product Type 2020 & 2033
- Table 58: Global Flame Retardant Chemicals Industry Volume K Tons Forecast, by Product Type 2020 & 2033
- Table 59: Global Flame Retardant Chemicals Industry Revenue Billion Forecast, by End-user Industry 2020 & 2033
- Table 60: Global Flame Retardant Chemicals Industry Volume K Tons Forecast, by End-user Industry 2020 & 2033
- Table 61: Global Flame Retardant Chemicals Industry Revenue Billion Forecast, by Country 2020 & 2033
- Table 62: Global Flame Retardant Chemicals Industry Volume K Tons Forecast, by Country 2020 & 2033
- Table 63: Brazil Flame Retardant Chemicals Industry Revenue (Billion) Forecast, by Application 2020 & 2033
- Table 64: Brazil Flame Retardant Chemicals Industry Volume (K Tons) Forecast, by Application 2020 & 2033
- Table 65: Argentina Flame Retardant Chemicals Industry Revenue (Billion) Forecast, by Application 2020 & 2033
- Table 66: Argentina Flame Retardant Chemicals Industry Volume (K Tons) Forecast, by Application 2020 & 2033
- Table 67: Rest of South America Flame Retardant Chemicals Industry Revenue (Billion) Forecast, by Application 2020 & 2033
- Table 68: Rest of South America Flame Retardant Chemicals Industry Volume (K Tons) Forecast, by Application 2020 & 2033
- Table 69: Global Flame Retardant Chemicals Industry Revenue Billion Forecast, by Product Type 2020 & 2033
- Table 70: Global Flame Retardant Chemicals Industry Volume K Tons Forecast, by Product Type 2020 & 2033
- Table 71: Global Flame Retardant Chemicals Industry Revenue Billion Forecast, by End-user Industry 2020 & 2033
- Table 72: Global Flame Retardant Chemicals Industry Volume K Tons Forecast, by End-user Industry 2020 & 2033
- Table 73: Global Flame Retardant Chemicals Industry Revenue Billion Forecast, by Country 2020 & 2033
- Table 74: Global Flame Retardant Chemicals Industry Volume K Tons Forecast, by Country 2020 & 2033
- Table 75: Global Flame Retardant Chemicals Industry Revenue Billion Forecast, by Product Type 2020 & 2033
- Table 76: Global Flame Retardant Chemicals Industry Volume K Tons Forecast, by Product Type 2020 & 2033
- Table 77: Global Flame Retardant Chemicals Industry Revenue Billion Forecast, by End-user Industry 2020 & 2033
- Table 78: Global Flame Retardant Chemicals Industry Volume K Tons Forecast, by End-user Industry 2020 & 2033
- Table 79: Global Flame Retardant Chemicals Industry Revenue Billion Forecast, by Country 2020 & 2033
- Table 80: Global Flame Retardant Chemicals Industry Volume K Tons Forecast, by Country 2020 & 2033
- Table 81: South Africa Flame Retardant Chemicals Industry Revenue (Billion) Forecast, by Application 2020 & 2033
- Table 82: South Africa Flame Retardant Chemicals Industry Volume (K Tons) Forecast, by Application 2020 & 2033
- Table 83: Qatar Flame Retardant Chemicals Industry Revenue (Billion) Forecast, by Application 2020 & 2033
- Table 84: Qatar Flame Retardant Chemicals Industry Volume (K Tons) Forecast, by Application 2020 & 2033
- Table 85: Rest of Middle East Flame Retardant Chemicals Industry Revenue (Billion) Forecast, by Application 2020 & 2033
- Table 86: Rest of Middle East Flame Retardant Chemicals Industry Volume (K Tons) Forecast, by Application 2020 & 2033
Frequently Asked Questions
1. What is the projected Compound Annual Growth Rate (CAGR) of the Flame Retardant Chemicals Industry?
The projected CAGR is approximately 5.2%.
2. Which companies are prominent players in the Flame Retardant Chemicals Industry?
Key companies in the market include Tor Minerals International Inc, Clariant, Jiangsu Jacques Technology Co Ltd, MPI Chemie BV, UFP Industries Inc, Italmatch Chemicals SpA, LANXESS, Kemipex, BASF SE, Tosoh Corporation, RTP Company, Dow, DAIHACHI CHEMICAL INDUSTRY CO LTD, Sanwa Chemical Co Ltd, Nabaltec AG, Thor, ICL Group, DIC CORPORATION, Shandong Brother Sci & Tech Co Ltd, J M Huber Corporation, Albemarle Corporation, Nyacol Nano Technologies Inc, Eti Maden, Apexical Inc, RIN KAGAKU KOGYO Co Ltd.
3. What are the main segments of the Flame Retardant Chemicals Industry?
The market segments include Product Type, End-user Industry.
4. Can you provide details about the market size?
The market size is estimated to be USD 7.2 Billion as of 2022.
5. What are some drivers contributing to market growth?
Increasing Infrastructure Activities in Asia-Pacific; Rise in Safety Standards in Building Construction; Rising Consumer Electrical and Electronic Goods Manufacturing.
6. What are the notable trends driving market growth?
Building and Construction Segment to Dominate the Market.
7. Are there any restraints impacting market growth?
Environmental and Health Concerns Regarding Brominated and Halogenated Flame Retardants.
8. Can you provide examples of recent developments in the market?
In September 2022, LANXESS launched new phosphorous-based flame retardants which have unique properties such as thermal and mechanical stability and are compatible with engineering plastics.
9. What pricing options are available for accessing the report?
Pricing options include single-user, multi-user, and enterprise licenses priced at USD 3,950, USD 4,950, and USD 6,950 respectively.
10. Is the market size provided in terms of value or volume?
The market size is provided in terms of value, measured in Billion and volume, measured in K Tons.
11. Are there any specific market keywords associated with the report?
Yes, the market keyword associated with the report is "Flame Retardant Chemicals Industry," which aids in identifying and referencing the specific market segment covered.
12. How do I determine which pricing option suits my needs best?
The pricing options vary based on user requirements and access needs. Individual users may opt for single-user licenses, while businesses requiring broader access may choose multi-user or enterprise licenses for cost-effective access to the report.
13. Are there any additional resources or data provided in the Flame Retardant Chemicals Industry report?
While the report offers comprehensive insights, it's advisable to review the specific contents or supplementary materials provided to ascertain if additional resources or data are available.
14. How can I stay updated on further developments or reports in the Flame Retardant Chemicals Industry?
To stay informed about further developments, trends, and reports in the Flame Retardant Chemicals Industry, consider subscribing to industry newsletters, following relevant companies and organizations, or regularly checking reputable industry news sources and publications.
Methodology
Step 1 - Identification of Relevant Samples Size from Population Database


Step 2 - Approaches for Defining Global Market Size (Value, Volume* & Price*)

Note*: In applicable scenarios
Step 3 - Data Sources
Primary Research
- Web Analytics
- Survey Reports
- Research Institute
- Latest Research Reports
- Opinion Leaders
Secondary Research
- Annual Reports
- White Paper
- Latest Press Release
- Industry Association
- Paid Database
- Investor Presentations

Step 4 - Data Triangulation
Involves using different sources of information in order to increase the validity of a study
These sources are likely to be stakeholders in a program - participants, other researchers, program staff, other community members, and so on.
Then we put all data in single framework & apply various statistical tools to find out the dynamic on the market.
During the analysis stage, feedback from the stakeholder groups would be compared to determine areas of agreement as well as areas of divergence