


Key Insights
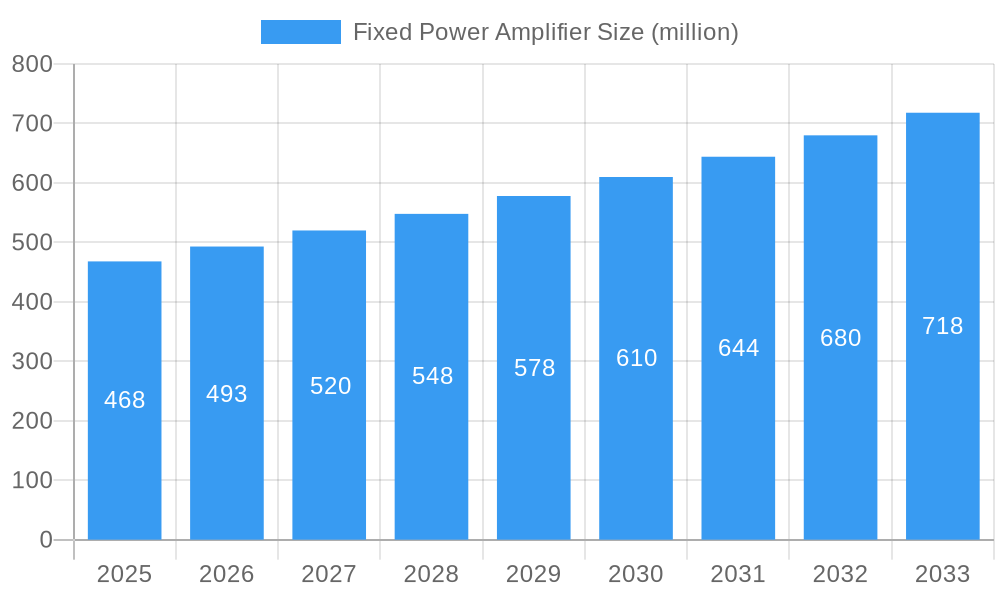
The fixed power amplifier (FPA) market, currently valued at $468 million in 2025, is projected to experience robust growth, driven by increasing demand across diverse sectors. The 5.1% CAGR indicates a steady expansion throughout the forecast period (2025-2033). Key growth drivers include the burgeoning adoption of 5G and other advanced wireless communication technologies, the expansion of satellite communication infrastructure, and the rising need for high-power amplification in radar systems and defense applications. Technological advancements leading to higher efficiency, miniaturization, and improved performance of FPAs are also contributing factors. While specific restraints aren't detailed, potential challenges could include supply chain disruptions, rising component costs, and the need for continuous innovation to meet the ever-evolving demands of next-generation communication systems. The market is segmented by application (e.g., 5G infrastructure, satellite communications, radar), frequency range, and technology. Leading players like Ametek, Qorvo, and others are actively engaged in research and development, strategic partnerships, and acquisitions to strengthen their market position and capitalize on the growth opportunities.
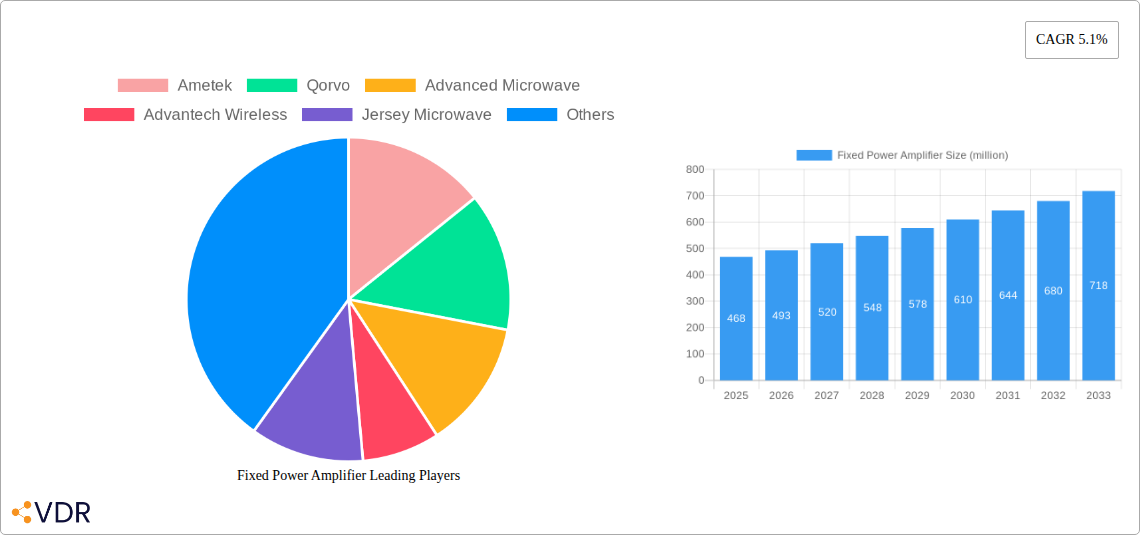
Fixed Power Amplifier Market Size (In Million)

The competitive landscape is characterized by both established industry giants and specialized niche players. The presence of companies like Thales Alenia Space and General Dynamics underscores the significance of FPAs in defense and aerospace applications. Companies are focusing on developing highly efficient and reliable FPAs that meet stringent performance requirements and comply with regulatory standards. Future growth will likely be influenced by government investments in infrastructure development, the adoption of advanced materials in FPA design, and the increasing integration of FPAs within larger systems. The market presents attractive opportunities for companies that can offer innovative solutions, competitive pricing, and robust customer support. Expansion into emerging markets and strategic alliances are expected to be key growth strategies for players in the coming years.
Fixed Power Amplifier Company Market Share
Fixed Power Amplifier Market Report: 2019-2033
This comprehensive report provides a detailed analysis of the Fixed Power Amplifier market, encompassing market dynamics, growth trends, regional analysis, product landscape, and key player profiles. The study period covers 2019-2033, with 2025 as the base and estimated year. The forecast period extends from 2025 to 2033, and the historical period analyzed is 2019-2024. This report is essential for industry professionals, investors, and anyone seeking a thorough understanding of this dynamic market segment. The parent market is the broader power amplifier market (valued at xx million units in 2025), while the child market is specifically fixed power amplifiers used in [mention specific applications like Satellite Communication, Military Radar etc.].
Fixed Power Amplifier Market Dynamics & Structure
The Fixed Power Amplifier market is characterized by moderate concentration, with key players holding significant market share. Technological innovation, particularly in GaN and SiC technologies, is a major driver, alongside evolving regulatory frameworks impacting emission standards and energy efficiency. Competitive product substitutes, such as software-defined radios, pose a challenge, while end-user demographics, primarily in the telecommunications and defense sectors, strongly influence market demand. M&A activity has been moderate, with xx deals recorded between 2019-2024, resulting in an estimated xx% market share shift.
- Market Concentration: Moderately concentrated, with top 5 players holding approximately xx% of the market share in 2025.
- Technological Innovation: GaN and SiC-based amplifiers are driving efficiency improvements and miniaturization.
- Regulatory Landscape: Stringent emission standards and energy efficiency regulations are shaping product development.
- Competitive Substitutes: Software-defined radios and other technologies offer alternative solutions.
- End-User Demographics: Primarily driven by the telecommunications, defense, and aerospace industries.
- M&A Activity: xx M&A deals between 2019-2024, contributing to market consolidation.
Fixed Power Amplifier Growth Trends & Insights
The Fixed Power Amplifier market experienced a CAGR of xx% during the historical period (2019-2024), reaching an estimated market size of xx million units in 2025. This growth is attributed to increasing demand from the telecommunications sector (driven by 5G deployment) and the defense industry (for radar and communication systems). Technological advancements, particularly the adoption of GaN and SiC, are boosting efficiency and performance, leading to wider adoption. Consumer behavior shifts towards higher bandwidth and lower latency requirements are further fueling market growth. The forecast period (2025-2033) anticipates a CAGR of xx%, driven by continuous technological advancements and increasing demand from emerging applications. Market penetration is expected to reach xx% by 2033.
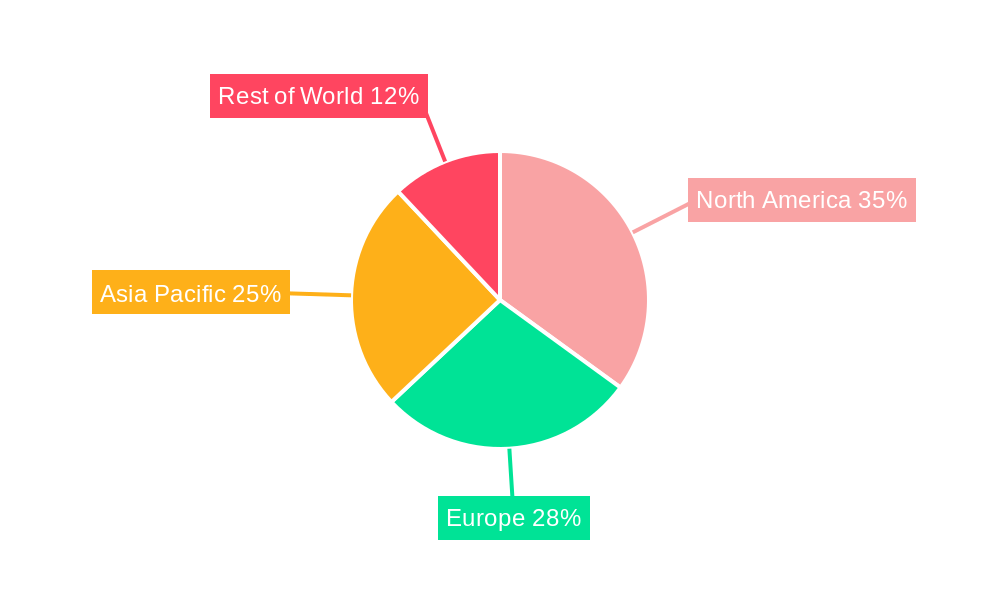
Dominant Regions, Countries, or Segments in Fixed Power Amplifier
North America holds the largest market share in the Fixed Power Amplifier market in 2025, followed by Asia-Pacific. This dominance stems from robust investments in 5G infrastructure, a strong defense industry, and the presence of key players. Europe also presents significant growth potential, driven by increasing investments in telecommunications and aerospace.
- North America: Strong presence of key players, high demand from defense and telecommunications sectors, and advanced technological infrastructure.
- Asia-Pacific: Rapid growth fueled by increasing 5G adoption, expanding telecommunications infrastructure, and a burgeoning defense sector.
- Europe: Significant growth potential driven by investments in telecommunications and aerospace, along with favorable regulatory environments.
Fixed Power Amplifier Product Landscape
Fixed power amplifiers are available in a variety of configurations and power levels, tailored to specific applications. Recent innovations focus on enhancing efficiency, reducing size and weight, and improving linearity. Key performance metrics include power output, gain, efficiency, and linearity. The unique selling propositions revolve around high efficiency, compact designs, and superior performance across various frequency bands. Technological advancements in GaN and SiC semiconductor materials are driving significant improvements in performance and power density.
Key Drivers, Barriers & Challenges in Fixed Power Amplifier
Key Drivers:
- The rising demand for higher bandwidth and data rates in 5G networks.
- Growth in the defense and aerospace sectors, driving demand for high-power amplifiers.
- Technological advancements in GaN and SiC technology, resulting in improved efficiency and performance.
Key Challenges:
- High manufacturing costs associated with advanced materials like GaN and SiC.
- Competition from substitute technologies like software-defined radios.
- Stringent regulatory requirements related to emissions and energy efficiency. This leads to a xx% increase in R&D costs.
Emerging Opportunities in Fixed Power Amplifier
Significant opportunities exist in emerging applications such as satellite communication, IoT devices, and high-frequency radar systems. Untapped markets in developing economies also present substantial growth potential. The increasing demand for higher power and efficiency in these applications is driving the need for innovative designs and materials.
Growth Accelerators in the Fixed Power Amplifier Industry
Strategic partnerships between semiconductor manufacturers and system integrators are driving innovation and market expansion. Technological breakthroughs, specifically in wide bandgap semiconductor technologies, are continually improving efficiency and performance. Market expansion into new applications and geographical regions is expected to accelerate long-term growth.
Notable Milestones in Fixed Power Amplifier Sector
- 2020-Q4: Ametek launched a new high-efficiency GaN amplifier.
- 2021-Q2: Qorvo acquired a smaller amplifier manufacturer, increasing its market share by xx%.
- 2022-Q3: Significant investments were made in GaN research and development across the industry.
- 2023-Q1: New regulatory standards for power amplifier efficiency were implemented in North America.
In-Depth Fixed Power Amplifier Market Outlook
The Fixed Power Amplifier market is poised for substantial growth over the forecast period, fueled by technological advancements, increasing demand from key end-user sectors, and market expansion into new applications. Strategic partnerships, targeted investments in R&D, and a focus on enhancing efficiency and performance will continue to shape market dynamics. The focus on miniaturization and improved thermal management will create significant new opportunities.
Fixed Power Amplifier Segmentation
-
1. Application
- 1.1. Audio Amplification
- 1.2. Wireless Communication
- 1.3. Medical Equipment
- 1.4. Test and Measurement Equipment
- 1.5. RF System
-
2. Types
- 2.1. Linear Amplifier
- 2.2. Nonlinear Amplifier
Fixed Power Amplifier Segmentation By Geography
-
1. North America
- 1.1. United States
- 1.2. Canada
- 1.3. Mexico
-
2. South America
- 2.1. Brazil
- 2.2. Argentina
- 2.3. Rest of South America
-
3. Europe
- 3.1. United Kingdom
- 3.2. Germany
- 3.3. France
- 3.4. Italy
- 3.5. Spain
- 3.6. Russia
- 3.7. Benelux
- 3.8. Nordics
- 3.9. Rest of Europe
-
4. Middle East & Africa
- 4.1. Turkey
- 4.2. Israel
- 4.3. GCC
- 4.4. North Africa
- 4.5. South Africa
- 4.6. Rest of Middle East & Africa
-
5. Asia Pacific
- 5.1. China
- 5.2. India
- 5.3. Japan
- 5.4. South Korea
- 5.5. ASEAN
- 5.6. Oceania
- 5.7. Rest of Asia Pacific
Fixed Power Amplifier Regional Market Share
Geographic Coverage of Fixed Power Amplifier
Fixed Power Amplifier REPORT HIGHLIGHTS
| Aspects | Details |
|---|---|
| Study Period | 2020-2034 |
| Base Year | 2025 |
| Estimated Year | 2026 |
| Forecast Period | 2026-2034 |
| Historical Period | 2020-2025 |
| Growth Rate | CAGR of 5.1% from 2020-2034 |
| Segmentation |
|
Table of Contents
- 1. Introduction
- 1.1. Research Scope
- 1.2. Market Segmentation
- 1.3. Research Methodology
- 1.4. Definitions and Assumptions
- 2. Executive Summary
- 2.1. Introduction
- 3. Market Dynamics
- 3.1. Introduction
- 3.2. Market Drivers
- 3.3. Market Restrains
- 3.4. Market Trends
- 4. Market Factor Analysis
- 4.1. Porters Five Forces
- 4.2. Supply/Value Chain
- 4.3. PESTEL analysis
- 4.4. Market Entropy
- 4.5. Patent/Trademark Analysis
- 5. Global Fixed Power Amplifier Analysis, Insights and Forecast, 2020-2032
- 5.1. Market Analysis, Insights and Forecast - by Application
- 5.1.1. Audio Amplification
- 5.1.2. Wireless Communication
- 5.1.3. Medical Equipment
- 5.1.4. Test and Measurement Equipment
- 5.1.5. RF System
- 5.2. Market Analysis, Insights and Forecast - by Types
- 5.2.1. Linear Amplifier
- 5.2.2. Nonlinear Amplifier
- 5.3. Market Analysis, Insights and Forecast - by Region
- 5.3.1. North America
- 5.3.2. South America
- 5.3.3. Europe
- 5.3.4. Middle East & Africa
- 5.3.5. Asia Pacific
- 5.1. Market Analysis, Insights and Forecast - by Application
- 6. North America Fixed Power Amplifier Analysis, Insights and Forecast, 2020-2032
- 6.1. Market Analysis, Insights and Forecast - by Application
- 6.1.1. Audio Amplification
- 6.1.2. Wireless Communication
- 6.1.3. Medical Equipment
- 6.1.4. Test and Measurement Equipment
- 6.1.5. RF System
- 6.2. Market Analysis, Insights and Forecast - by Types
- 6.2.1. Linear Amplifier
- 6.2.2. Nonlinear Amplifier
- 6.1. Market Analysis, Insights and Forecast - by Application
- 7. South America Fixed Power Amplifier Analysis, Insights and Forecast, 2020-2032
- 7.1. Market Analysis, Insights and Forecast - by Application
- 7.1.1. Audio Amplification
- 7.1.2. Wireless Communication
- 7.1.3. Medical Equipment
- 7.1.4. Test and Measurement Equipment
- 7.1.5. RF System
- 7.2. Market Analysis, Insights and Forecast - by Types
- 7.2.1. Linear Amplifier
- 7.2.2. Nonlinear Amplifier
- 7.1. Market Analysis, Insights and Forecast - by Application
- 8. Europe Fixed Power Amplifier Analysis, Insights and Forecast, 2020-2032
- 8.1. Market Analysis, Insights and Forecast - by Application
- 8.1.1. Audio Amplification
- 8.1.2. Wireless Communication
- 8.1.3. Medical Equipment
- 8.1.4. Test and Measurement Equipment
- 8.1.5. RF System
- 8.2. Market Analysis, Insights and Forecast - by Types
- 8.2.1. Linear Amplifier
- 8.2.2. Nonlinear Amplifier
- 8.1. Market Analysis, Insights and Forecast - by Application
- 9. Middle East & Africa Fixed Power Amplifier Analysis, Insights and Forecast, 2020-2032
- 9.1. Market Analysis, Insights and Forecast - by Application
- 9.1.1. Audio Amplification
- 9.1.2. Wireless Communication
- 9.1.3. Medical Equipment
- 9.1.4. Test and Measurement Equipment
- 9.1.5. RF System
- 9.2. Market Analysis, Insights and Forecast - by Types
- 9.2.1. Linear Amplifier
- 9.2.2. Nonlinear Amplifier
- 9.1. Market Analysis, Insights and Forecast - by Application
- 10. Asia Pacific Fixed Power Amplifier Analysis, Insights and Forecast, 2020-2032
- 10.1. Market Analysis, Insights and Forecast - by Application
- 10.1.1. Audio Amplification
- 10.1.2. Wireless Communication
- 10.1.3. Medical Equipment
- 10.1.4. Test and Measurement Equipment
- 10.1.5. RF System
- 10.2. Market Analysis, Insights and Forecast - by Types
- 10.2.1. Linear Amplifier
- 10.2.2. Nonlinear Amplifier
- 10.1. Market Analysis, Insights and Forecast - by Application
- 11. Competitive Analysis
- 11.1. Global Market Share Analysis 2025
- 11.2. Company Profiles
- 11.2.1 Ametek
- 11.2.1.1. Overview
- 11.2.1.2. Products
- 11.2.1.3. SWOT Analysis
- 11.2.1.4. Recent Developments
- 11.2.1.5. Financials (Based on Availability)
- 11.2.2 Qorvo
- 11.2.2.1. Overview
- 11.2.2.2. Products
- 11.2.2.3. SWOT Analysis
- 11.2.2.4. Recent Developments
- 11.2.2.5. Financials (Based on Availability)
- 11.2.3 Advanced Microwave
- 11.2.3.1. Overview
- 11.2.3.2. Products
- 11.2.3.3. SWOT Analysis
- 11.2.3.4. Recent Developments
- 11.2.3.5. Financials (Based on Availability)
- 11.2.4 Advantech Wireless
- 11.2.4.1. Overview
- 11.2.4.2. Products
- 11.2.4.3. SWOT Analysis
- 11.2.4.4. Recent Developments
- 11.2.4.5. Financials (Based on Availability)
- 11.2.5 Jersey Microwave
- 11.2.5.1. Overview
- 11.2.5.2. Products
- 11.2.5.3. SWOT Analysis
- 11.2.5.4. Recent Developments
- 11.2.5.5. Financials (Based on Availability)
- 11.2.6 Beverly Microwave Division (CPI BMD)
- 11.2.6.1. Overview
- 11.2.6.2. Products
- 11.2.6.3. SWOT Analysis
- 11.2.6.4. Recent Developments
- 11.2.6.5. Financials (Based on Availability)
- 11.2.7 Thales Alenia Space
- 11.2.7.1. Overview
- 11.2.7.2. Products
- 11.2.7.3. SWOT Analysis
- 11.2.7.4. Recent Developments
- 11.2.7.5. Financials (Based on Availability)
- 11.2.8 Teledyne Defense Electronics
- 11.2.8.1. Overview
- 11.2.8.2. Products
- 11.2.8.3. SWOT Analysis
- 11.2.8.4. Recent Developments
- 11.2.8.5. Financials (Based on Availability)
- 11.2.9 General Dynamics
- 11.2.9.1. Overview
- 11.2.9.2. Products
- 11.2.9.3. SWOT Analysis
- 11.2.9.4. Recent Developments
- 11.2.9.5. Financials (Based on Availability)
- 11.2.10 Kratos
- 11.2.10.1. Overview
- 11.2.10.2. Products
- 11.2.10.3. SWOT Analysis
- 11.2.10.4. Recent Developments
- 11.2.10.5. Financials (Based on Availability)
- 11.2.11 NEC Space Technologies
- 11.2.11.1. Overview
- 11.2.11.2. Products
- 11.2.11.3. SWOT Analysis
- 11.2.11.4. Recent Developments
- 11.2.11.5. Financials (Based on Availability)
- 11.2.12 Ltd.
- 11.2.12.1. Overview
- 11.2.12.2. Products
- 11.2.12.3. SWOT Analysis
- 11.2.12.4. Recent Developments
- 11.2.12.5. Financials (Based on Availability)
- 11.2.13 Rflight Communication Electronic
- 11.2.13.1. Overview
- 11.2.13.2. Products
- 11.2.13.3. SWOT Analysis
- 11.2.13.4. Recent Developments
- 11.2.13.5. Financials (Based on Availability)
- 11.2.1 Ametek
List of Figures
- Figure 1: Global Fixed Power Amplifier Revenue Breakdown (million, %) by Region 2025 & 2033
- Figure 2: North America Fixed Power Amplifier Revenue (million), by Application 2025 & 2033
- Figure 3: North America Fixed Power Amplifier Revenue Share (%), by Application 2025 & 2033
- Figure 4: North America Fixed Power Amplifier Revenue (million), by Types 2025 & 2033
- Figure 5: North America Fixed Power Amplifier Revenue Share (%), by Types 2025 & 2033
- Figure 6: North America Fixed Power Amplifier Revenue (million), by Country 2025 & 2033
- Figure 7: North America Fixed Power Amplifier Revenue Share (%), by Country 2025 & 2033
- Figure 8: South America Fixed Power Amplifier Revenue (million), by Application 2025 & 2033
- Figure 9: South America Fixed Power Amplifier Revenue Share (%), by Application 2025 & 2033
- Figure 10: South America Fixed Power Amplifier Revenue (million), by Types 2025 & 2033
- Figure 11: South America Fixed Power Amplifier Revenue Share (%), by Types 2025 & 2033
- Figure 12: South America Fixed Power Amplifier Revenue (million), by Country 2025 & 2033
- Figure 13: South America Fixed Power Amplifier Revenue Share (%), by Country 2025 & 2033
- Figure 14: Europe Fixed Power Amplifier Revenue (million), by Application 2025 & 2033
- Figure 15: Europe Fixed Power Amplifier Revenue Share (%), by Application 2025 & 2033
- Figure 16: Europe Fixed Power Amplifier Revenue (million), by Types 2025 & 2033
- Figure 17: Europe Fixed Power Amplifier Revenue Share (%), by Types 2025 & 2033
- Figure 18: Europe Fixed Power Amplifier Revenue (million), by Country 2025 & 2033
- Figure 19: Europe Fixed Power Amplifier Revenue Share (%), by Country 2025 & 2033
- Figure 20: Middle East & Africa Fixed Power Amplifier Revenue (million), by Application 2025 & 2033
- Figure 21: Middle East & Africa Fixed Power Amplifier Revenue Share (%), by Application 2025 & 2033
- Figure 22: Middle East & Africa Fixed Power Amplifier Revenue (million), by Types 2025 & 2033
- Figure 23: Middle East & Africa Fixed Power Amplifier Revenue Share (%), by Types 2025 & 2033
- Figure 24: Middle East & Africa Fixed Power Amplifier Revenue (million), by Country 2025 & 2033
- Figure 25: Middle East & Africa Fixed Power Amplifier Revenue Share (%), by Country 2025 & 2033
- Figure 26: Asia Pacific Fixed Power Amplifier Revenue (million), by Application 2025 & 2033
- Figure 27: Asia Pacific Fixed Power Amplifier Revenue Share (%), by Application 2025 & 2033
- Figure 28: Asia Pacific Fixed Power Amplifier Revenue (million), by Types 2025 & 2033
- Figure 29: Asia Pacific Fixed Power Amplifier Revenue Share (%), by Types 2025 & 2033
- Figure 30: Asia Pacific Fixed Power Amplifier Revenue (million), by Country 2025 & 2033
- Figure 31: Asia Pacific Fixed Power Amplifier Revenue Share (%), by Country 2025 & 2033
List of Tables
- Table 1: Global Fixed Power Amplifier Revenue million Forecast, by Application 2020 & 2033
- Table 2: Global Fixed Power Amplifier Revenue million Forecast, by Types 2020 & 2033
- Table 3: Global Fixed Power Amplifier Revenue million Forecast, by Region 2020 & 2033
- Table 4: Global Fixed Power Amplifier Revenue million Forecast, by Application 2020 & 2033
- Table 5: Global Fixed Power Amplifier Revenue million Forecast, by Types 2020 & 2033
- Table 6: Global Fixed Power Amplifier Revenue million Forecast, by Country 2020 & 2033
- Table 7: United States Fixed Power Amplifier Revenue (million) Forecast, by Application 2020 & 2033
- Table 8: Canada Fixed Power Amplifier Revenue (million) Forecast, by Application 2020 & 2033
- Table 9: Mexico Fixed Power Amplifier Revenue (million) Forecast, by Application 2020 & 2033
- Table 10: Global Fixed Power Amplifier Revenue million Forecast, by Application 2020 & 2033
- Table 11: Global Fixed Power Amplifier Revenue million Forecast, by Types 2020 & 2033
- Table 12: Global Fixed Power Amplifier Revenue million Forecast, by Country 2020 & 2033
- Table 13: Brazil Fixed Power Amplifier Revenue (million) Forecast, by Application 2020 & 2033
- Table 14: Argentina Fixed Power Amplifier Revenue (million) Forecast, by Application 2020 & 2033
- Table 15: Rest of South America Fixed Power Amplifier Revenue (million) Forecast, by Application 2020 & 2033
- Table 16: Global Fixed Power Amplifier Revenue million Forecast, by Application 2020 & 2033
- Table 17: Global Fixed Power Amplifier Revenue million Forecast, by Types 2020 & 2033
- Table 18: Global Fixed Power Amplifier Revenue million Forecast, by Country 2020 & 2033
- Table 19: United Kingdom Fixed Power Amplifier Revenue (million) Forecast, by Application 2020 & 2033
- Table 20: Germany Fixed Power Amplifier Revenue (million) Forecast, by Application 2020 & 2033
- Table 21: France Fixed Power Amplifier Revenue (million) Forecast, by Application 2020 & 2033
- Table 22: Italy Fixed Power Amplifier Revenue (million) Forecast, by Application 2020 & 2033
- Table 23: Spain Fixed Power Amplifier Revenue (million) Forecast, by Application 2020 & 2033
- Table 24: Russia Fixed Power Amplifier Revenue (million) Forecast, by Application 2020 & 2033
- Table 25: Benelux Fixed Power Amplifier Revenue (million) Forecast, by Application 2020 & 2033
- Table 26: Nordics Fixed Power Amplifier Revenue (million) Forecast, by Application 2020 & 2033
- Table 27: Rest of Europe Fixed Power Amplifier Revenue (million) Forecast, by Application 2020 & 2033
- Table 28: Global Fixed Power Amplifier Revenue million Forecast, by Application 2020 & 2033
- Table 29: Global Fixed Power Amplifier Revenue million Forecast, by Types 2020 & 2033
- Table 30: Global Fixed Power Amplifier Revenue million Forecast, by Country 2020 & 2033
- Table 31: Turkey Fixed Power Amplifier Revenue (million) Forecast, by Application 2020 & 2033
- Table 32: Israel Fixed Power Amplifier Revenue (million) Forecast, by Application 2020 & 2033
- Table 33: GCC Fixed Power Amplifier Revenue (million) Forecast, by Application 2020 & 2033
- Table 34: North Africa Fixed Power Amplifier Revenue (million) Forecast, by Application 2020 & 2033
- Table 35: South Africa Fixed Power Amplifier Revenue (million) Forecast, by Application 2020 & 2033
- Table 36: Rest of Middle East & Africa Fixed Power Amplifier Revenue (million) Forecast, by Application 2020 & 2033
- Table 37: Global Fixed Power Amplifier Revenue million Forecast, by Application 2020 & 2033
- Table 38: Global Fixed Power Amplifier Revenue million Forecast, by Types 2020 & 2033
- Table 39: Global Fixed Power Amplifier Revenue million Forecast, by Country 2020 & 2033
- Table 40: China Fixed Power Amplifier Revenue (million) Forecast, by Application 2020 & 2033
- Table 41: India Fixed Power Amplifier Revenue (million) Forecast, by Application 2020 & 2033
- Table 42: Japan Fixed Power Amplifier Revenue (million) Forecast, by Application 2020 & 2033
- Table 43: South Korea Fixed Power Amplifier Revenue (million) Forecast, by Application 2020 & 2033
- Table 44: ASEAN Fixed Power Amplifier Revenue (million) Forecast, by Application 2020 & 2033
- Table 45: Oceania Fixed Power Amplifier Revenue (million) Forecast, by Application 2020 & 2033
- Table 46: Rest of Asia Pacific Fixed Power Amplifier Revenue (million) Forecast, by Application 2020 & 2033
Frequently Asked Questions
1. What is the projected Compound Annual Growth Rate (CAGR) of the Fixed Power Amplifier?
The projected CAGR is approximately 5.1%.
2. Which companies are prominent players in the Fixed Power Amplifier?
Key companies in the market include Ametek, Qorvo, Advanced Microwave, Advantech Wireless, Jersey Microwave, Beverly Microwave Division (CPI BMD), Thales Alenia Space, Teledyne Defense Electronics, General Dynamics, Kratos, NEC Space Technologies, Ltd., Rflight Communication Electronic.
3. What are the main segments of the Fixed Power Amplifier?
The market segments include Application, Types.
4. Can you provide details about the market size?
The market size is estimated to be USD 468 million as of 2022.
5. What are some drivers contributing to market growth?
N/A
6. What are the notable trends driving market growth?
N/A
7. Are there any restraints impacting market growth?
N/A
8. Can you provide examples of recent developments in the market?
N/A
9. What pricing options are available for accessing the report?
Pricing options include single-user, multi-user, and enterprise licenses priced at USD 2900.00, USD 4350.00, and USD 5800.00 respectively.
10. Is the market size provided in terms of value or volume?
The market size is provided in terms of value, measured in million.
11. Are there any specific market keywords associated with the report?
Yes, the market keyword associated with the report is "Fixed Power Amplifier," which aids in identifying and referencing the specific market segment covered.
12. How do I determine which pricing option suits my needs best?
The pricing options vary based on user requirements and access needs. Individual users may opt for single-user licenses, while businesses requiring broader access may choose multi-user or enterprise licenses for cost-effective access to the report.
13. Are there any additional resources or data provided in the Fixed Power Amplifier report?
While the report offers comprehensive insights, it's advisable to review the specific contents or supplementary materials provided to ascertain if additional resources or data are available.
14. How can I stay updated on further developments or reports in the Fixed Power Amplifier?
To stay informed about further developments, trends, and reports in the Fixed Power Amplifier, consider subscribing to industry newsletters, following relevant companies and organizations, or regularly checking reputable industry news sources and publications.
Methodology
Step 1 - Identification of Relevant Samples Size from Population Database


Step 2 - Approaches for Defining Global Market Size (Value, Volume* & Price*)

Note*: In applicable scenarios
Step 3 - Data Sources
Primary Research
- Web Analytics
- Survey Reports
- Research Institute
- Latest Research Reports
- Opinion Leaders
Secondary Research
- Annual Reports
- White Paper
- Latest Press Release
- Industry Association
- Paid Database
- Investor Presentations

Step 4 - Data Triangulation
Involves using different sources of information in order to increase the validity of a study
These sources are likely to be stakeholders in a program - participants, other researchers, program staff, other community members, and so on.
Then we put all data in single framework & apply various statistical tools to find out the dynamic on the market.
During the analysis stage, feedback from the stakeholder groups would be compared to determine areas of agreement as well as areas of divergence