Farm Machinery Industry XX CAGR Growth to Drive Market Size to XXX Million by 2033

Farm Machinery Industry by Production Analysis, by Consumption Analysis, by Import Market Analysis (Value & Volume), by Export Market Analysis (Value & Volume), by Price Trend Analysis, by North America (United States, Canada, Mexico), by South America (Brazil, Argentina, Rest of South America), by Europe (United Kingdom, Germany, France, Italy, Spain, Russia, Benelux, Nordics, Rest of Europe), by Middle East & Africa (Turkey, Israel, GCC, North Africa, South Africa, Rest of Middle East & Africa), by Asia Pacific (China, India, Japan, South Korea, ASEAN, Oceania, Rest of Asia Pacific) Forecast 2025-2033

Jun 29 2025
Base Year: 2024

150 Pages
Main Logo

Farm Machinery Industry XX CAGR Growth to Drive Market Size to XXX Million by 2033


Home
Industries
Agriculture
sponsor image

Tailored for you

  • In-depth Analysis Tailored to Specified Regions or Segments
  • Company Profiles Customized to User Preferences
  • Comprehensive Insights Focused on Specific Segments or Regions
  • Customized Evaluation of Competitive Landscape to Meet Your Needs
  • Tailored Customization to Address Other Specific Requirements
Ask for customization


Key Insights

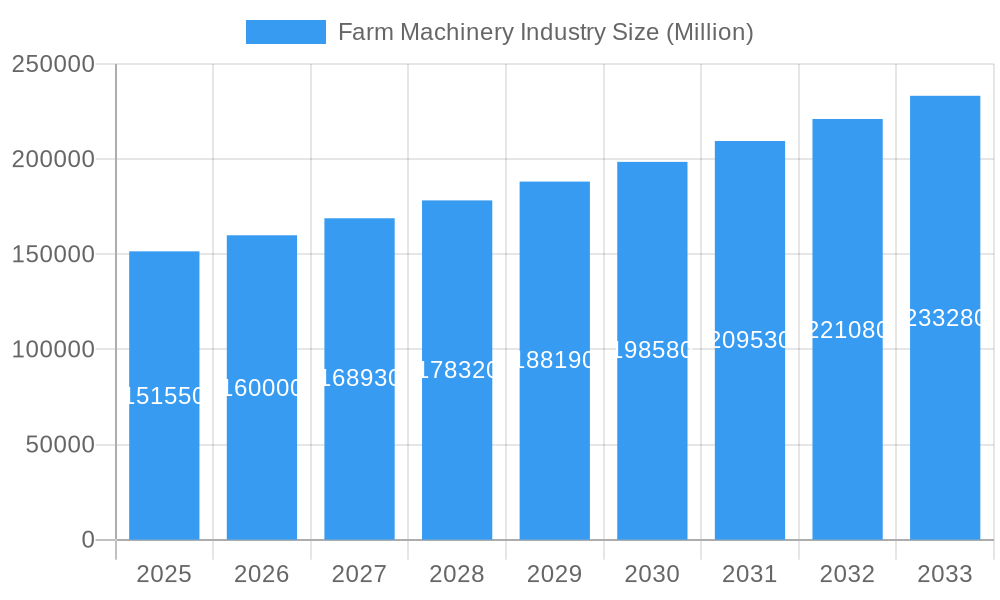
The global farm machinery market, valued at $151.55 billion in 2025, is projected to experience robust growth, driven by a compound annual growth rate (CAGR) of 5.40% from 2025 to 2033. This expansion is fueled by several key factors. Firstly, the rising global population necessitates increased food production, stimulating demand for efficient and technologically advanced farm machinery. Secondly, the increasing adoption of precision farming techniques, including GPS-guided machinery and data-driven decision-making, is boosting market growth. Furthermore, government initiatives promoting agricultural modernization and mechanization in developing economies are contributing to the market's expansion. The market is segmented by machinery type (tractors – including compact utility, utility, and row crop – and plowing & cultivating machinery), horsepower, and geographic region. While tractors dominate the market share, the demand for specialized machinery like plowing and cultivating equipment is also growing significantly, particularly in regions with large-scale farming operations. The increasing adoption of automation and smart technologies within farm machinery will further propel growth.
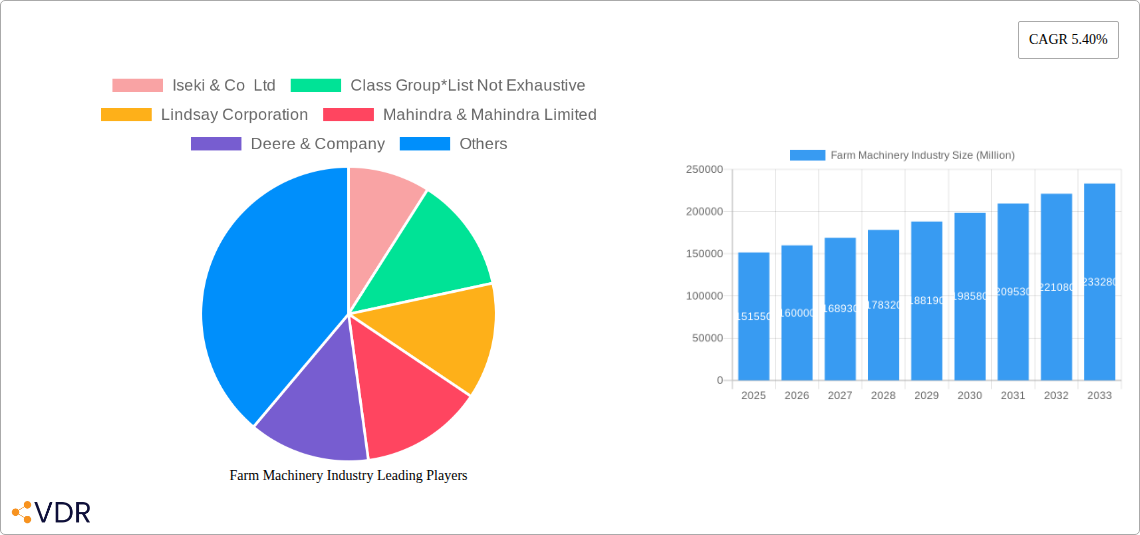
Competition in the farm machinery market is intense, with major players such as Deere & Company, Mahindra & Mahindra Limited, Kubota Corporation, and CNH Industrial NV vying for market share. These companies are focusing on research and development to introduce innovative products with enhanced features, improved fuel efficiency, and advanced technologies. However, factors like high initial investment costs, economic downturns affecting agricultural income, and fluctuating commodity prices could pose challenges to market growth. Despite these constraints, the long-term outlook for the farm machinery market remains positive, with continued growth driven by technological advancements, evolving farming practices, and the global need for enhanced food security. Regional growth will vary, with developing economies in Asia-Pacific and South America exhibiting higher growth rates compared to mature markets in North America and Europe due to increasing mechanization and land expansion.

Farm Machinery Industry Research Report - Market Size, Growth & Forecast

Farm Machinery Industry Market Report: 2019-2033

This comprehensive report provides an in-depth analysis of the global farm machinery industry, encompassing market dynamics, growth trends, regional landscapes, product innovations, and key players. With a study period spanning 2019-2033, a base year of 2025, and a forecast period of 2025-2033, this report offers invaluable insights for industry professionals, investors, and stakeholders. The report analyzes parent markets (agricultural machinery) and child markets (specific machinery types and horsepower ranges) to provide a granular understanding of this dynamic sector. Market values are presented in million units.

Farm Machinery Industry Market Dynamics & Structure

The farm machinery market is characterized by moderate concentration, with several major players holding significant market share. Technological innovation, driven by the need for increased efficiency and sustainability, is a key market driver. Stringent regulatory frameworks regarding emissions and safety standards also shape market dynamics. Competition from alternative technologies, such as drones for crop spraying, presents a challenge. End-user demographics are shifting towards larger, more technologically-advanced farms, influencing demand for higher horsepower machinery. M&A activity in the sector is moderate.

  • Market Concentration: The top 5 players account for approximately xx% of the global market.
  • Technological Innovation: Precision agriculture, automation, and electrification are key drivers of innovation.
  • Regulatory Landscape: Emission regulations and safety standards are increasingly stringent.
  • Competitive Substitutes: Drones, AI-powered systems are emerging as potential substitutes for certain machinery types.
  • M&A Activity: The past five years have seen xx M&A deals with a total value of approximately xx million units.
  • Innovation Barriers: High R&D costs and the need for regulatory approvals pose significant challenges to innovation.

Farm Machinery Industry Growth Trends & Insights

The global farm machinery market experienced steady growth during the historical period (2019-2024), with a CAGR of xx%. This growth is attributed to factors such as increasing farm sizes, rising labor costs, and the growing adoption of precision agriculture technologies. The market size in 2024 was approximately xx million units and is projected to reach xx million units by 2033, exhibiting a CAGR of xx% during the forecast period (2025-2033). Technological disruptions, particularly in automation and electrification, are accelerating market transformation. Consumer behavior is shifting towards preference for efficient, sustainable, and technologically advanced equipment. Market penetration of precision farming technologies is also increasing steadily.

Farm Machinery Industry Growth

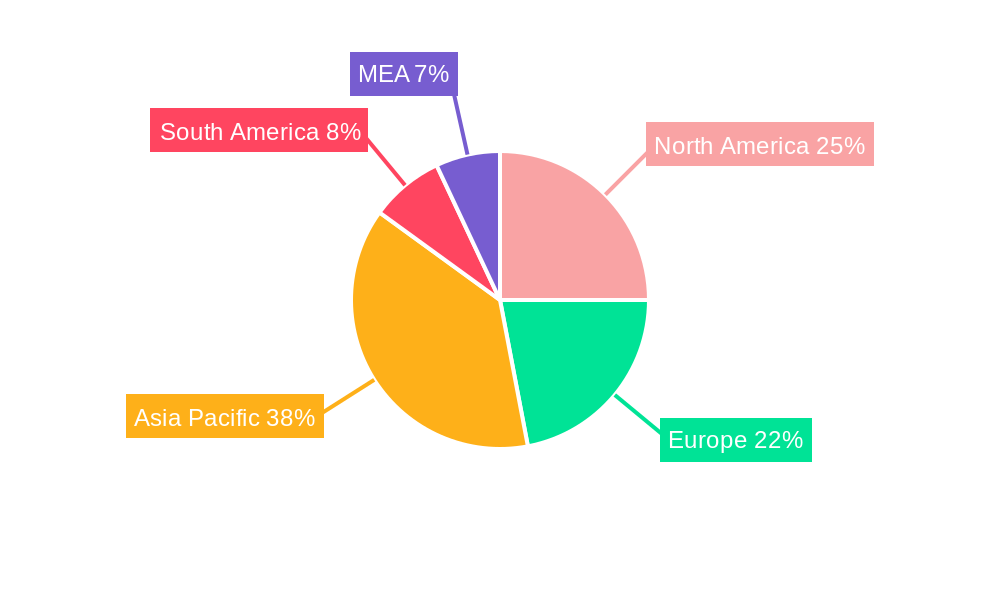
Dominant Regions, Countries, or Segments in Farm Machinery Industry

North America and Europe currently dominate the global farm machinery market, driven by high agricultural output, advanced farming practices, and robust economies. Within these regions, countries such as the United States, Canada, Germany, and France are key contributors. Among the segments, tractors (especially high horsepower models) and plowing and cultivating machinery hold the largest market shares. Growth in emerging economies, particularly in Asia and South America, is also significant, driven by increasing agricultural output and government initiatives to modernize farming techniques.

  • Key Drivers: Government subsidies, favorable climate conditions, and rising disposable incomes in some regions are key drivers of growth.
  • Dominance Factors: Technological advancement, established agricultural infrastructure, and higher purchasing power contribute to regional dominance.
  • Growth Potential: Emerging markets in Asia and South America are expected to exhibit high growth rates in the coming years.

Farm Machinery Industry Product Landscape

The farm machinery market offers a wide range of products, from small compact tractors to large row crop tractors and specialized machinery for various tasks like plowing, planting, harvesting, and spraying. Recent innovations focus on automation, precision agriculture, and sustainability, including GPS-guided systems, autonomous tractors, and electric-powered machinery. The unique selling propositions of these new products involve reduced labor costs, increased efficiency, and enhanced environmental friendliness. Technological advancements are characterized by improved fuel efficiency, enhanced precision, and better connectivity for data analysis and remote monitoring.

Key Drivers, Barriers & Challenges in Farm Machinery Industry

Key Drivers:

  • Increasing demand for food due to population growth
  • Rising labor costs, driving the adoption of automation
  • Growing awareness of sustainable agricultural practices
  • Government support for agricultural modernization

Challenges & Restraints:

  • High initial investment costs for advanced machinery, especially for small farmers.
  • Supply chain disruptions impacting component availability and manufacturing.
  • Fluctuations in commodity prices affecting farmer’s purchasing power.
  • Stringent emission regulations posing manufacturing challenges.

Emerging Opportunities in Farm Machinery Industry

  • Growing demand for precision agriculture solutions.
  • Increased adoption of data analytics and IoT technologies.
  • Expansion into emerging markets with high agricultural potential.
  • Development of sustainable and environmentally friendly equipment.

Growth Accelerators in the Farm Machinery Industry Industry

Technological advancements in automation, artificial intelligence, and electrification are set to accelerate the growth trajectory. Strategic partnerships between machinery manufacturers and technology providers are fostering innovation and expanding market reach. Continued government investments in agricultural modernization and favorable economic conditions across several regions further contribute to accelerated growth.

Key Players Shaping the Farm Machinery Industry Market

  • Iseki & Co Ltd
  • Class Group List Not Exhaustive
  • Lindsay Corporation
  • Mahindra & Mahindra Limited
  • Deere & Company
  • Daedong Industrial Co Ltd
  • CNH Industrial NV
  • Kubota Corporation
  • JC Bamford Excavators Limited
  • AGCO Corporation

Notable Milestones in Farm Machinery Industry Sector

  • February 2024: John Deere and GUSS Automation unveiled the Electric GUSS, the world's first fully electric autonomous herbicide orchard sprayer, showcasing advancements in sustainable agriculture.
  • February 2024: John Deere launched autonomy-ready tractors and weed-sensing sprayers at the Commodity Classic, highlighting a commitment to precision agriculture and increased efficiency.
  • February 2024: Mahindra introduced new sub-compact and compact tractor models, focusing on improved user experience and enhanced features.

In-Depth Farm Machinery Industry Market Outlook

The farm machinery market is poised for sustained growth, fueled by technological innovation and expanding global demand for food. Opportunities abound in the development of autonomous systems, electric-powered machinery, and data-driven precision agriculture solutions. Strategic partnerships, investments in R&D, and expansion into new markets will be crucial for players to capitalize on the significant potential of this evolving sector.

Farm Machinery Industry Segmentation

  • 1. Production Analysis
  • 2. Consumption Analysis
  • 3. Import Market Analysis (Value & Volume)
  • 4. Export Market Analysis (Value & Volume)
  • 5. Price Trend Analysis

Farm Machinery Industry Segmentation By Geography

  • 1. North America
    • 1.1. United States
    • 1.2. Canada
    • 1.3. Mexico
  • 2. South America
    • 2.1. Brazil
    • 2.2. Argentina
    • 2.3. Rest of South America
  • 3. Europe
    • 3.1. United Kingdom
    • 3.2. Germany
    • 3.3. France
    • 3.4. Italy
    • 3.5. Spain
    • 3.6. Russia
    • 3.7. Benelux
    • 3.8. Nordics
    • 3.9. Rest of Europe
  • 4. Middle East & Africa
    • 4.1. Turkey
    • 4.2. Israel
    • 4.3. GCC
    • 4.4. North Africa
    • 4.5. South Africa
    • 4.6. Rest of Middle East & Africa
  • 5. Asia Pacific
    • 5.1. China
    • 5.2. India
    • 5.3. Japan
    • 5.4. South Korea
    • 5.5. ASEAN
    • 5.6. Oceania
    • 5.7. Rest of Asia Pacific
Farm Machinery Industry Regional Share


Farm Machinery Industry REPORT HIGHLIGHTS

AspectsDetails
Study Period 2019-2033
Base Year 2024
Estimated Year 2025
Forecast Period2025-2033
Historical Period2019-2024
Growth RateCAGR of 5.40% from 2019-2033
Segmentation
    • By Production Analysis
    • By Consumption Analysis
    • By Import Market Analysis (Value & Volume)
    • By Export Market Analysis (Value & Volume)
    • By Price Trend Analysis
  • By Geography
    • North America
      • United States
      • Canada
      • Mexico
    • South America
      • Brazil
      • Argentina
      • Rest of South America
    • Europe
      • United Kingdom
      • Germany
      • France
      • Italy
      • Spain
      • Russia
      • Benelux
      • Nordics
      • Rest of Europe
    • Middle East & Africa
      • Turkey
      • Israel
      • GCC
      • North Africa
      • South Africa
      • Rest of Middle East & Africa
    • Asia Pacific
      • China
      • India
      • Japan
      • South Korea
      • ASEAN
      • Oceania
      • Rest of Asia Pacific


Table of Contents

  1. 1. Introduction
    • 1.1. Research Scope
    • 1.2. Market Segmentation
    • 1.3. Research Methodology
    • 1.4. Definitions and Assumptions
  2. 2. Executive Summary
    • 2.1. Introduction
  3. 3. Market Dynamics
    • 3.1. Introduction
      • 3.2. Market Drivers
        • 3.2.1. Low Availability of Skilled Labor; Technological Advancements
      • 3.3. Market Restrains
        • 3.3.1. Increasing Farm Expenditure; Security Concerns in Modern Farming Machinery
      • 3.4. Market Trends
        • 3.4.1. Low Availability of Skilled Labor
  4. 4. Market Factor Analysis
    • 4.1. Porters Five Forces
    • 4.2. Supply/Value Chain
    • 4.3. PESTEL analysis
    • 4.4. Market Entropy
    • 4.5. Patent/Trademark Analysis
  5. 5. Global Farm Machinery Industry Analysis, Insights and Forecast, 2019-2031
    • 5.1. Market Analysis, Insights and Forecast - by Production Analysis
      • 5.2. Market Analysis, Insights and Forecast - by Consumption Analysis
        • 5.3. Market Analysis, Insights and Forecast - by Import Market Analysis (Value & Volume)
          • 5.4. Market Analysis, Insights and Forecast - by Export Market Analysis (Value & Volume)
            • 5.5. Market Analysis, Insights and Forecast - by Price Trend Analysis
              • 5.6. Market Analysis, Insights and Forecast - by Region
                • 5.6.1. North America
                • 5.6.2. South America
                • 5.6.3. Europe
                • 5.6.4. Middle East & Africa
                • 5.6.5. Asia Pacific
            • 6. North America Farm Machinery Industry Analysis, Insights and Forecast, 2019-2031
              • 6.1. Market Analysis, Insights and Forecast - by Production Analysis
                • 6.2. Market Analysis, Insights and Forecast - by Consumption Analysis
                  • 6.3. Market Analysis, Insights and Forecast - by Import Market Analysis (Value & Volume)
                    • 6.4. Market Analysis, Insights and Forecast - by Export Market Analysis (Value & Volume)
                      • 6.5. Market Analysis, Insights and Forecast - by Price Trend Analysis
                      • 7. South America Farm Machinery Industry Analysis, Insights and Forecast, 2019-2031
                        • 7.1. Market Analysis, Insights and Forecast - by Production Analysis
                          • 7.2. Market Analysis, Insights and Forecast - by Consumption Analysis
                            • 7.3. Market Analysis, Insights and Forecast - by Import Market Analysis (Value & Volume)
                              • 7.4. Market Analysis, Insights and Forecast - by Export Market Analysis (Value & Volume)
                                • 7.5. Market Analysis, Insights and Forecast - by Price Trend Analysis
                                • 8. Europe Farm Machinery Industry Analysis, Insights and Forecast, 2019-2031
                                  • 8.1. Market Analysis, Insights and Forecast - by Production Analysis
                                    • 8.2. Market Analysis, Insights and Forecast - by Consumption Analysis
                                      • 8.3. Market Analysis, Insights and Forecast - by Import Market Analysis (Value & Volume)
                                        • 8.4. Market Analysis, Insights and Forecast - by Export Market Analysis (Value & Volume)
                                          • 8.5. Market Analysis, Insights and Forecast - by Price Trend Analysis
                                          • 9. Middle East & Africa Farm Machinery Industry Analysis, Insights and Forecast, 2019-2031
                                            • 9.1. Market Analysis, Insights and Forecast - by Production Analysis
                                              • 9.2. Market Analysis, Insights and Forecast - by Consumption Analysis
                                                • 9.3. Market Analysis, Insights and Forecast - by Import Market Analysis (Value & Volume)
                                                  • 9.4. Market Analysis, Insights and Forecast - by Export Market Analysis (Value & Volume)
                                                    • 9.5. Market Analysis, Insights and Forecast - by Price Trend Analysis
                                                    • 10. Asia Pacific Farm Machinery Industry Analysis, Insights and Forecast, 2019-2031
                                                      • 10.1. Market Analysis, Insights and Forecast - by Production Analysis
                                                        • 10.2. Market Analysis, Insights and Forecast - by Consumption Analysis
                                                          • 10.3. Market Analysis, Insights and Forecast - by Import Market Analysis (Value & Volume)
                                                            • 10.4. Market Analysis, Insights and Forecast - by Export Market Analysis (Value & Volume)
                                                              • 10.5. Market Analysis, Insights and Forecast - by Price Trend Analysis
                                                              • 11. North America Farm Machinery Industry Analysis, Insights and Forecast, 2019-2031
                                                                  • 11.1. Market Analysis, Insights and Forecast - By Country/Sub-region
                                                                    • 11.1.1 United States
                                                                    • 11.1.2 Canada
                                                                    • 11.1.3 Mexico
                                                              • 12. Europe Farm Machinery Industry Analysis, Insights and Forecast, 2019-2031
                                                                  • 12.1. Market Analysis, Insights and Forecast - By Country/Sub-region
                                                                    • 12.1.1 Germany
                                                                    • 12.1.2 United Kingdom
                                                                    • 12.1.3 France
                                                                    • 12.1.4 Spain
                                                                    • 12.1.5 Italy
                                                                    • 12.1.6 Spain
                                                                    • 12.1.7 Belgium
                                                                    • 12.1.8 Netherland
                                                                    • 12.1.9 Nordics
                                                                    • 12.1.10 Rest of Europe
                                                              • 13. Asia Pacific Farm Machinery Industry Analysis, Insights and Forecast, 2019-2031
                                                                  • 13.1. Market Analysis, Insights and Forecast - By Country/Sub-region
                                                                    • 13.1.1 China
                                                                    • 13.1.2 Japan
                                                                    • 13.1.3 India
                                                                    • 13.1.4 South Korea
                                                                    • 13.1.5 Southeast Asia
                                                                    • 13.1.6 Australia
                                                                    • 13.1.7 Indonesia
                                                                    • 13.1.8 Phillipes
                                                                    • 13.1.9 Singapore
                                                                    • 13.1.10 Thailandc
                                                                    • 13.1.11 Rest of Asia Pacific
                                                              • 14. South America Farm Machinery Industry Analysis, Insights and Forecast, 2019-2031
                                                                  • 14.1. Market Analysis, Insights and Forecast - By Country/Sub-region
                                                                    • 14.1.1 Brazil
                                                                    • 14.1.2 Argentina
                                                                    • 14.1.3 Peru
                                                                    • 14.1.4 Chile
                                                                    • 14.1.5 Colombia
                                                                    • 14.1.6 Ecuador
                                                                    • 14.1.7 Venezuela
                                                                    • 14.1.8 Rest of South America
                                                              • 15. MEA Farm Machinery Industry Analysis, Insights and Forecast, 2019-2031
                                                                  • 15.1. Market Analysis, Insights and Forecast - By Country/Sub-region
                                                                    • 15.1.1 United Arab Emirates
                                                                    • 15.1.2 Saudi Arabia
                                                                    • 15.1.3 South Africa
                                                                    • 15.1.4 Rest of Middle East and Africa
                                                              • 16. Competitive Analysis
                                                                • 16.1. Global Market Share Analysis 2024
                                                                  • 16.2. Company Profiles
                                                                    • 16.2.1 Iseki & Co Ltd
                                                                      • 16.2.1.1. Overview
                                                                      • 16.2.1.2. Products
                                                                      • 16.2.1.3. SWOT Analysis
                                                                      • 16.2.1.4. Recent Developments
                                                                      • 16.2.1.5. Financials (Based on Availability)
                                                                    • 16.2.2 Class Group*List Not Exhaustive
                                                                      • 16.2.2.1. Overview
                                                                      • 16.2.2.2. Products
                                                                      • 16.2.2.3. SWOT Analysis
                                                                      • 16.2.2.4. Recent Developments
                                                                      • 16.2.2.5. Financials (Based on Availability)
                                                                    • 16.2.3 Lindsay Corporation
                                                                      • 16.2.3.1. Overview
                                                                      • 16.2.3.2. Products
                                                                      • 16.2.3.3. SWOT Analysis
                                                                      • 16.2.3.4. Recent Developments
                                                                      • 16.2.3.5. Financials (Based on Availability)
                                                                    • 16.2.4 Mahindra & Mahindra Limited
                                                                      • 16.2.4.1. Overview
                                                                      • 16.2.4.2. Products
                                                                      • 16.2.4.3. SWOT Analysis
                                                                      • 16.2.4.4. Recent Developments
                                                                      • 16.2.4.5. Financials (Based on Availability)
                                                                    • 16.2.5 Deere & Company
                                                                      • 16.2.5.1. Overview
                                                                      • 16.2.5.2. Products
                                                                      • 16.2.5.3. SWOT Analysis
                                                                      • 16.2.5.4. Recent Developments
                                                                      • 16.2.5.5. Financials (Based on Availability)
                                                                    • 16.2.6 Daedong Industrial Co Ltd
                                                                      • 16.2.6.1. Overview
                                                                      • 16.2.6.2. Products
                                                                      • 16.2.6.3. SWOT Analysis
                                                                      • 16.2.6.4. Recent Developments
                                                                      • 16.2.6.5. Financials (Based on Availability)
                                                                    • 16.2.7 CNH Industrial NV
                                                                      • 16.2.7.1. Overview
                                                                      • 16.2.7.2. Products
                                                                      • 16.2.7.3. SWOT Analysis
                                                                      • 16.2.7.4. Recent Developments
                                                                      • 16.2.7.5. Financials (Based on Availability)
                                                                    • 16.2.8 Kubota Corporation
                                                                      • 16.2.8.1. Overview
                                                                      • 16.2.8.2. Products
                                                                      • 16.2.8.3. SWOT Analysis
                                                                      • 16.2.8.4. Recent Developments
                                                                      • 16.2.8.5. Financials (Based on Availability)
                                                                    • 16.2.9 JC Bamford Excavators Limited
                                                                      • 16.2.9.1. Overview
                                                                      • 16.2.9.2. Products
                                                                      • 16.2.9.3. SWOT Analysis
                                                                      • 16.2.9.4. Recent Developments
                                                                      • 16.2.9.5. Financials (Based on Availability)
                                                                    • 16.2.10 AGCO Corporation
                                                                      • 16.2.10.1. Overview
                                                                      • 16.2.10.2. Products
                                                                      • 16.2.10.3. SWOT Analysis
                                                                      • 16.2.10.4. Recent Developments
                                                                      • 16.2.10.5. Financials (Based on Availability)

                                                              List of Figures

                                                              1. Figure 1: Global Farm Machinery Industry Revenue Breakdown (Million, %) by Region 2024 & 2032
                                                              2. Figure 2: North America Farm Machinery Industry Revenue (Million), by Country 2024 & 2032
                                                              3. Figure 3: North America Farm Machinery Industry Revenue Share (%), by Country 2024 & 2032
                                                              4. Figure 4: Europe Farm Machinery Industry Revenue (Million), by Country 2024 & 2032
                                                              5. Figure 5: Europe Farm Machinery Industry Revenue Share (%), by Country 2024 & 2032
                                                              6. Figure 6: Asia Pacific Farm Machinery Industry Revenue (Million), by Country 2024 & 2032
                                                              7. Figure 7: Asia Pacific Farm Machinery Industry Revenue Share (%), by Country 2024 & 2032
                                                              8. Figure 8: South America Farm Machinery Industry Revenue (Million), by Country 2024 & 2032
                                                              9. Figure 9: South America Farm Machinery Industry Revenue Share (%), by Country 2024 & 2032
                                                              10. Figure 10: MEA Farm Machinery Industry Revenue (Million), by Country 2024 & 2032
                                                              11. Figure 11: MEA Farm Machinery Industry Revenue Share (%), by Country 2024 & 2032
                                                              12. Figure 12: North America Farm Machinery Industry Revenue (Million), by Production Analysis 2024 & 2032
                                                              13. Figure 13: North America Farm Machinery Industry Revenue Share (%), by Production Analysis 2024 & 2032
                                                              14. Figure 14: North America Farm Machinery Industry Revenue (Million), by Consumption Analysis 2024 & 2032
                                                              15. Figure 15: North America Farm Machinery Industry Revenue Share (%), by Consumption Analysis 2024 & 2032
                                                              16. Figure 16: North America Farm Machinery Industry Revenue (Million), by Import Market Analysis (Value & Volume) 2024 & 2032
                                                              17. Figure 17: North America Farm Machinery Industry Revenue Share (%), by Import Market Analysis (Value & Volume) 2024 & 2032
                                                              18. Figure 18: North America Farm Machinery Industry Revenue (Million), by Export Market Analysis (Value & Volume) 2024 & 2032
                                                              19. Figure 19: North America Farm Machinery Industry Revenue Share (%), by Export Market Analysis (Value & Volume) 2024 & 2032
                                                              20. Figure 20: North America Farm Machinery Industry Revenue (Million), by Price Trend Analysis 2024 & 2032
                                                              21. Figure 21: North America Farm Machinery Industry Revenue Share (%), by Price Trend Analysis 2024 & 2032
                                                              22. Figure 22: North America Farm Machinery Industry Revenue (Million), by Country 2024 & 2032
                                                              23. Figure 23: North America Farm Machinery Industry Revenue Share (%), by Country 2024 & 2032
                                                              24. Figure 24: South America Farm Machinery Industry Revenue (Million), by Production Analysis 2024 & 2032
                                                              25. Figure 25: South America Farm Machinery Industry Revenue Share (%), by Production Analysis 2024 & 2032
                                                              26. Figure 26: South America Farm Machinery Industry Revenue (Million), by Consumption Analysis 2024 & 2032
                                                              27. Figure 27: South America Farm Machinery Industry Revenue Share (%), by Consumption Analysis 2024 & 2032
                                                              28. Figure 28: South America Farm Machinery Industry Revenue (Million), by Import Market Analysis (Value & Volume) 2024 & 2032
                                                              29. Figure 29: South America Farm Machinery Industry Revenue Share (%), by Import Market Analysis (Value & Volume) 2024 & 2032
                                                              30. Figure 30: South America Farm Machinery Industry Revenue (Million), by Export Market Analysis (Value & Volume) 2024 & 2032
                                                              31. Figure 31: South America Farm Machinery Industry Revenue Share (%), by Export Market Analysis (Value & Volume) 2024 & 2032
                                                              32. Figure 32: South America Farm Machinery Industry Revenue (Million), by Price Trend Analysis 2024 & 2032
                                                              33. Figure 33: South America Farm Machinery Industry Revenue Share (%), by Price Trend Analysis 2024 & 2032
                                                              34. Figure 34: South America Farm Machinery Industry Revenue (Million), by Country 2024 & 2032
                                                              35. Figure 35: South America Farm Machinery Industry Revenue Share (%), by Country 2024 & 2032
                                                              36. Figure 36: Europe Farm Machinery Industry Revenue (Million), by Production Analysis 2024 & 2032
                                                              37. Figure 37: Europe Farm Machinery Industry Revenue Share (%), by Production Analysis 2024 & 2032
                                                              38. Figure 38: Europe Farm Machinery Industry Revenue (Million), by Consumption Analysis 2024 & 2032
                                                              39. Figure 39: Europe Farm Machinery Industry Revenue Share (%), by Consumption Analysis 2024 & 2032
                                                              40. Figure 40: Europe Farm Machinery Industry Revenue (Million), by Import Market Analysis (Value & Volume) 2024 & 2032
                                                              41. Figure 41: Europe Farm Machinery Industry Revenue Share (%), by Import Market Analysis (Value & Volume) 2024 & 2032
                                                              42. Figure 42: Europe Farm Machinery Industry Revenue (Million), by Export Market Analysis (Value & Volume) 2024 & 2032
                                                              43. Figure 43: Europe Farm Machinery Industry Revenue Share (%), by Export Market Analysis (Value & Volume) 2024 & 2032
                                                              44. Figure 44: Europe Farm Machinery Industry Revenue (Million), by Price Trend Analysis 2024 & 2032
                                                              45. Figure 45: Europe Farm Machinery Industry Revenue Share (%), by Price Trend Analysis 2024 & 2032
                                                              46. Figure 46: Europe Farm Machinery Industry Revenue (Million), by Country 2024 & 2032
                                                              47. Figure 47: Europe Farm Machinery Industry Revenue Share (%), by Country 2024 & 2032
                                                              48. Figure 48: Middle East & Africa Farm Machinery Industry Revenue (Million), by Production Analysis 2024 & 2032
                                                              49. Figure 49: Middle East & Africa Farm Machinery Industry Revenue Share (%), by Production Analysis 2024 & 2032
                                                              50. Figure 50: Middle East & Africa Farm Machinery Industry Revenue (Million), by Consumption Analysis 2024 & 2032
                                                              51. Figure 51: Middle East & Africa Farm Machinery Industry Revenue Share (%), by Consumption Analysis 2024 & 2032
                                                              52. Figure 52: Middle East & Africa Farm Machinery Industry Revenue (Million), by Import Market Analysis (Value & Volume) 2024 & 2032
                                                              53. Figure 53: Middle East & Africa Farm Machinery Industry Revenue Share (%), by Import Market Analysis (Value & Volume) 2024 & 2032
                                                              54. Figure 54: Middle East & Africa Farm Machinery Industry Revenue (Million), by Export Market Analysis (Value & Volume) 2024 & 2032
                                                              55. Figure 55: Middle East & Africa Farm Machinery Industry Revenue Share (%), by Export Market Analysis (Value & Volume) 2024 & 2032
                                                              56. Figure 56: Middle East & Africa Farm Machinery Industry Revenue (Million), by Price Trend Analysis 2024 & 2032
                                                              57. Figure 57: Middle East & Africa Farm Machinery Industry Revenue Share (%), by Price Trend Analysis 2024 & 2032
                                                              58. Figure 58: Middle East & Africa Farm Machinery Industry Revenue (Million), by Country 2024 & 2032
                                                              59. Figure 59: Middle East & Africa Farm Machinery Industry Revenue Share (%), by Country 2024 & 2032
                                                              60. Figure 60: Asia Pacific Farm Machinery Industry Revenue (Million), by Production Analysis 2024 & 2032
                                                              61. Figure 61: Asia Pacific Farm Machinery Industry Revenue Share (%), by Production Analysis 2024 & 2032
                                                              62. Figure 62: Asia Pacific Farm Machinery Industry Revenue (Million), by Consumption Analysis 2024 & 2032
                                                              63. Figure 63: Asia Pacific Farm Machinery Industry Revenue Share (%), by Consumption Analysis 2024 & 2032
                                                              64. Figure 64: Asia Pacific Farm Machinery Industry Revenue (Million), by Import Market Analysis (Value & Volume) 2024 & 2032
                                                              65. Figure 65: Asia Pacific Farm Machinery Industry Revenue Share (%), by Import Market Analysis (Value & Volume) 2024 & 2032
                                                              66. Figure 66: Asia Pacific Farm Machinery Industry Revenue (Million), by Export Market Analysis (Value & Volume) 2024 & 2032
                                                              67. Figure 67: Asia Pacific Farm Machinery Industry Revenue Share (%), by Export Market Analysis (Value & Volume) 2024 & 2032
                                                              68. Figure 68: Asia Pacific Farm Machinery Industry Revenue (Million), by Price Trend Analysis 2024 & 2032
                                                              69. Figure 69: Asia Pacific Farm Machinery Industry Revenue Share (%), by Price Trend Analysis 2024 & 2032
                                                              70. Figure 70: Asia Pacific Farm Machinery Industry Revenue (Million), by Country 2024 & 2032
                                                              71. Figure 71: Asia Pacific Farm Machinery Industry Revenue Share (%), by Country 2024 & 2032

                                                              List of Tables

                                                              1. Table 1: Global Farm Machinery Industry Revenue Million Forecast, by Region 2019 & 2032
                                                              2. Table 2: Global Farm Machinery Industry Revenue Million Forecast, by Production Analysis 2019 & 2032
                                                              3. Table 3: Global Farm Machinery Industry Revenue Million Forecast, by Consumption Analysis 2019 & 2032
                                                              4. Table 4: Global Farm Machinery Industry Revenue Million Forecast, by Import Market Analysis (Value & Volume) 2019 & 2032
                                                              5. Table 5: Global Farm Machinery Industry Revenue Million Forecast, by Export Market Analysis (Value & Volume) 2019 & 2032
                                                              6. Table 6: Global Farm Machinery Industry Revenue Million Forecast, by Price Trend Analysis 2019 & 2032
                                                              7. Table 7: Global Farm Machinery Industry Revenue Million Forecast, by Region 2019 & 2032
                                                              8. Table 8: Global Farm Machinery Industry Revenue Million Forecast, by Country 2019 & 2032
                                                              9. Table 9: United States Farm Machinery Industry Revenue (Million) Forecast, by Application 2019 & 2032
                                                              10. Table 10: Canada Farm Machinery Industry Revenue (Million) Forecast, by Application 2019 & 2032
                                                              11. Table 11: Mexico Farm Machinery Industry Revenue (Million) Forecast, by Application 2019 & 2032
                                                              12. Table 12: Global Farm Machinery Industry Revenue Million Forecast, by Country 2019 & 2032
                                                              13. Table 13: Germany Farm Machinery Industry Revenue (Million) Forecast, by Application 2019 & 2032
                                                              14. Table 14: United Kingdom Farm Machinery Industry Revenue (Million) Forecast, by Application 2019 & 2032
                                                              15. Table 15: France Farm Machinery Industry Revenue (Million) Forecast, by Application 2019 & 2032
                                                              16. Table 16: Spain Farm Machinery Industry Revenue (Million) Forecast, by Application 2019 & 2032
                                                              17. Table 17: Italy Farm Machinery Industry Revenue (Million) Forecast, by Application 2019 & 2032
                                                              18. Table 18: Spain Farm Machinery Industry Revenue (Million) Forecast, by Application 2019 & 2032
                                                              19. Table 19: Belgium Farm Machinery Industry Revenue (Million) Forecast, by Application 2019 & 2032
                                                              20. Table 20: Netherland Farm Machinery Industry Revenue (Million) Forecast, by Application 2019 & 2032
                                                              21. Table 21: Nordics Farm Machinery Industry Revenue (Million) Forecast, by Application 2019 & 2032
                                                              22. Table 22: Rest of Europe Farm Machinery Industry Revenue (Million) Forecast, by Application 2019 & 2032
                                                              23. Table 23: Global Farm Machinery Industry Revenue Million Forecast, by Country 2019 & 2032
                                                              24. Table 24: China Farm Machinery Industry Revenue (Million) Forecast, by Application 2019 & 2032
                                                              25. Table 25: Japan Farm Machinery Industry Revenue (Million) Forecast, by Application 2019 & 2032
                                                              26. Table 26: India Farm Machinery Industry Revenue (Million) Forecast, by Application 2019 & 2032
                                                              27. Table 27: South Korea Farm Machinery Industry Revenue (Million) Forecast, by Application 2019 & 2032
                                                              28. Table 28: Southeast Asia Farm Machinery Industry Revenue (Million) Forecast, by Application 2019 & 2032
                                                              29. Table 29: Australia Farm Machinery Industry Revenue (Million) Forecast, by Application 2019 & 2032
                                                              30. Table 30: Indonesia Farm Machinery Industry Revenue (Million) Forecast, by Application 2019 & 2032
                                                              31. Table 31: Phillipes Farm Machinery Industry Revenue (Million) Forecast, by Application 2019 & 2032
                                                              32. Table 32: Singapore Farm Machinery Industry Revenue (Million) Forecast, by Application 2019 & 2032
                                                              33. Table 33: Thailandc Farm Machinery Industry Revenue (Million) Forecast, by Application 2019 & 2032
                                                              34. Table 34: Rest of Asia Pacific Farm Machinery Industry Revenue (Million) Forecast, by Application 2019 & 2032
                                                              35. Table 35: Global Farm Machinery Industry Revenue Million Forecast, by Country 2019 & 2032
                                                              36. Table 36: Brazil Farm Machinery Industry Revenue (Million) Forecast, by Application 2019 & 2032
                                                              37. Table 37: Argentina Farm Machinery Industry Revenue (Million) Forecast, by Application 2019 & 2032
                                                              38. Table 38: Peru Farm Machinery Industry Revenue (Million) Forecast, by Application 2019 & 2032
                                                              39. Table 39: Chile Farm Machinery Industry Revenue (Million) Forecast, by Application 2019 & 2032
                                                              40. Table 40: Colombia Farm Machinery Industry Revenue (Million) Forecast, by Application 2019 & 2032
                                                              41. Table 41: Ecuador Farm Machinery Industry Revenue (Million) Forecast, by Application 2019 & 2032
                                                              42. Table 42: Venezuela Farm Machinery Industry Revenue (Million) Forecast, by Application 2019 & 2032
                                                              43. Table 43: Rest of South America Farm Machinery Industry Revenue (Million) Forecast, by Application 2019 & 2032
                                                              44. Table 44: Global Farm Machinery Industry Revenue Million Forecast, by Country 2019 & 2032
                                                              45. Table 45: United Arab Emirates Farm Machinery Industry Revenue (Million) Forecast, by Application 2019 & 2032
                                                              46. Table 46: Saudi Arabia Farm Machinery Industry Revenue (Million) Forecast, by Application 2019 & 2032
                                                              47. Table 47: South Africa Farm Machinery Industry Revenue (Million) Forecast, by Application 2019 & 2032
                                                              48. Table 48: Rest of Middle East and Africa Farm Machinery Industry Revenue (Million) Forecast, by Application 2019 & 2032
                                                              49. Table 49: Global Farm Machinery Industry Revenue Million Forecast, by Production Analysis 2019 & 2032
                                                              50. Table 50: Global Farm Machinery Industry Revenue Million Forecast, by Consumption Analysis 2019 & 2032
                                                              51. Table 51: Global Farm Machinery Industry Revenue Million Forecast, by Import Market Analysis (Value & Volume) 2019 & 2032
                                                              52. Table 52: Global Farm Machinery Industry Revenue Million Forecast, by Export Market Analysis (Value & Volume) 2019 & 2032
                                                              53. Table 53: Global Farm Machinery Industry Revenue Million Forecast, by Price Trend Analysis 2019 & 2032
                                                              54. Table 54: Global Farm Machinery Industry Revenue Million Forecast, by Country 2019 & 2032
                                                              55. Table 55: United States Farm Machinery Industry Revenue (Million) Forecast, by Application 2019 & 2032
                                                              56. Table 56: Canada Farm Machinery Industry Revenue (Million) Forecast, by Application 2019 & 2032
                                                              57. Table 57: Mexico Farm Machinery Industry Revenue (Million) Forecast, by Application 2019 & 2032
                                                              58. Table 58: Global Farm Machinery Industry Revenue Million Forecast, by Production Analysis 2019 & 2032
                                                              59. Table 59: Global Farm Machinery Industry Revenue Million Forecast, by Consumption Analysis 2019 & 2032
                                                              60. Table 60: Global Farm Machinery Industry Revenue Million Forecast, by Import Market Analysis (Value & Volume) 2019 & 2032
                                                              61. Table 61: Global Farm Machinery Industry Revenue Million Forecast, by Export Market Analysis (Value & Volume) 2019 & 2032
                                                              62. Table 62: Global Farm Machinery Industry Revenue Million Forecast, by Price Trend Analysis 2019 & 2032
                                                              63. Table 63: Global Farm Machinery Industry Revenue Million Forecast, by Country 2019 & 2032
                                                              64. Table 64: Brazil Farm Machinery Industry Revenue (Million) Forecast, by Application 2019 & 2032
                                                              65. Table 65: Argentina Farm Machinery Industry Revenue (Million) Forecast, by Application 2019 & 2032
                                                              66. Table 66: Rest of South America Farm Machinery Industry Revenue (Million) Forecast, by Application 2019 & 2032
                                                              67. Table 67: Global Farm Machinery Industry Revenue Million Forecast, by Production Analysis 2019 & 2032
                                                              68. Table 68: Global Farm Machinery Industry Revenue Million Forecast, by Consumption Analysis 2019 & 2032
                                                              69. Table 69: Global Farm Machinery Industry Revenue Million Forecast, by Import Market Analysis (Value & Volume) 2019 & 2032
                                                              70. Table 70: Global Farm Machinery Industry Revenue Million Forecast, by Export Market Analysis (Value & Volume) 2019 & 2032
                                                              71. Table 71: Global Farm Machinery Industry Revenue Million Forecast, by Price Trend Analysis 2019 & 2032
                                                              72. Table 72: Global Farm Machinery Industry Revenue Million Forecast, by Country 2019 & 2032
                                                              73. Table 73: United Kingdom Farm Machinery Industry Revenue (Million) Forecast, by Application 2019 & 2032
                                                              74. Table 74: Germany Farm Machinery Industry Revenue (Million) Forecast, by Application 2019 & 2032
                                                              75. Table 75: France Farm Machinery Industry Revenue (Million) Forecast, by Application 2019 & 2032
                                                              76. Table 76: Italy Farm Machinery Industry Revenue (Million) Forecast, by Application 2019 & 2032
                                                              77. Table 77: Spain Farm Machinery Industry Revenue (Million) Forecast, by Application 2019 & 2032
                                                              78. Table 78: Russia Farm Machinery Industry Revenue (Million) Forecast, by Application 2019 & 2032
                                                              79. Table 79: Benelux Farm Machinery Industry Revenue (Million) Forecast, by Application 2019 & 2032
                                                              80. Table 80: Nordics Farm Machinery Industry Revenue (Million) Forecast, by Application 2019 & 2032
                                                              81. Table 81: Rest of Europe Farm Machinery Industry Revenue (Million) Forecast, by Application 2019 & 2032
                                                              82. Table 82: Global Farm Machinery Industry Revenue Million Forecast, by Production Analysis 2019 & 2032
                                                              83. Table 83: Global Farm Machinery Industry Revenue Million Forecast, by Consumption Analysis 2019 & 2032
                                                              84. Table 84: Global Farm Machinery Industry Revenue Million Forecast, by Import Market Analysis (Value & Volume) 2019 & 2032
                                                              85. Table 85: Global Farm Machinery Industry Revenue Million Forecast, by Export Market Analysis (Value & Volume) 2019 & 2032
                                                              86. Table 86: Global Farm Machinery Industry Revenue Million Forecast, by Price Trend Analysis 2019 & 2032
                                                              87. Table 87: Global Farm Machinery Industry Revenue Million Forecast, by Country 2019 & 2032
                                                              88. Table 88: Turkey Farm Machinery Industry Revenue (Million) Forecast, by Application 2019 & 2032
                                                              89. Table 89: Israel Farm Machinery Industry Revenue (Million) Forecast, by Application 2019 & 2032
                                                              90. Table 90: GCC Farm Machinery Industry Revenue (Million) Forecast, by Application 2019 & 2032
                                                              91. Table 91: North Africa Farm Machinery Industry Revenue (Million) Forecast, by Application 2019 & 2032
                                                              92. Table 92: South Africa Farm Machinery Industry Revenue (Million) Forecast, by Application 2019 & 2032
                                                              93. Table 93: Rest of Middle East & Africa Farm Machinery Industry Revenue (Million) Forecast, by Application 2019 & 2032
                                                              94. Table 94: Global Farm Machinery Industry Revenue Million Forecast, by Production Analysis 2019 & 2032
                                                              95. Table 95: Global Farm Machinery Industry Revenue Million Forecast, by Consumption Analysis 2019 & 2032
                                                              96. Table 96: Global Farm Machinery Industry Revenue Million Forecast, by Import Market Analysis (Value & Volume) 2019 & 2032
                                                              97. Table 97: Global Farm Machinery Industry Revenue Million Forecast, by Export Market Analysis (Value & Volume) 2019 & 2032
                                                              98. Table 98: Global Farm Machinery Industry Revenue Million Forecast, by Price Trend Analysis 2019 & 2032
                                                              99. Table 99: Global Farm Machinery Industry Revenue Million Forecast, by Country 2019 & 2032
                                                              100. Table 100: China Farm Machinery Industry Revenue (Million) Forecast, by Application 2019 & 2032
                                                              101. Table 101: India Farm Machinery Industry Revenue (Million) Forecast, by Application 2019 & 2032
                                                              102. Table 102: Japan Farm Machinery Industry Revenue (Million) Forecast, by Application 2019 & 2032
                                                              103. Table 103: South Korea Farm Machinery Industry Revenue (Million) Forecast, by Application 2019 & 2032
                                                              104. Table 104: ASEAN Farm Machinery Industry Revenue (Million) Forecast, by Application 2019 & 2032
                                                              105. Table 105: Oceania Farm Machinery Industry Revenue (Million) Forecast, by Application 2019 & 2032
                                                              106. Table 106: Rest of Asia Pacific Farm Machinery Industry Revenue (Million) Forecast, by Application 2019 & 2032


                                                              Frequently Asked Questions

                                                              1. What is the projected Compound Annual Growth Rate (CAGR) of the Farm Machinery Industry?

                                                              The projected CAGR is approximately 5.40%.

                                                              2. Which companies are prominent players in the Farm Machinery Industry?

                                                              Key companies in the market include Iseki & Co Ltd, Class Group*List Not Exhaustive, Lindsay Corporation, Mahindra & Mahindra Limited, Deere & Company, Daedong Industrial Co Ltd, CNH Industrial NV, Kubota Corporation, JC Bamford Excavators Limited, AGCO Corporation.

                                                              3. What are the main segments of the Farm Machinery Industry?

                                                              The market segments include Production Analysis, Consumption Analysis, Import Market Analysis (Value & Volume), Export Market Analysis (Value & Volume), Price Trend Analysis.

                                                              4. Can you provide details about the market size?

                                                              The market size is estimated to be USD 151.55 Million as of 2022.

                                                              5. What are some drivers contributing to market growth?

                                                              Low Availability of Skilled Labor; Technological Advancements.

                                                              6. What are the notable trends driving market growth?

                                                              Low Availability of Skilled Labor.

                                                              7. Are there any restraints impacting market growth?

                                                              Increasing Farm Expenditure; Security Concerns in Modern Farming Machinery.

                                                              8. Can you provide examples of recent developments in the market?

                                                              February 2024: John Deere and GUSS Automation unveiled the Electric GUSS, the world's first fully electric autonomous herbicide orchard sprayer. This innovative machine allows growers to control multiple sprayers remotely and features a sport spraying weed detection system that reduces herbicide use and increases sustainability. Electric gas is a significant development in precision agriculture.

                                                              9. What pricing options are available for accessing the report?

                                                              Pricing options include single-user, multi-user, and enterprise licenses priced at USD 4750, USD 5250, and USD 8750 respectively.

                                                              10. Is the market size provided in terms of value or volume?

                                                              The market size is provided in terms of value, measured in Million.

                                                              11. Are there any specific market keywords associated with the report?

                                                              Yes, the market keyword associated with the report is "Farm Machinery Industry," which aids in identifying and referencing the specific market segment covered.

                                                              12. How do I determine which pricing option suits my needs best?

                                                              The pricing options vary based on user requirements and access needs. Individual users may opt for single-user licenses, while businesses requiring broader access may choose multi-user or enterprise licenses for cost-effective access to the report.

                                                              13. Are there any additional resources or data provided in the Farm Machinery Industry report?

                                                              While the report offers comprehensive insights, it's advisable to review the specific contents or supplementary materials provided to ascertain if additional resources or data are available.

                                                              14. How can I stay updated on further developments or reports in the Farm Machinery Industry?

                                                              To stay informed about further developments, trends, and reports in the Farm Machinery Industry, consider subscribing to industry newsletters, following relevant companies and organizations, or regularly checking reputable industry news sources and publications.


                                                              Methodology

                                                              Step 1 - Identification of Relevant Samples Size from Population Database

                                                              Step Chart
                                                              Bar Chart
                                                              Method Chart

                                                              Step 2 - Approaches for Defining Global Market Size (Value, Volume* & Price*)

                                                              Approach Chart
                                                              Top-down and bottom-up approaches are used to validate the global market size and estimate the market size for manufactures, regional segments, product, and application.

                                                              Note*: In applicable scenarios

                                                              Step 3 - Data Sources

                                                              Primary Research

                                                              • Web Analytics
                                                              • Survey Reports
                                                              • Research Institute
                                                              • Latest Research Reports
                                                              • Opinion Leaders

                                                              Secondary Research

                                                              • Annual Reports
                                                              • White Paper
                                                              • Latest Press Release
                                                              • Industry Association
                                                              • Paid Database
                                                              • Investor Presentations
                                                              Analyst Chart

                                                              Step 4 - Data Triangulation

                                                              Involves using different sources of information in order to increase the validity of a study

                                                              These sources are likely to be stakeholders in a program - participants, other researchers, program staff, other community members, and so on.

                                                              Then we put all data in single framework & apply various statistical tools to find out the dynamic on the market.

                                                              During the analysis stage, feedback from the stakeholder groups would be compared to determine areas of agreement as well as areas of divergence

                                                              Additionally, after gathering mixed and scattered data from a wide range of sources, data is triangulated and correlated to come up with estimated figures which are further validated through primary mediums or industry experts, opinion leaders.

                                                              About Visionary Data Reports

                                                              Visionary Data Reports provides future-focused market research, advanced analytics, and strategic insights for technology, healthcare, green energy, and finance. Our reports help you anticipate trends, innovate, and lead in your industry. Our expert team combines primary research, data science, and industry knowledge to deliver actionable intelligence. We offer syndicated reports, custom analytics, and consulting services tailored to your business needs. At Visionary Data Reports, we are committed to quality, transparency, and client satisfaction. Every report is rigorously validated to ensure accuracy and relevance. Our global perspective and forward-thinking approach help you understand both current and emerging market dynamics.

                                                              Stay ahead with Visionary Data Reports. Subscribe to our newsletter for the latest insights and research highlights, and follow us on social media for real-time updates. Visionary Data Reports – Your Guide to Tomorrow’s Opportunities.

                                                              artwork spiralartwork spiralRelated Reports
                                                              artwork underline

                                                              Tomato Seed Market 2025-2033 Overview: Trends, Competitor Dynamics, and Opportunities

                                                              Discover the booming global tomato seed market! This comprehensive analysis reveals key trends, growth drivers (hybrid seeds, protected cultivation), restraints, and regional insights (Asia-Pacific leading) for the period 2019-2033, featuring top players like Sakata Seeds and Syngenta. Projected CAGR of 4.70% showcases significant investment opportunities.

                                                              July 2025
                                                              Base Year: 2024
                                                              No Of Pages: 180
                                                              Price: $3800

                                                              Emerging Trends in Brazil Maize Market: A Technology Perspective 2025-2033

                                                              Discover the dynamic Brazil maize market forecast (2025-2033)! This in-depth analysis reveals key growth drivers, including animal feed, biofuel, and human consumption, alongside major players like Syngenta and Corteva. Explore market size, CAGR, and regional insights to understand this lucrative opportunity.

                                                              July 2025
                                                              Base Year: 2024
                                                              No Of Pages: 180
                                                              Price: $3800

                                                              Future Forecasts for North America Seed Treatment Market Industry Growth

                                                              Discover the booming North American seed treatment market! This in-depth analysis reveals a CAGR of 4.20% (2025-2033), driven by precision farming, pest control needs, and government support. Explore key players, market segments (fungicides, insecticides, crops), and regional trends in the US, Canada, and Mexico. Get the data-driven insights you need to succeed.

                                                              July 2025
                                                              Base Year: 2024
                                                              No Of Pages: 150
                                                              Price: $3800

                                                              Africa Chia Seeds Industry Market’s Drivers and Challenges: Strategic Overview 2025-2033

                                                              Discover the booming African chia seed market! Our analysis reveals a $13.87M market in 2025, projected to grow at a 2.10% CAGR through 2033. Explore key trends, segments (organic, hybrid, processed, omega-3 rich), applications (food & beverage, supplements, personal care), and leading companies. Get insights for investment and market entry.

                                                              July 2025
                                                              Base Year: 2024
                                                              No Of Pages: 180
                                                              Price: $4750

                                                              Strategic Trends in Asia-Pacific Seed Coating Materials Market Market 2025-2033

                                                              The Asia-Pacific seed coating materials market is booming, with an 8% CAGR. Discover key trends, leading companies (BASF, Bayer), and segment analysis (polymers, colorants) driving growth in this $XX million market. Explore the forecast to 2033.

                                                              July 2025
                                                              Base Year: 2024
                                                              No Of Pages: 150
                                                              Price: $3800

                                                              Comprehensive Review of UK Fruits and Vegetables Market Growth Potential

                                                              Discover the booming UK fruits and vegetables market! This in-depth analysis reveals a £31.58 billion market with a 2.97% CAGR (2025-2033), driven by health trends and major players like Tesco and Sainsbury's. Explore regional data, consumption patterns, and future growth potential.

                                                              July 2025
                                                              Base Year: 2024
                                                              No Of Pages: 180
                                                              Price: $3800

                                                              Malaysia Agrochemical Market Market’s Drivers and Challenges: Strategic Overview 2025-2033

                                                              Discover the booming Malaysian agrochemical market! This comprehensive analysis reveals a RM 679.59 million market in 2025, projected to grow at a 4.56% CAGR until 2033. Explore key drivers, trends, restraints, and leading companies shaping this dynamic sector. Learn about fertilizers, pesticides, and other agrochemical segments.

                                                              July 2025
                                                              Base Year: 2024
                                                              No Of Pages: 150
                                                              Price: $3800

                                                              Drivers of Change in Agricultural Surfactant Market Market 2025-2033

                                                              The global agricultural surfactant market is booming, projected to reach $3.56 billion by 2033 with a 6.70% CAGR. Driven by precision agriculture and sustainable farming, this market analysis explores key segments (anionic, nonionic, bio-based), top players (BASF, Clariant), and regional growth trends. Discover the future of agricultural surfactants.

                                                              July 2025
                                                              Base Year: 2024
                                                              No Of Pages: 234
                                                              Price: $4750

                                                              Cameroon Grains Industry Industry Analysis and Consumer Behavior

                                                              Discover the booming Cameroon grains industry! Explore market size, growth trends (4.80% CAGR), key players (Sodecoton, CDC, etc.), and challenges impacting cereals, pulses, and oilseeds in Cameroon from 2019-2033. Invest wisely in this promising African market.

                                                              July 2025
                                                              Base Year: 2024
                                                              No Of Pages: 180
                                                              Price: $3800

                                                              Analyzing Consumer Behavior in Agriculture Market in Tanzania Market

                                                              Discover the booming Tanzanian agriculture market! Projected to reach $17.44 billion in 2025, with a 5.63% CAGR, this report analyzes market size, key players (Syngenta, Rijk Zwaan), growth drivers, and future trends in Tanzania's agricultural sector. Explore market segments, including food crops and investment opportunities.

                                                              July 2025
                                                              Base Year: 2024
                                                              No Of Pages: 150
                                                              Price: $3800

                                                              Analyzing Consumer Behavior in Artificial Intelligence in Agriculture Industry Market

                                                              Discover the booming AI in Agriculture market! This comprehensive analysis reveals a 4.20% CAGR, key drivers, trends, restraints, and regional insights from 2019-2033. Learn about leading companies and applications like precision farming, drone analytics, and weather tracking. Explore market size projections and future growth potential.

                                                              July 2025
                                                              Base Year: 2024
                                                              No Of Pages: 150
                                                              Price: $4750

                                                              Exploring Forestry Machinery Market’s Market Size Dynamics 2025-2033

                                                              The global forestry machinery market is booming, projected to reach $15 billion by 2033, driven by rising timber demand and technological advancements. Explore market trends, key players (Deere, Komatsu, etc.), and regional growth in our comprehensive analysis.

                                                              July 2025
                                                              Base Year: 2024
                                                              No Of Pages: 150
                                                              Price: $4750

                                                              Nutrition Canary Seed Market Competitive Strategies: Trends and Forecasts 2025-2033

                                                              Discover the booming nutrition canary seed market! Explore key trends, growth drivers, and regional market share projections for 2025-2033. Learn about leading companies and the increasing demand driven by health-conscious consumers and the birdseed industry.

                                                              July 2025
                                                              Base Year: 2024
                                                              No Of Pages: 234
                                                              Price: $4750

                                                              Consumer Behavior and Cashews Market in South America Trends

                                                              Discover the booming South American cashew market! This comprehensive analysis reveals a $582.24 million market in 2025, projected to grow at a 5.20% CAGR through 2033. Explore key trends, drivers, and leading companies shaping this lucrative industry.

                                                              July 2025
                                                              Base Year: 2024
                                                              No Of Pages: 180
                                                              Price: $3800

                                                              Strategic Growth Drivers for Rye Industry Market

                                                              Discover the latest market analysis of the global rye industry, projecting a steady CAGR of 2.20% to 2033. Explore key drivers, restraints, and regional trends impacting the growth of rye in food, feed, and beverage applications. Learn about leading companies and future market opportunities.

                                                              July 2025
                                                              Base Year: 2024
                                                              No Of Pages: 234
                                                              Price: $4750

                                                              Comprehensive Overview of Water Soluble Fertilizer Industry Trends: 2025-2033

                                                              Discover the booming water-soluble fertilizer market! Explore its $XX million valuation in 2025, projected 3.80% CAGR growth to 2033, key drivers, trends, and regional insights. Learn about top players and lucrative segments like fertigation and horticultural crops.

                                                              July 2025
                                                              Base Year: 2024
                                                              No Of Pages: 150
                                                              Price: $3800

                                                              Asia-Pacific Agricultural Tractors Market Market Expansion: Growth Outlook 2025-2033

                                                              Discover the booming Asia-Pacific Agricultural Tractors market! Our analysis reveals a $15 billion USD market in 2025, projected to grow at a 6% CAGR through 2033. Explore market size, growth trends, and regional breakdowns for India, China, and other key countries. Learn how technological advancements and government initiatives are shaping the future of farming.

                                                              July 2025
                                                              Base Year: 2024
                                                              No Of Pages: 197
                                                              Price: $3800

                                                              Asia-Pacific Agricultural Enzymes Market Market’s Consumer Preferences: Trends and Analysis 2025-2033

                                                              The Asia-Pacific agricultural enzymes market is booming, projected to reach $XX million by 2025, with a CAGR of 10.30%. This report analyzes market drivers, trends, restraints, and key players like Novozymes and BASF, covering segments like carbohydrases and applications in crop protection. Discover regional insights and forecast data for 2025-2033.

                                                              July 2025
                                                              Base Year: 2024
                                                              No Of Pages: 197
                                                              Price: $3800

                                                              Strategic Vision for USA Agricultural Irrigation Machinery Market Industry Trends

                                                              Discover the booming US agricultural irrigation machinery market! This in-depth analysis reveals projected growth to $3.8B by 2033, driven by water scarcity, precision agriculture, and smart irrigation technology. Explore key players, regional trends, and market segmentation in drip, sprinkler, and pivot irrigation.

                                                              July 2025
                                                              Base Year: 2024
                                                              No Of Pages: 150
                                                              Price: $3800

                                                              Electric Lawn Mowers Market Insightful Market Analysis: Trends and Opportunities 2025-2033

                                                              Discover the booming electric lawn mower market! This comprehensive analysis reveals a CAGR of 6.50%, driven by eco-consciousness and technological advancements. Explore market size, key players (Toro, Husqvarna, etc.), regional trends, and future projections (2025-2033) for residential, professional, and golf course applications.

                                                              July 2025
                                                              Base Year: 2024
                                                              No Of Pages: 150
                                                              Price: $4750
                                                              • Home
                                                              • About Us
                                                              • Industries
                                                                • Aerospace & Defense
                                                                • Agriculture
                                                                • Animal Nutrition & Wellness
                                                                • Automotive
                                                                • Chemicals & Materials
                                                                • Consumer Goods and Services
                                                                • Energy & Power
                                                                • Financial Services and Investment Intelligence
                                                                • Food & Beverage
                                                                • Home and Property Improvement
                                                                • Hospitality and Tourism
                                                                • Logistics
                                                                • Manufacturing Products and Services
                                                                • Packaging
                                                                • Professional and Commercial Services
                                                                • Real Estate and Construction
                                                                • Retail
                                                                • Technology, Media and Telecom
                                                                • Healthcare
                                                              • Services
                                                              • Contact
                                                              Main Logo
                                                              • Home
                                                              • About Us
                                                              • Industries
                                                                • Aerospace & Defense
                                                                • Agriculture
                                                                • Animal Nutrition & Wellness
                                                                • Automotive
                                                                • Chemicals & Materials
                                                                • Consumer Goods and Services
                                                                • Energy & Power
                                                                • Financial Services and Investment Intelligence
                                                                • Food & Beverage
                                                                • Home and Property Improvement
                                                                • Hospitality and Tourism
                                                                • Logistics
                                                                • Manufacturing Products and Services
                                                                • Packaging
                                                                • Professional and Commercial Services
                                                                • Real Estate and Construction
                                                                • Retail
                                                                • Technology, Media and Telecom
                                                                • Healthcare
                                                              • Services
                                                              • Contact
                                                              +17162654855
                                                              [email protected]

                                                              +17162654855

                                                              [email protected]

                                                              Business Address

                                                              Head Office

                                                              Office no. A 5010, fifth floor, Solitaire Business Hub, Near Phoenix mall, Pune, Maharashtra 411014

                                                              Contact Information

                                                              Craig Francis

                                                              Business Development Head

                                                              +17162654855

                                                              [email protected]

                                                              Connect With Us

                                                              Secure Payment Partners

                                                              payment image
                                                              RetailLogisticsPackagingAutomotiveHealthcareAgricultureEnergy & PowerFood & BeverageAerospace & DefenseChemicals & MaterialsHospitality and TourismAnimal Nutrition & WellnessConsumer Goods and ServicesReal Estate and ConstructionHome and Property ImprovementTechnology, Media and TelecomManufacturing Products and ServicesFinancial Services and Investment Intelligence

                                                              © 2025 All rights reserved


                                                              Privacy Policy
                                                              Terms and Conditions
                                                              FAQ