

Key Insights
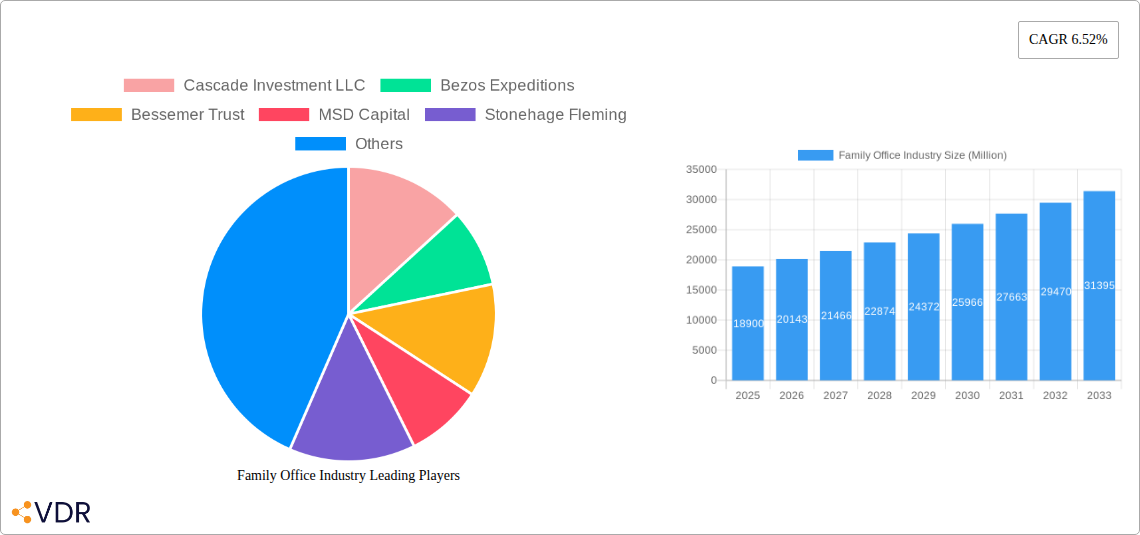
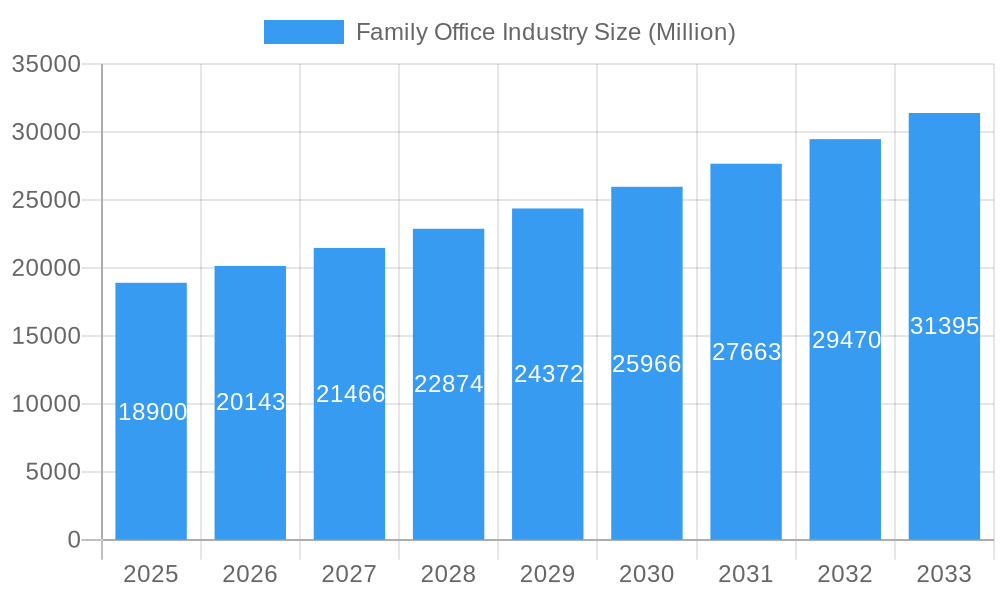
The global family office industry, currently valued at $18.90 billion in 2025, is experiencing robust growth, projected to expand at a Compound Annual Growth Rate (CAGR) of 6.52% from 2025 to 2033. This expansion is fueled by several key factors. The increasing concentration of wealth among high-net-worth individuals (HNWIs) and ultra-high-net-worth individuals (UHNWIs) globally is a primary driver. These individuals require sophisticated wealth management services beyond the capabilities of traditional financial institutions, leading to a surge in demand for personalized, holistic family office solutions. Furthermore, the growing complexity of global financial markets and evolving regulatory landscapes necessitate specialized expertise, propelling the need for family offices to provide comprehensive wealth planning, investment management, tax optimization, and philanthropic advisory services. Technological advancements, such as the adoption of sophisticated financial technologies (Fintech) and data analytics, are also contributing to industry growth by enhancing efficiency and improving investment strategies.
Family Office Industry Market Size (In Billion)
Competition within the industry is intensifying, with established players like Cascade Investment LLC, Bezos Expeditions, and Goldman Sachs Family Office vying for market share alongside newer entrants. However, the industry also faces certain challenges. Regulatory scrutiny and compliance costs are rising, impacting profitability. Furthermore, attracting and retaining top-tier talent, particularly skilled investment professionals, is a significant hurdle. Despite these challenges, the long-term outlook for the family office industry remains positive, driven by continued wealth accumulation, increased demand for personalized wealth management, and ongoing technological innovation. Market segmentation is likely driven by service offerings (e.g., multi-family offices versus single-family offices) and geographical location, with North America and Europe currently holding the largest market share, though growth in Asia-Pacific is expected to accelerate in the coming years.
Family Office Industry Company Market Share
Family Office Industry Market Report: 2019-2033
This comprehensive report provides an in-depth analysis of the global Family Office Industry, encompassing market dynamics, growth trends, key players, and future outlook. With a study period spanning 2019-2033 (base year 2025, forecast period 2025-2033), this report is an essential resource for industry professionals, investors, and strategic decision-makers seeking to navigate this dynamic landscape. The report analyzes both the parent market (Wealth Management) and the child market (Family Office Services) to provide a holistic view. Market values are presented in millions.
Family Office Industry Market Dynamics & Structure
The Family Office Industry is characterized by a dynamic and evolving market landscape. While a few prominent players command significant market share, indicating moderate concentration, the industry is also marked by increasing fragmentation and specialization. Technological innovation stands as a primary catalyst, with advancements in areas such as AI-driven portfolio optimization, sophisticated cybersecurity solutions, and blockchain for enhanced transparency and security, profoundly shaping operational efficiency and service delivery. Furthermore, the intricate and ever-changing regulatory frameworks, encompassing tax legislation, fiduciary duties, and global compliance standards, exert a substantial influence on operational strategies and cost structures. The competitive milieu includes traditional wealth management firms offering broader services and specialized investment boutiques catering to niche asset classes or strategies. The primary end-user demographic comprises High-Net-Worth Individuals (HNWIs) and Ultra-High-Net-Worth Individuals (UHNWIs), whose evolving expectations for personalized, comprehensive, and values-aligned wealth stewardship are paramount. Mergers and Acquisitions (M&A) remain a prevalent strategy, fueled by the pursuit of enhanced scale, expanded service offerings, access to specialized talent and expertise, and geographic diversification.
- Market Concentration: Leading players are consolidating their positions, with the top 5 entities estimated to hold approximately 35-40% of the market share in 2024, reflecting a trend of strategic consolidation.
- M&A Activity: The year 2024 saw over 15 significant M&A deals closed within the family office sector, with an average deal value exceeding $500 million, underscoring the industry's consolidation drive.
- Technological Innovation: The adoption of AI and machine learning in portfolio management and client reporting is projected to increase by 20-25% annually during the forecast period, enabling more sophisticated analytics and predictive capabilities.
- Regulatory Landscape: Evolving and stringent compliance requirements are a persistent factor, driving increased operational costs. These costs are estimated to represent 15-20% of total revenue for the average family office, necessitating robust compliance infrastructure.
- Innovation Barriers: Significant barriers to widespread technological innovation include the substantial initial investment costs associated with advanced solutions and a lack of readily available, standardized technological platforms tailored for the unique needs of family offices.
Family Office Industry Growth Trends & Insights
The Family Office Industry is experiencing robust growth, driven by increasing HNWIs and UHNWIs wealth globally, coupled with demand for sophisticated wealth management solutions. Market size increased from $xx million in 2019 to $xx million in 2024 and is projected to reach $xx million by 2033, exhibiting a CAGR of xx% during the forecast period. Technological advancements such as AI-powered portfolio optimization and blockchain-based security solutions are accelerating industry transformation. A shift towards personalized wealth management services further fuels market growth. Adoption of sophisticated investment strategies and rising demand for specialized services are key factors.
Dominant Regions, Countries, or Segments in Family Office Industry
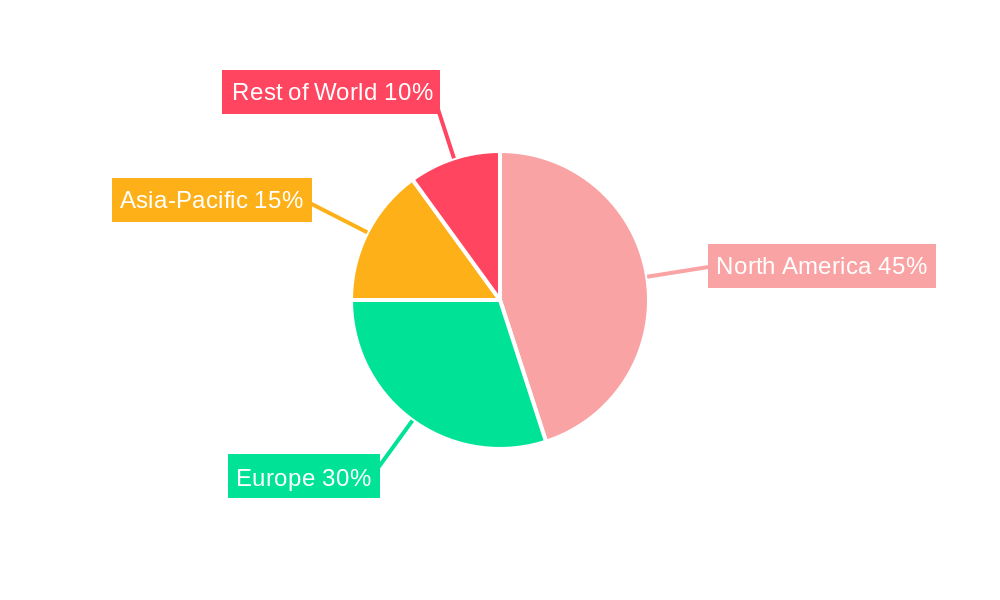
North America currently leads the global Family Office Industry, largely attributed to its robust economy, a high concentration of HNWIs and UHNWIs, and a well-established ecosystem of financial and legal services. Europe remains a significant and mature market, exhibiting a steady demand for sophisticated wealth management solutions. The Asia-Pacific region is witnessing rapid growth, propelled by burgeoning wealth creation, an expanding HNWI population, and an increasing appetite for professional wealth management services. Within the industry structure, the single-family office segment continues to hold the largest market share, reflecting a strong preference among the wealthiest families for direct control and bespoke solutions. However, multi-family offices are also experiencing substantial growth as they offer economies of scale and broader expertise to a wider client base.
- North America: Dominates with an estimated market share of 45-50% in 2024, fueled by exceptional economic resilience and the presence of a substantial UHNWI population.
- Europe: Holds a significant market share of 30-35% in 2024, with notable growth potential anticipated in established markets and emerging economies across Eastern Europe.
- Asia-Pacific: Represents approximately 15-20% of the market share in 2024, demonstrating the highest growth trajectory, driven by rapid economic development and a surging HNWI population.
- Key Drivers: Favorable tax policies, sophisticated financial infrastructure, a growing pool of experienced professionals, and a generally supportive regulatory environment contribute to the dominance of key regions.
Family Office Industry Product Landscape
The Family Office Industry offers a diverse range of products and services, including investment management, financial planning, tax and legal advice, estate planning, and family governance support. Technological advancements have enhanced these offerings, resulting in improved portfolio management tools, risk assessment models, and personalized client portals. Unique selling propositions revolve around delivering customized, holistic wealth management solutions tailored to individual family needs and objectives.
Key Drivers, Barriers & Challenges in Family Office Industry
Key Drivers: The sustained growth of the family office industry is primarily propelled by the continuous rise in global wealth, leading to an increasing number of individuals and families requiring sophisticated wealth preservation and growth strategies. The escalating demand for highly personalized, holistic wealth management services that extend beyond traditional investment advice, encompassing estate planning, philanthropic endeavors, and lifestyle management, is a significant driver. Technological advancements are not only enhancing efficiency but also enabling new service models. Furthermore, government policies that support wealth accumulation and provide frameworks for family office operations contribute to market expansion.
Key Challenges: Navigating the complexities of stringent and evolving regulatory compliance remains a paramount challenge, demanding continuous adaptation and investment. The ever-present threat of sophisticated cybersecurity breaches poses a significant risk to sensitive client data and financial assets, necessitating robust protective measures. The acquisition and retention of highly skilled and specialized talent, capable of managing complex portfolios and understanding the nuanced needs of UHNW families, is an ongoing challenge. Intense competition from established traditional wealth managers, alongside the emergence of new digital advisory platforms, also creates pressure on service providers. Anticipated regulatory changes are projected to increase overall compliance costs by an estimated 10-15% by 2033, while the financial and reputational repercussions of cybersecurity breaches can be devastating, underscoring the critical importance of proactive risk management.
Emerging Opportunities in Family Office Industry
Untapped markets in emerging economies, demand for sustainable and impact investing, and the integration of advanced technologies present significant opportunities. Increased demand for family office services from entrepreneurial families and new innovative technologies within the sector are driving opportunities.
Growth Accelerators in the Family Office Industry Industry
Strategic partnerships, expansion into emerging markets, technological innovation, and the increasing complexity of wealth management needs propel long-term growth. Focus on digital transformation, proactive risk management, and ESG investing are key growth accelerators.
Key Players Shaping the Family Office Industry Market
- Cascade Investment LLC
- Bezos Expeditions
- Bessemer Trust
- MSD Capital
- Stonehage Fleming
- Glenmede
- Emerson Collective
- U S Trust - Bank of America Private Wealth Management
- Bespoke Wealth Management (a conceptual placeholder for independent, specialized advisors)
- JPMorgan Chase Wealth Management
- Goldman Sachs Family Office
- Silvercrest Asset Management
- List Not Exhaustive
Notable Milestones in Family Office Industry Sector
- March 2023: Cascade Partners acquired BlueWater Partners LLC, expanding service offerings and capacity.
- October 2022: BDT & Company Holdings and MSD Partners formed a new advisory and investment firm targeting family-led businesses.
In-Depth Family Office Industry Market Outlook
The Family Office Industry is projected for robust and sustained growth, driven by the persistent accumulation of global wealth and the increasingly sophisticated and diverse needs of HNWIs and UHNWIs. Key future market dynamics will be shaped by strategic alliances and partnerships that broaden service capabilities and client reach. Continued investment in and adoption of cutting-edge technological solutions, including advanced data analytics, artificial intelligence for personalized insights, and enhanced digital client portals, will be crucial for competitive differentiation. Geographic expansion into emerging markets and the development of specialized service lines will also be significant trends. A notable and growing trend is the increasing emphasis on sustainable and impact investing, as clients seek to align their financial goals with their personal values, creating new avenues for wealth creation and positive societal contributions.
Family Office Industry Segmentation
-
1. Product
- 1.1. Single Family Office
- 1.2. Multi Family Office
- 1.3. Virtual Family Office
-
2. Asset Class Of Investment
- 2.1. Bonds
- 2.2. Equities
- 2.3. Alternative Investments
- 2.4. Commodities
- 2.5. Cash Or Cash Equivalents
- 3. Geography
-
4. North America
- 4.1. United States
- 4.2. Canada
-
5. Europe
- 5.1. United Kingdom
- 5.2. Germany
- 5.3. France
- 5.4. Italy
- 5.5. Spain
- 5.6. Rest of Europe
-
6. Asia-Pacific
- 6.1. China
- 6.2. India
- 6.3. Japan
- 6.4. Australia
- 6.5. Rest of Asia-Pacific
-
7. Latin America
- 7.1. Brazil
- 7.2. Mexico
- 7.3. Argentina
- 7.4. Rest of South America
-
8. Middle-East and Africa
- 8.1. United Arab Emirates
- 8.2. Saudi Arabia
- 8.3. South Africa
- 8.4. Rest of Middle-East and Africa
Family Office Industry Segmentation By Geography
-
1. North America
- 1.1. United States
- 1.2. Canada
- 1.3. Mexico
-
2. South America
- 2.1. Brazil
- 2.2. Argentina
- 2.3. Rest of South America
-
3. Europe
- 3.1. United Kingdom
- 3.2. Germany
- 3.3. France
- 3.4. Italy
- 3.5. Spain
- 3.6. Russia
- 3.7. Benelux
- 3.8. Nordics
- 3.9. Rest of Europe
-
4. Middle East & Africa
- 4.1. Turkey
- 4.2. Israel
- 4.3. GCC
- 4.4. North Africa
- 4.5. South Africa
- 4.6. Rest of Middle East & Africa
-
5. Asia Pacific
- 5.1. China
- 5.2. India
- 5.3. Japan
- 5.4. South Korea
- 5.5. ASEAN
- 5.6. Oceania
- 5.7. Rest of Asia Pacific
Family Office Industry Regional Market Share
Geographic Coverage of Family Office Industry
Family Office Industry REPORT HIGHLIGHTS
| Aspects | Details |
|---|---|
| Study Period | 2020-2034 |
| Base Year | 2025 |
| Estimated Year | 2026 |
| Forecast Period | 2026-2034 |
| Historical Period | 2020-2025 |
| Growth Rate | CAGR of 6.52% from 2020-2034 |
| Segmentation |
|
Table of Contents
- 1. Introduction
- 1.1. Research Scope
- 1.2. Market Segmentation
- 1.3. Research Objective
- 1.4. Definitions and Assumptions
- 2. Executive Summary
- 2.1. Market Snapshot
- 3. Market Dynamics
- 3.1. Market Drivers
- 3.2. Market Restrains
- 3.3. Market Trends
- 3.4. Market Opportunities
- 4. Market Factor Analysis
- 4.1. Porters Five Forces
- 4.1.1. Bargaining Power of Suppliers
- 4.1.2. Bargaining Power of Buyers
- 4.1.3. Threat of New Entrants
- 4.1.4. Threat of Substitutes
- 4.1.5. Competitive Rivalry
- 4.2. PESTEL analysis
- 4.3. BCG Analysis
- 4.3.1. Stars (High Growth, High Market Share)
- 4.3.2. Cash Cows (Low Growth, High Market Share)
- 4.3.3. Question Mark (High Growth, Low Market Share)
- 4.3.4. Dogs (Low Growth, Low Market Share)
- 4.4. Ansoff Matrix Analysis
- 4.5. Supply Chain Analysis
- 4.6. Regulatory Landscape
- 4.7. Current Market Potential and Opportunity Assessment (TAM–SAM–SOM Framework)
- 4.8. VDR Analyst Note
- 4.1. Porters Five Forces
- 5. Market Analysis, Insights and Forecast 2021-2033
- 5.1. Market Analysis, Insights and Forecast - by Product
- 5.1.1. Single Family Office
- 5.1.2. Multi Family Office
- 5.1.3. Virtual Family Office
- 5.2. Market Analysis, Insights and Forecast - by Asset Class Of Investment
- 5.2.1. Bonds
- 5.2.2. Equities
- 5.2.3. Alternative Investments
- 5.2.4. Commodities
- 5.2.5. Cash Or Cash Equivalents
- 5.3. Market Analysis, Insights and Forecast - by Geography
- 5.4. Market Analysis, Insights and Forecast - by North America
- 5.4.1. United States
- 5.4.2. Canada
- 5.5. Market Analysis, Insights and Forecast - by Europe
- 5.5.1. United Kingdom
- 5.5.2. Germany
- 5.5.3. France
- 5.5.4. Italy
- 5.5.5. Spain
- 5.5.6. Rest of Europe
- 5.6. Market Analysis, Insights and Forecast - by Asia-Pacific
- 5.6.1. China
- 5.6.2. India
- 5.6.3. Japan
- 5.6.4. Australia
- 5.6.5. Rest of Asia-Pacific
- 5.7. Market Analysis, Insights and Forecast - by Latin America
- 5.7.1. Brazil
- 5.7.2. Mexico
- 5.7.3. Argentina
- 5.7.4. Rest of South America
- 5.8. Market Analysis, Insights and Forecast - by Middle-East and Africa
- 5.8.1. United Arab Emirates
- 5.8.2. Saudi Arabia
- 5.8.3. South Africa
- 5.8.4. Rest of Middle-East and Africa
- 5.9. Market Analysis, Insights and Forecast - by Region
- 5.9.1. North America
- 5.9.2. South America
- 5.9.3. Europe
- 5.9.4. Middle East & Africa
- 5.9.5. Asia Pacific
- 5.1. Market Analysis, Insights and Forecast - by Product
- 6. Global Family Office Industry Analysis, Insights and Forecast, 2021-2033
- 6.1. Market Analysis, Insights and Forecast - by Product
- 6.1.1. Single Family Office
- 6.1.2. Multi Family Office
- 6.1.3. Virtual Family Office
- 6.2. Market Analysis, Insights and Forecast - by Asset Class Of Investment
- 6.2.1. Bonds
- 6.2.2. Equities
- 6.2.3. Alternative Investments
- 6.2.4. Commodities
- 6.2.5. Cash Or Cash Equivalents
- 6.3. Market Analysis, Insights and Forecast - by Geography
- 6.4. Market Analysis, Insights and Forecast - by North America
- 6.4.1. United States
- 6.4.2. Canada
- 6.5. Market Analysis, Insights and Forecast - by Europe
- 6.5.1. United Kingdom
- 6.5.2. Germany
- 6.5.3. France
- 6.5.4. Italy
- 6.5.5. Spain
- 6.5.6. Rest of Europe
- 6.6. Market Analysis, Insights and Forecast - by Asia-Pacific
- 6.6.1. China
- 6.6.2. India
- 6.6.3. Japan
- 6.6.4. Australia
- 6.6.5. Rest of Asia-Pacific
- 6.7. Market Analysis, Insights and Forecast - by Latin America
- 6.7.1. Brazil
- 6.7.2. Mexico
- 6.7.3. Argentina
- 6.7.4. Rest of South America
- 6.8. Market Analysis, Insights and Forecast - by Middle-East and Africa
- 6.8.1. United Arab Emirates
- 6.8.2. Saudi Arabia
- 6.8.3. South Africa
- 6.8.4. Rest of Middle-East and Africa
- 6.1. Market Analysis, Insights and Forecast - by Product
- 7. North America Family Office Industry Analysis, Insights and Forecast, 2021-2033
- 7.1. Market Analysis, Insights and Forecast - by Product
- 7.1.1. Single Family Office
- 7.1.2. Multi Family Office
- 7.1.3. Virtual Family Office
- 7.2. Market Analysis, Insights and Forecast - by Asset Class Of Investment
- 7.2.1. Bonds
- 7.2.2. Equities
- 7.2.3. Alternative Investments
- 7.2.4. Commodities
- 7.2.5. Cash Or Cash Equivalents
- 7.3. Market Analysis, Insights and Forecast - by Geography
- 7.4. Market Analysis, Insights and Forecast - by North America
- 7.4.1. United States
- 7.4.2. Canada
- 7.5. Market Analysis, Insights and Forecast - by Europe
- 7.5.1. United Kingdom
- 7.5.2. Germany
- 7.5.3. France
- 7.5.4. Italy
- 7.5.5. Spain
- 7.5.6. Rest of Europe
- 7.6. Market Analysis, Insights and Forecast - by Asia-Pacific
- 7.6.1. China
- 7.6.2. India
- 7.6.3. Japan
- 7.6.4. Australia
- 7.6.5. Rest of Asia-Pacific
- 7.7. Market Analysis, Insights and Forecast - by Latin America
- 7.7.1. Brazil
- 7.7.2. Mexico
- 7.7.3. Argentina
- 7.7.4. Rest of South America
- 7.8. Market Analysis, Insights and Forecast - by Middle-East and Africa
- 7.8.1. United Arab Emirates
- 7.8.2. Saudi Arabia
- 7.8.3. South Africa
- 7.8.4. Rest of Middle-East and Africa
- 7.1. Market Analysis, Insights and Forecast - by Product
- 8. South America Family Office Industry Analysis, Insights and Forecast, 2021-2033
- 8.1. Market Analysis, Insights and Forecast - by Product
- 8.1.1. Single Family Office
- 8.1.2. Multi Family Office
- 8.1.3. Virtual Family Office
- 8.2. Market Analysis, Insights and Forecast - by Asset Class Of Investment
- 8.2.1. Bonds
- 8.2.2. Equities
- 8.2.3. Alternative Investments
- 8.2.4. Commodities
- 8.2.5. Cash Or Cash Equivalents
- 8.3. Market Analysis, Insights and Forecast - by Geography
- 8.4. Market Analysis, Insights and Forecast - by North America
- 8.4.1. United States
- 8.4.2. Canada
- 8.5. Market Analysis, Insights and Forecast - by Europe
- 8.5.1. United Kingdom
- 8.5.2. Germany
- 8.5.3. France
- 8.5.4. Italy
- 8.5.5. Spain
- 8.5.6. Rest of Europe
- 8.6. Market Analysis, Insights and Forecast - by Asia-Pacific
- 8.6.1. China
- 8.6.2. India
- 8.6.3. Japan
- 8.6.4. Australia
- 8.6.5. Rest of Asia-Pacific
- 8.7. Market Analysis, Insights and Forecast - by Latin America
- 8.7.1. Brazil
- 8.7.2. Mexico
- 8.7.3. Argentina
- 8.7.4. Rest of South America
- 8.8. Market Analysis, Insights and Forecast - by Middle-East and Africa
- 8.8.1. United Arab Emirates
- 8.8.2. Saudi Arabia
- 8.8.3. South Africa
- 8.8.4. Rest of Middle-East and Africa
- 8.1. Market Analysis, Insights and Forecast - by Product
- 9. Europe Family Office Industry Analysis, Insights and Forecast, 2021-2033
- 9.1. Market Analysis, Insights and Forecast - by Product
- 9.1.1. Single Family Office
- 9.1.2. Multi Family Office
- 9.1.3. Virtual Family Office
- 9.2. Market Analysis, Insights and Forecast - by Asset Class Of Investment
- 9.2.1. Bonds
- 9.2.2. Equities
- 9.2.3. Alternative Investments
- 9.2.4. Commodities
- 9.2.5. Cash Or Cash Equivalents
- 9.3. Market Analysis, Insights and Forecast - by Geography
- 9.4. Market Analysis, Insights and Forecast - by North America
- 9.4.1. United States
- 9.4.2. Canada
- 9.5. Market Analysis, Insights and Forecast - by Europe
- 9.5.1. United Kingdom
- 9.5.2. Germany
- 9.5.3. France
- 9.5.4. Italy
- 9.5.5. Spain
- 9.5.6. Rest of Europe
- 9.6. Market Analysis, Insights and Forecast - by Asia-Pacific
- 9.6.1. China
- 9.6.2. India
- 9.6.3. Japan
- 9.6.4. Australia
- 9.6.5. Rest of Asia-Pacific
- 9.7. Market Analysis, Insights and Forecast - by Latin America
- 9.7.1. Brazil
- 9.7.2. Mexico
- 9.7.3. Argentina
- 9.7.4. Rest of South America
- 9.8. Market Analysis, Insights and Forecast - by Middle-East and Africa
- 9.8.1. United Arab Emirates
- 9.8.2. Saudi Arabia
- 9.8.3. South Africa
- 9.8.4. Rest of Middle-East and Africa
- 9.1. Market Analysis, Insights and Forecast - by Product
- 10. Middle East & Africa Family Office Industry Analysis, Insights and Forecast, 2021-2033
- 10.1. Market Analysis, Insights and Forecast - by Product
- 10.1.1. Single Family Office
- 10.1.2. Multi Family Office
- 10.1.3. Virtual Family Office
- 10.2. Market Analysis, Insights and Forecast - by Asset Class Of Investment
- 10.2.1. Bonds
- 10.2.2. Equities
- 10.2.3. Alternative Investments
- 10.2.4. Commodities
- 10.2.5. Cash Or Cash Equivalents
- 10.3. Market Analysis, Insights and Forecast - by Geography
- 10.4. Market Analysis, Insights and Forecast - by North America
- 10.4.1. United States
- 10.4.2. Canada
- 10.5. Market Analysis, Insights and Forecast - by Europe
- 10.5.1. United Kingdom
- 10.5.2. Germany
- 10.5.3. France
- 10.5.4. Italy
- 10.5.5. Spain
- 10.5.6. Rest of Europe
- 10.6. Market Analysis, Insights and Forecast - by Asia-Pacific
- 10.6.1. China
- 10.6.2. India
- 10.6.3. Japan
- 10.6.4. Australia
- 10.6.5. Rest of Asia-Pacific
- 10.7. Market Analysis, Insights and Forecast - by Latin America
- 10.7.1. Brazil
- 10.7.2. Mexico
- 10.7.3. Argentina
- 10.7.4. Rest of South America
- 10.8. Market Analysis, Insights and Forecast - by Middle-East and Africa
- 10.8.1. United Arab Emirates
- 10.8.2. Saudi Arabia
- 10.8.3. South Africa
- 10.8.4. Rest of Middle-East and Africa
- 10.1. Market Analysis, Insights and Forecast - by Product
- 11. Asia Pacific Family Office Industry Analysis, Insights and Forecast, 2021-2033
- 11.1. Market Analysis, Insights and Forecast - by Product
- 11.1.1. Single Family Office
- 11.1.2. Multi Family Office
- 11.1.3. Virtual Family Office
- 11.2. Market Analysis, Insights and Forecast - by Asset Class Of Investment
- 11.2.1. Bonds
- 11.2.2. Equities
- 11.2.3. Alternative Investments
- 11.2.4. Commodities
- 11.2.5. Cash Or Cash Equivalents
- 11.3. Market Analysis, Insights and Forecast - by Geography
- 11.4. Market Analysis, Insights and Forecast - by North America
- 11.4.1. United States
- 11.4.2. Canada
- 11.5. Market Analysis, Insights and Forecast - by Europe
- 11.5.1. United Kingdom
- 11.5.2. Germany
- 11.5.3. France
- 11.5.4. Italy
- 11.5.5. Spain
- 11.5.6. Rest of Europe
- 11.6. Market Analysis, Insights and Forecast - by Asia-Pacific
- 11.6.1. China
- 11.6.2. India
- 11.6.3. Japan
- 11.6.4. Australia
- 11.6.5. Rest of Asia-Pacific
- 11.7. Market Analysis, Insights and Forecast - by Latin America
- 11.7.1. Brazil
- 11.7.2. Mexico
- 11.7.3. Argentina
- 11.7.4. Rest of South America
- 11.8. Market Analysis, Insights and Forecast - by Middle-East and Africa
- 11.8.1. United Arab Emirates
- 11.8.2. Saudi Arabia
- 11.8.3. South Africa
- 11.8.4. Rest of Middle-East and Africa
- 11.1. Market Analysis, Insights and Forecast - by Product
- 12. Competitive Analysis
- 12.1. Company Profiles
- 12.1.1 Cascade Investment LLC
- 12.1.1.1. Company Overview
- 12.1.1.2. Products
- 12.1.1.3. Company Financials
- 12.1.1.4. SWOT Analysis
- 12.1.2 Bezos Expeditions
- 12.1.2.1. Company Overview
- 12.1.2.2. Products
- 12.1.2.3. Company Financials
- 12.1.2.4. SWOT Analysis
- 12.1.3 Bessemer Trust
- 12.1.3.1. Company Overview
- 12.1.3.2. Products
- 12.1.3.3. Company Financials
- 12.1.3.4. SWOT Analysis
- 12.1.4 MSD Capital
- 12.1.4.1. Company Overview
- 12.1.4.2. Products
- 12.1.4.3. Company Financials
- 12.1.4.4. SWOT Analysis
- 12.1.5 Stonehage Fleming
- 12.1.5.1. Company Overview
- 12.1.5.2. Products
- 12.1.5.3. Company Financials
- 12.1.5.4. SWOT Analysis
- 12.1.6 Glenmede
- 12.1.6.1. Company Overview
- 12.1.6.2. Products
- 12.1.6.3. Company Financials
- 12.1.6.4. SWOT Analysis
- 12.1.7 Emerson Collective
- 12.1.7.1. Company Overview
- 12.1.7.2. Products
- 12.1.7.3. Company Financials
- 12.1.7.4. SWOT Analysis
- 12.1.8 U S Trust - Bank of America Private Wealth Management
- 12.1.8.1. Company Overview
- 12.1.8.2. Products
- 12.1.8.3. Company Financials
- 12.1.8.4. SWOT Analysis
- 12.1.9 Bespoke Wealth Management
- 12.1.9.1. Company Overview
- 12.1.9.2. Products
- 12.1.9.3. Company Financials
- 12.1.9.4. SWOT Analysis
- 12.1.10 JPMorgan Chase Wealth Management
- 12.1.10.1. Company Overview
- 12.1.10.2. Products
- 12.1.10.3. Company Financials
- 12.1.10.4. SWOT Analysis
- 12.1.11 Goldman Sachs Family Office
- 12.1.11.1. Company Overview
- 12.1.11.2. Products
- 12.1.11.3. Company Financials
- 12.1.11.4. SWOT Analysis
- 12.1.12 Silvercrest Asset Management**List Not Exhaustive
- 12.1.12.1. Company Overview
- 12.1.12.2. Products
- 12.1.12.3. Company Financials
- 12.1.12.4. SWOT Analysis
- 12.1.1 Cascade Investment LLC
- 12.2. Market Entropy
- 12.2.1 Company's Key Areas Served
- 12.2.2 Recent Developments
- 12.3. Company Market Share Analysis 2025
- 12.3.1 Top 5 Companies Market Share Analysis
- 12.3.2 Top 3 Companies Market Share Analysis
- 12.4. List of Potential Customers
- 13. Research Methodology
List of Figures
- Figure 1: Global Family Office Industry Revenue Breakdown (Million, %) by Region 2025 & 2033
- Figure 2: Global Family Office Industry Volume Breakdown (Billion, %) by Region 2025 & 2033
- Figure 3: North America Family Office Industry Revenue (Million), by Product 2025 & 2033
- Figure 4: North America Family Office Industry Volume (Billion), by Product 2025 & 2033
- Figure 5: North America Family Office Industry Revenue Share (%), by Product 2025 & 2033
- Figure 6: North America Family Office Industry Volume Share (%), by Product 2025 & 2033
- Figure 7: North America Family Office Industry Revenue (Million), by Asset Class Of Investment 2025 & 2033
- Figure 8: North America Family Office Industry Volume (Billion), by Asset Class Of Investment 2025 & 2033
- Figure 9: North America Family Office Industry Revenue Share (%), by Asset Class Of Investment 2025 & 2033
- Figure 10: North America Family Office Industry Volume Share (%), by Asset Class Of Investment 2025 & 2033
- Figure 11: North America Family Office Industry Revenue (Million), by Geography 2025 & 2033
- Figure 12: North America Family Office Industry Volume (Billion), by Geography 2025 & 2033
- Figure 13: North America Family Office Industry Revenue Share (%), by Geography 2025 & 2033
- Figure 14: North America Family Office Industry Volume Share (%), by Geography 2025 & 2033
- Figure 15: North America Family Office Industry Revenue (Million), by North America 2025 & 2033
- Figure 16: North America Family Office Industry Volume (Billion), by North America 2025 & 2033
- Figure 17: North America Family Office Industry Revenue Share (%), by North America 2025 & 2033
- Figure 18: North America Family Office Industry Volume Share (%), by North America 2025 & 2033
- Figure 19: North America Family Office Industry Revenue (Million), by Europe 2025 & 2033
- Figure 20: North America Family Office Industry Volume (Billion), by Europe 2025 & 2033
- Figure 21: North America Family Office Industry Revenue Share (%), by Europe 2025 & 2033
- Figure 22: North America Family Office Industry Volume Share (%), by Europe 2025 & 2033
- Figure 23: North America Family Office Industry Revenue (Million), by Asia-Pacific 2025 & 2033
- Figure 24: North America Family Office Industry Volume (Billion), by Asia-Pacific 2025 & 2033
- Figure 25: North America Family Office Industry Revenue Share (%), by Asia-Pacific 2025 & 2033
- Figure 26: North America Family Office Industry Volume Share (%), by Asia-Pacific 2025 & 2033
- Figure 27: North America Family Office Industry Revenue (Million), by Latin America 2025 & 2033
- Figure 28: North America Family Office Industry Volume (Billion), by Latin America 2025 & 2033
- Figure 29: North America Family Office Industry Revenue Share (%), by Latin America 2025 & 2033
- Figure 30: North America Family Office Industry Volume Share (%), by Latin America 2025 & 2033
- Figure 31: North America Family Office Industry Revenue (Million), by Middle-East and Africa 2025 & 2033
- Figure 32: North America Family Office Industry Volume (Billion), by Middle-East and Africa 2025 & 2033
- Figure 33: North America Family Office Industry Revenue Share (%), by Middle-East and Africa 2025 & 2033
- Figure 34: North America Family Office Industry Volume Share (%), by Middle-East and Africa 2025 & 2033
- Figure 35: North America Family Office Industry Revenue (Million), by Country 2025 & 2033
- Figure 36: North America Family Office Industry Volume (Billion), by Country 2025 & 2033
- Figure 37: North America Family Office Industry Revenue Share (%), by Country 2025 & 2033
- Figure 38: North America Family Office Industry Volume Share (%), by Country 2025 & 2033
- Figure 39: South America Family Office Industry Revenue (Million), by Product 2025 & 2033
- Figure 40: South America Family Office Industry Volume (Billion), by Product 2025 & 2033
- Figure 41: South America Family Office Industry Revenue Share (%), by Product 2025 & 2033
- Figure 42: South America Family Office Industry Volume Share (%), by Product 2025 & 2033
- Figure 43: South America Family Office Industry Revenue (Million), by Asset Class Of Investment 2025 & 2033
- Figure 44: South America Family Office Industry Volume (Billion), by Asset Class Of Investment 2025 & 2033
- Figure 45: South America Family Office Industry Revenue Share (%), by Asset Class Of Investment 2025 & 2033
- Figure 46: South America Family Office Industry Volume Share (%), by Asset Class Of Investment 2025 & 2033
- Figure 47: South America Family Office Industry Revenue (Million), by Geography 2025 & 2033
- Figure 48: South America Family Office Industry Volume (Billion), by Geography 2025 & 2033
- Figure 49: South America Family Office Industry Revenue Share (%), by Geography 2025 & 2033
- Figure 50: South America Family Office Industry Volume Share (%), by Geography 2025 & 2033
- Figure 51: South America Family Office Industry Revenue (Million), by North America 2025 & 2033
- Figure 52: South America Family Office Industry Volume (Billion), by North America 2025 & 2033
- Figure 53: South America Family Office Industry Revenue Share (%), by North America 2025 & 2033
- Figure 54: South America Family Office Industry Volume Share (%), by North America 2025 & 2033
- Figure 55: South America Family Office Industry Revenue (Million), by Europe 2025 & 2033
- Figure 56: South America Family Office Industry Volume (Billion), by Europe 2025 & 2033
- Figure 57: South America Family Office Industry Revenue Share (%), by Europe 2025 & 2033
- Figure 58: South America Family Office Industry Volume Share (%), by Europe 2025 & 2033
- Figure 59: South America Family Office Industry Revenue (Million), by Asia-Pacific 2025 & 2033
- Figure 60: South America Family Office Industry Volume (Billion), by Asia-Pacific 2025 & 2033
- Figure 61: South America Family Office Industry Revenue Share (%), by Asia-Pacific 2025 & 2033
- Figure 62: South America Family Office Industry Volume Share (%), by Asia-Pacific 2025 & 2033
- Figure 63: South America Family Office Industry Revenue (Million), by Latin America 2025 & 2033
- Figure 64: South America Family Office Industry Volume (Billion), by Latin America 2025 & 2033
- Figure 65: South America Family Office Industry Revenue Share (%), by Latin America 2025 & 2033
- Figure 66: South America Family Office Industry Volume Share (%), by Latin America 2025 & 2033
- Figure 67: South America Family Office Industry Revenue (Million), by Middle-East and Africa 2025 & 2033
- Figure 68: South America Family Office Industry Volume (Billion), by Middle-East and Africa 2025 & 2033
- Figure 69: South America Family Office Industry Revenue Share (%), by Middle-East and Africa 2025 & 2033
- Figure 70: South America Family Office Industry Volume Share (%), by Middle-East and Africa 2025 & 2033
- Figure 71: South America Family Office Industry Revenue (Million), by Country 2025 & 2033
- Figure 72: South America Family Office Industry Volume (Billion), by Country 2025 & 2033
- Figure 73: South America Family Office Industry Revenue Share (%), by Country 2025 & 2033
- Figure 74: South America Family Office Industry Volume Share (%), by Country 2025 & 2033
- Figure 75: Europe Family Office Industry Revenue (Million), by Product 2025 & 2033
- Figure 76: Europe Family Office Industry Volume (Billion), by Product 2025 & 2033
- Figure 77: Europe Family Office Industry Revenue Share (%), by Product 2025 & 2033
- Figure 78: Europe Family Office Industry Volume Share (%), by Product 2025 & 2033
- Figure 79: Europe Family Office Industry Revenue (Million), by Asset Class Of Investment 2025 & 2033
- Figure 80: Europe Family Office Industry Volume (Billion), by Asset Class Of Investment 2025 & 2033
- Figure 81: Europe Family Office Industry Revenue Share (%), by Asset Class Of Investment 2025 & 2033
- Figure 82: Europe Family Office Industry Volume Share (%), by Asset Class Of Investment 2025 & 2033
- Figure 83: Europe Family Office Industry Revenue (Million), by Geography 2025 & 2033
- Figure 84: Europe Family Office Industry Volume (Billion), by Geography 2025 & 2033
- Figure 85: Europe Family Office Industry Revenue Share (%), by Geography 2025 & 2033
- Figure 86: Europe Family Office Industry Volume Share (%), by Geography 2025 & 2033
- Figure 87: Europe Family Office Industry Revenue (Million), by North America 2025 & 2033
- Figure 88: Europe Family Office Industry Volume (Billion), by North America 2025 & 2033
- Figure 89: Europe Family Office Industry Revenue Share (%), by North America 2025 & 2033
- Figure 90: Europe Family Office Industry Volume Share (%), by North America 2025 & 2033
- Figure 91: Europe Family Office Industry Revenue (Million), by Europe 2025 & 2033
- Figure 92: Europe Family Office Industry Volume (Billion), by Europe 2025 & 2033
- Figure 93: Europe Family Office Industry Revenue Share (%), by Europe 2025 & 2033
- Figure 94: Europe Family Office Industry Volume Share (%), by Europe 2025 & 2033
- Figure 95: Europe Family Office Industry Revenue (Million), by Asia-Pacific 2025 & 2033
- Figure 96: Europe Family Office Industry Volume (Billion), by Asia-Pacific 2025 & 2033
- Figure 97: Europe Family Office Industry Revenue Share (%), by Asia-Pacific 2025 & 2033
- Figure 98: Europe Family Office Industry Volume Share (%), by Asia-Pacific 2025 & 2033
- Figure 99: Europe Family Office Industry Revenue (Million), by Latin America 2025 & 2033
- Figure 100: Europe Family Office Industry Volume (Billion), by Latin America 2025 & 2033
- Figure 101: Europe Family Office Industry Revenue Share (%), by Latin America 2025 & 2033
- Figure 102: Europe Family Office Industry Volume Share (%), by Latin America 2025 & 2033
- Figure 103: Europe Family Office Industry Revenue (Million), by Middle-East and Africa 2025 & 2033
- Figure 104: Europe Family Office Industry Volume (Billion), by Middle-East and Africa 2025 & 2033
- Figure 105: Europe Family Office Industry Revenue Share (%), by Middle-East and Africa 2025 & 2033
- Figure 106: Europe Family Office Industry Volume Share (%), by Middle-East and Africa 2025 & 2033
- Figure 107: Europe Family Office Industry Revenue (Million), by Country 2025 & 2033
- Figure 108: Europe Family Office Industry Volume (Billion), by Country 2025 & 2033
- Figure 109: Europe Family Office Industry Revenue Share (%), by Country 2025 & 2033
- Figure 110: Europe Family Office Industry Volume Share (%), by Country 2025 & 2033
- Figure 111: Middle East & Africa Family Office Industry Revenue (Million), by Product 2025 & 2033
- Figure 112: Middle East & Africa Family Office Industry Volume (Billion), by Product 2025 & 2033
- Figure 113: Middle East & Africa Family Office Industry Revenue Share (%), by Product 2025 & 2033
- Figure 114: Middle East & Africa Family Office Industry Volume Share (%), by Product 2025 & 2033
- Figure 115: Middle East & Africa Family Office Industry Revenue (Million), by Asset Class Of Investment 2025 & 2033
- Figure 116: Middle East & Africa Family Office Industry Volume (Billion), by Asset Class Of Investment 2025 & 2033
- Figure 117: Middle East & Africa Family Office Industry Revenue Share (%), by Asset Class Of Investment 2025 & 2033
- Figure 118: Middle East & Africa Family Office Industry Volume Share (%), by Asset Class Of Investment 2025 & 2033
- Figure 119: Middle East & Africa Family Office Industry Revenue (Million), by Geography 2025 & 2033
- Figure 120: Middle East & Africa Family Office Industry Volume (Billion), by Geography 2025 & 2033
- Figure 121: Middle East & Africa Family Office Industry Revenue Share (%), by Geography 2025 & 2033
- Figure 122: Middle East & Africa Family Office Industry Volume Share (%), by Geography 2025 & 2033
- Figure 123: Middle East & Africa Family Office Industry Revenue (Million), by North America 2025 & 2033
- Figure 124: Middle East & Africa Family Office Industry Volume (Billion), by North America 2025 & 2033
- Figure 125: Middle East & Africa Family Office Industry Revenue Share (%), by North America 2025 & 2033
- Figure 126: Middle East & Africa Family Office Industry Volume Share (%), by North America 2025 & 2033
- Figure 127: Middle East & Africa Family Office Industry Revenue (Million), by Europe 2025 & 2033
- Figure 128: Middle East & Africa Family Office Industry Volume (Billion), by Europe 2025 & 2033
- Figure 129: Middle East & Africa Family Office Industry Revenue Share (%), by Europe 2025 & 2033
- Figure 130: Middle East & Africa Family Office Industry Volume Share (%), by Europe 2025 & 2033
- Figure 131: Middle East & Africa Family Office Industry Revenue (Million), by Asia-Pacific 2025 & 2033
- Figure 132: Middle East & Africa Family Office Industry Volume (Billion), by Asia-Pacific 2025 & 2033
- Figure 133: Middle East & Africa Family Office Industry Revenue Share (%), by Asia-Pacific 2025 & 2033
- Figure 134: Middle East & Africa Family Office Industry Volume Share (%), by Asia-Pacific 2025 & 2033
- Figure 135: Middle East & Africa Family Office Industry Revenue (Million), by Latin America 2025 & 2033
- Figure 136: Middle East & Africa Family Office Industry Volume (Billion), by Latin America 2025 & 2033
- Figure 137: Middle East & Africa Family Office Industry Revenue Share (%), by Latin America 2025 & 2033
- Figure 138: Middle East & Africa Family Office Industry Volume Share (%), by Latin America 2025 & 2033
- Figure 139: Middle East & Africa Family Office Industry Revenue (Million), by Middle-East and Africa 2025 & 2033
- Figure 140: Middle East & Africa Family Office Industry Volume (Billion), by Middle-East and Africa 2025 & 2033
- Figure 141: Middle East & Africa Family Office Industry Revenue Share (%), by Middle-East and Africa 2025 & 2033
- Figure 142: Middle East & Africa Family Office Industry Volume Share (%), by Middle-East and Africa 2025 & 2033
- Figure 143: Middle East & Africa Family Office Industry Revenue (Million), by Country 2025 & 2033
- Figure 144: Middle East & Africa Family Office Industry Volume (Billion), by Country 2025 & 2033
- Figure 145: Middle East & Africa Family Office Industry Revenue Share (%), by Country 2025 & 2033
- Figure 146: Middle East & Africa Family Office Industry Volume Share (%), by Country 2025 & 2033
- Figure 147: Asia Pacific Family Office Industry Revenue (Million), by Product 2025 & 2033
- Figure 148: Asia Pacific Family Office Industry Volume (Billion), by Product 2025 & 2033
- Figure 149: Asia Pacific Family Office Industry Revenue Share (%), by Product 2025 & 2033
- Figure 150: Asia Pacific Family Office Industry Volume Share (%), by Product 2025 & 2033
- Figure 151: Asia Pacific Family Office Industry Revenue (Million), by Asset Class Of Investment 2025 & 2033
- Figure 152: Asia Pacific Family Office Industry Volume (Billion), by Asset Class Of Investment 2025 & 2033
- Figure 153: Asia Pacific Family Office Industry Revenue Share (%), by Asset Class Of Investment 2025 & 2033
- Figure 154: Asia Pacific Family Office Industry Volume Share (%), by Asset Class Of Investment 2025 & 2033
- Figure 155: Asia Pacific Family Office Industry Revenue (Million), by Geography 2025 & 2033
- Figure 156: Asia Pacific Family Office Industry Volume (Billion), by Geography 2025 & 2033
- Figure 157: Asia Pacific Family Office Industry Revenue Share (%), by Geography 2025 & 2033
- Figure 158: Asia Pacific Family Office Industry Volume Share (%), by Geography 2025 & 2033
- Figure 159: Asia Pacific Family Office Industry Revenue (Million), by North America 2025 & 2033
- Figure 160: Asia Pacific Family Office Industry Volume (Billion), by North America 2025 & 2033
- Figure 161: Asia Pacific Family Office Industry Revenue Share (%), by North America 2025 & 2033
- Figure 162: Asia Pacific Family Office Industry Volume Share (%), by North America 2025 & 2033
- Figure 163: Asia Pacific Family Office Industry Revenue (Million), by Europe 2025 & 2033
- Figure 164: Asia Pacific Family Office Industry Volume (Billion), by Europe 2025 & 2033
- Figure 165: Asia Pacific Family Office Industry Revenue Share (%), by Europe 2025 & 2033
- Figure 166: Asia Pacific Family Office Industry Volume Share (%), by Europe 2025 & 2033
- Figure 167: Asia Pacific Family Office Industry Revenue (Million), by Asia-Pacific 2025 & 2033
- Figure 168: Asia Pacific Family Office Industry Volume (Billion), by Asia-Pacific 2025 & 2033
- Figure 169: Asia Pacific Family Office Industry Revenue Share (%), by Asia-Pacific 2025 & 2033
- Figure 170: Asia Pacific Family Office Industry Volume Share (%), by Asia-Pacific 2025 & 2033
- Figure 171: Asia Pacific Family Office Industry Revenue (Million), by Latin America 2025 & 2033
- Figure 172: Asia Pacific Family Office Industry Volume (Billion), by Latin America 2025 & 2033
- Figure 173: Asia Pacific Family Office Industry Revenue Share (%), by Latin America 2025 & 2033
- Figure 174: Asia Pacific Family Office Industry Volume Share (%), by Latin America 2025 & 2033
- Figure 175: Asia Pacific Family Office Industry Revenue (Million), by Middle-East and Africa 2025 & 2033
- Figure 176: Asia Pacific Family Office Industry Volume (Billion), by Middle-East and Africa 2025 & 2033
- Figure 177: Asia Pacific Family Office Industry Revenue Share (%), by Middle-East and Africa 2025 & 2033
- Figure 178: Asia Pacific Family Office Industry Volume Share (%), by Middle-East and Africa 2025 & 2033
- Figure 179: Asia Pacific Family Office Industry Revenue (Million), by Country 2025 & 2033
- Figure 180: Asia Pacific Family Office Industry Volume (Billion), by Country 2025 & 2033
- Figure 181: Asia Pacific Family Office Industry Revenue Share (%), by Country 2025 & 2033
- Figure 182: Asia Pacific Family Office Industry Volume Share (%), by Country 2025 & 2033
List of Tables
- Table 1: Global Family Office Industry Revenue Million Forecast, by Product 2020 & 2033
- Table 2: Global Family Office Industry Volume Billion Forecast, by Product 2020 & 2033
- Table 3: Global Family Office Industry Revenue Million Forecast, by Asset Class Of Investment 2020 & 2033
- Table 4: Global Family Office Industry Volume Billion Forecast, by Asset Class Of Investment 2020 & 2033
- Table 5: Global Family Office Industry Revenue Million Forecast, by Geography 2020 & 2033
- Table 6: Global Family Office Industry Volume Billion Forecast, by Geography 2020 & 2033
- Table 7: Global Family Office Industry Revenue Million Forecast, by North America 2020 & 2033
- Table 8: Global Family Office Industry Volume Billion Forecast, by North America 2020 & 2033
- Table 9: Global Family Office Industry Revenue Million Forecast, by Europe 2020 & 2033
- Table 10: Global Family Office Industry Volume Billion Forecast, by Europe 2020 & 2033
- Table 11: Global Family Office Industry Revenue Million Forecast, by Asia-Pacific 2020 & 2033
- Table 12: Global Family Office Industry Volume Billion Forecast, by Asia-Pacific 2020 & 2033
- Table 13: Global Family Office Industry Revenue Million Forecast, by Latin America 2020 & 2033
- Table 14: Global Family Office Industry Volume Billion Forecast, by Latin America 2020 & 2033
- Table 15: Global Family Office Industry Revenue Million Forecast, by Middle-East and Africa 2020 & 2033
- Table 16: Global Family Office Industry Volume Billion Forecast, by Middle-East and Africa 2020 & 2033
- Table 17: Global Family Office Industry Revenue Million Forecast, by Region 2020 & 2033
- Table 18: Global Family Office Industry Volume Billion Forecast, by Region 2020 & 2033
- Table 19: Global Family Office Industry Revenue Million Forecast, by Product 2020 & 2033
- Table 20: Global Family Office Industry Volume Billion Forecast, by Product 2020 & 2033
- Table 21: Global Family Office Industry Revenue Million Forecast, by Asset Class Of Investment 2020 & 2033
- Table 22: Global Family Office Industry Volume Billion Forecast, by Asset Class Of Investment 2020 & 2033
- Table 23: Global Family Office Industry Revenue Million Forecast, by Geography 2020 & 2033
- Table 24: Global Family Office Industry Volume Billion Forecast, by Geography 2020 & 2033
- Table 25: Global Family Office Industry Revenue Million Forecast, by North America 2020 & 2033
- Table 26: Global Family Office Industry Volume Billion Forecast, by North America 2020 & 2033
- Table 27: Global Family Office Industry Revenue Million Forecast, by Europe 2020 & 2033
- Table 28: Global Family Office Industry Volume Billion Forecast, by Europe 2020 & 2033
- Table 29: Global Family Office Industry Revenue Million Forecast, by Asia-Pacific 2020 & 2033
- Table 30: Global Family Office Industry Volume Billion Forecast, by Asia-Pacific 2020 & 2033
- Table 31: Global Family Office Industry Revenue Million Forecast, by Latin America 2020 & 2033
- Table 32: Global Family Office Industry Volume Billion Forecast, by Latin America 2020 & 2033
- Table 33: Global Family Office Industry Revenue Million Forecast, by Middle-East and Africa 2020 & 2033
- Table 34: Global Family Office Industry Volume Billion Forecast, by Middle-East and Africa 2020 & 2033
- Table 35: Global Family Office Industry Revenue Million Forecast, by Country 2020 & 2033
- Table 36: Global Family Office Industry Volume Billion Forecast, by Country 2020 & 2033
- Table 37: United States Family Office Industry Revenue (Million) Forecast, by Application 2020 & 2033
- Table 38: United States Family Office Industry Volume (Billion) Forecast, by Application 2020 & 2033
- Table 39: Canada Family Office Industry Revenue (Million) Forecast, by Application 2020 & 2033
- Table 40: Canada Family Office Industry Volume (Billion) Forecast, by Application 2020 & 2033
- Table 41: Mexico Family Office Industry Revenue (Million) Forecast, by Application 2020 & 2033
- Table 42: Mexico Family Office Industry Volume (Billion) Forecast, by Application 2020 & 2033
- Table 43: Global Family Office Industry Revenue Million Forecast, by Product 2020 & 2033
- Table 44: Global Family Office Industry Volume Billion Forecast, by Product 2020 & 2033
- Table 45: Global Family Office Industry Revenue Million Forecast, by Asset Class Of Investment 2020 & 2033
- Table 46: Global Family Office Industry Volume Billion Forecast, by Asset Class Of Investment 2020 & 2033
- Table 47: Global Family Office Industry Revenue Million Forecast, by Geography 2020 & 2033
- Table 48: Global Family Office Industry Volume Billion Forecast, by Geography 2020 & 2033
- Table 49: Global Family Office Industry Revenue Million Forecast, by North America 2020 & 2033
- Table 50: Global Family Office Industry Volume Billion Forecast, by North America 2020 & 2033
- Table 51: Global Family Office Industry Revenue Million Forecast, by Europe 2020 & 2033
- Table 52: Global Family Office Industry Volume Billion Forecast, by Europe 2020 & 2033
- Table 53: Global Family Office Industry Revenue Million Forecast, by Asia-Pacific 2020 & 2033
- Table 54: Global Family Office Industry Volume Billion Forecast, by Asia-Pacific 2020 & 2033
- Table 55: Global Family Office Industry Revenue Million Forecast, by Latin America 2020 & 2033
- Table 56: Global Family Office Industry Volume Billion Forecast, by Latin America 2020 & 2033
- Table 57: Global Family Office Industry Revenue Million Forecast, by Middle-East and Africa 2020 & 2033
- Table 58: Global Family Office Industry Volume Billion Forecast, by Middle-East and Africa 2020 & 2033
- Table 59: Global Family Office Industry Revenue Million Forecast, by Country 2020 & 2033
- Table 60: Global Family Office Industry Volume Billion Forecast, by Country 2020 & 2033
- Table 61: Brazil Family Office Industry Revenue (Million) Forecast, by Application 2020 & 2033
- Table 62: Brazil Family Office Industry Volume (Billion) Forecast, by Application 2020 & 2033
- Table 63: Argentina Family Office Industry Revenue (Million) Forecast, by Application 2020 & 2033
- Table 64: Argentina Family Office Industry Volume (Billion) Forecast, by Application 2020 & 2033
- Table 65: Rest of South America Family Office Industry Revenue (Million) Forecast, by Application 2020 & 2033
- Table 66: Rest of South America Family Office Industry Volume (Billion) Forecast, by Application 2020 & 2033
- Table 67: Global Family Office Industry Revenue Million Forecast, by Product 2020 & 2033
- Table 68: Global Family Office Industry Volume Billion Forecast, by Product 2020 & 2033
- Table 69: Global Family Office Industry Revenue Million Forecast, by Asset Class Of Investment 2020 & 2033
- Table 70: Global Family Office Industry Volume Billion Forecast, by Asset Class Of Investment 2020 & 2033
- Table 71: Global Family Office Industry Revenue Million Forecast, by Geography 2020 & 2033
- Table 72: Global Family Office Industry Volume Billion Forecast, by Geography 2020 & 2033
- Table 73: Global Family Office Industry Revenue Million Forecast, by North America 2020 & 2033
- Table 74: Global Family Office Industry Volume Billion Forecast, by North America 2020 & 2033
- Table 75: Global Family Office Industry Revenue Million Forecast, by Europe 2020 & 2033
- Table 76: Global Family Office Industry Volume Billion Forecast, by Europe 2020 & 2033
- Table 77: Global Family Office Industry Revenue Million Forecast, by Asia-Pacific 2020 & 2033
- Table 78: Global Family Office Industry Volume Billion Forecast, by Asia-Pacific 2020 & 2033
- Table 79: Global Family Office Industry Revenue Million Forecast, by Latin America 2020 & 2033
- Table 80: Global Family Office Industry Volume Billion Forecast, by Latin America 2020 & 2033
- Table 81: Global Family Office Industry Revenue Million Forecast, by Middle-East and Africa 2020 & 2033
- Table 82: Global Family Office Industry Volume Billion Forecast, by Middle-East and Africa 2020 & 2033
- Table 83: Global Family Office Industry Revenue Million Forecast, by Country 2020 & 2033
- Table 84: Global Family Office Industry Volume Billion Forecast, by Country 2020 & 2033
- Table 85: United Kingdom Family Office Industry Revenue (Million) Forecast, by Application 2020 & 2033
- Table 86: United Kingdom Family Office Industry Volume (Billion) Forecast, by Application 2020 & 2033
- Table 87: Germany Family Office Industry Revenue (Million) Forecast, by Application 2020 & 2033
- Table 88: Germany Family Office Industry Volume (Billion) Forecast, by Application 2020 & 2033
- Table 89: France Family Office Industry Revenue (Million) Forecast, by Application 2020 & 2033
- Table 90: France Family Office Industry Volume (Billion) Forecast, by Application 2020 & 2033
- Table 91: Italy Family Office Industry Revenue (Million) Forecast, by Application 2020 & 2033
- Table 92: Italy Family Office Industry Volume (Billion) Forecast, by Application 2020 & 2033
- Table 93: Spain Family Office Industry Revenue (Million) Forecast, by Application 2020 & 2033
- Table 94: Spain Family Office Industry Volume (Billion) Forecast, by Application 2020 & 2033
- Table 95: Russia Family Office Industry Revenue (Million) Forecast, by Application 2020 & 2033
- Table 96: Russia Family Office Industry Volume (Billion) Forecast, by Application 2020 & 2033
- Table 97: Benelux Family Office Industry Revenue (Million) Forecast, by Application 2020 & 2033
- Table 98: Benelux Family Office Industry Volume (Billion) Forecast, by Application 2020 & 2033
- Table 99: Nordics Family Office Industry Revenue (Million) Forecast, by Application 2020 & 2033
- Table 100: Nordics Family Office Industry Volume (Billion) Forecast, by Application 2020 & 2033
- Table 101: Rest of Europe Family Office Industry Revenue (Million) Forecast, by Application 2020 & 2033
- Table 102: Rest of Europe Family Office Industry Volume (Billion) Forecast, by Application 2020 & 2033
- Table 103: Global Family Office Industry Revenue Million Forecast, by Product 2020 & 2033
- Table 104: Global Family Office Industry Volume Billion Forecast, by Product 2020 & 2033
- Table 105: Global Family Office Industry Revenue Million Forecast, by Asset Class Of Investment 2020 & 2033
- Table 106: Global Family Office Industry Volume Billion Forecast, by Asset Class Of Investment 2020 & 2033
- Table 107: Global Family Office Industry Revenue Million Forecast, by Geography 2020 & 2033
- Table 108: Global Family Office Industry Volume Billion Forecast, by Geography 2020 & 2033
- Table 109: Global Family Office Industry Revenue Million Forecast, by North America 2020 & 2033
- Table 110: Global Family Office Industry Volume Billion Forecast, by North America 2020 & 2033
- Table 111: Global Family Office Industry Revenue Million Forecast, by Europe 2020 & 2033
- Table 112: Global Family Office Industry Volume Billion Forecast, by Europe 2020 & 2033
- Table 113: Global Family Office Industry Revenue Million Forecast, by Asia-Pacific 2020 & 2033
- Table 114: Global Family Office Industry Volume Billion Forecast, by Asia-Pacific 2020 & 2033
- Table 115: Global Family Office Industry Revenue Million Forecast, by Latin America 2020 & 2033
- Table 116: Global Family Office Industry Volume Billion Forecast, by Latin America 2020 & 2033
- Table 117: Global Family Office Industry Revenue Million Forecast, by Middle-East and Africa 2020 & 2033
- Table 118: Global Family Office Industry Volume Billion Forecast, by Middle-East and Africa 2020 & 2033
- Table 119: Global Family Office Industry Revenue Million Forecast, by Country 2020 & 2033
- Table 120: Global Family Office Industry Volume Billion Forecast, by Country 2020 & 2033
- Table 121: Turkey Family Office Industry Revenue (Million) Forecast, by Application 2020 & 2033
- Table 122: Turkey Family Office Industry Volume (Billion) Forecast, by Application 2020 & 2033
- Table 123: Israel Family Office Industry Revenue (Million) Forecast, by Application 2020 & 2033
- Table 124: Israel Family Office Industry Volume (Billion) Forecast, by Application 2020 & 2033
- Table 125: GCC Family Office Industry Revenue (Million) Forecast, by Application 2020 & 2033
- Table 126: GCC Family Office Industry Volume (Billion) Forecast, by Application 2020 & 2033
- Table 127: North Africa Family Office Industry Revenue (Million) Forecast, by Application 2020 & 2033
- Table 128: North Africa Family Office Industry Volume (Billion) Forecast, by Application 2020 & 2033
- Table 129: South Africa Family Office Industry Revenue (Million) Forecast, by Application 2020 & 2033
- Table 130: South Africa Family Office Industry Volume (Billion) Forecast, by Application 2020 & 2033
- Table 131: Rest of Middle East & Africa Family Office Industry Revenue (Million) Forecast, by Application 2020 & 2033
- Table 132: Rest of Middle East & Africa Family Office Industry Volume (Billion) Forecast, by Application 2020 & 2033
- Table 133: Global Family Office Industry Revenue Million Forecast, by Product 2020 & 2033
- Table 134: Global Family Office Industry Volume Billion Forecast, by Product 2020 & 2033
- Table 135: Global Family Office Industry Revenue Million Forecast, by Asset Class Of Investment 2020 & 2033
- Table 136: Global Family Office Industry Volume Billion Forecast, by Asset Class Of Investment 2020 & 2033
- Table 137: Global Family Office Industry Revenue Million Forecast, by Geography 2020 & 2033
- Table 138: Global Family Office Industry Volume Billion Forecast, by Geography 2020 & 2033
- Table 139: Global Family Office Industry Revenue Million Forecast, by North America 2020 & 2033
- Table 140: Global Family Office Industry Volume Billion Forecast, by North America 2020 & 2033
- Table 141: Global Family Office Industry Revenue Million Forecast, by Europe 2020 & 2033
- Table 142: Global Family Office Industry Volume Billion Forecast, by Europe 2020 & 2033
- Table 143: Global Family Office Industry Revenue Million Forecast, by Asia-Pacific 2020 & 2033
- Table 144: Global Family Office Industry Volume Billion Forecast, by Asia-Pacific 2020 & 2033
- Table 145: Global Family Office Industry Revenue Million Forecast, by Latin America 2020 & 2033
- Table 146: Global Family Office Industry Volume Billion Forecast, by Latin America 2020 & 2033
- Table 147: Global Family Office Industry Revenue Million Forecast, by Middle-East and Africa 2020 & 2033
- Table 148: Global Family Office Industry Volume Billion Forecast, by Middle-East and Africa 2020 & 2033
- Table 149: Global Family Office Industry Revenue Million Forecast, by Country 2020 & 2033
- Table 150: Global Family Office Industry Volume Billion Forecast, by Country 2020 & 2033
- Table 151: China Family Office Industry Revenue (Million) Forecast, by Application 2020 & 2033
- Table 152: China Family Office Industry Volume (Billion) Forecast, by Application 2020 & 2033
- Table 153: India Family Office Industry Revenue (Million) Forecast, by Application 2020 & 2033
- Table 154: India Family Office Industry Volume (Billion) Forecast, by Application 2020 & 2033
- Table 155: Japan Family Office Industry Revenue (Million) Forecast, by Application 2020 & 2033
- Table 156: Japan Family Office Industry Volume (Billion) Forecast, by Application 2020 & 2033
- Table 157: South Korea Family Office Industry Revenue (Million) Forecast, by Application 2020 & 2033
- Table 158: South Korea Family Office Industry Volume (Billion) Forecast, by Application 2020 & 2033
- Table 159: ASEAN Family Office Industry Revenue (Million) Forecast, by Application 2020 & 2033
- Table 160: ASEAN Family Office Industry Volume (Billion) Forecast, by Application 2020 & 2033
- Table 161: Oceania Family Office Industry Revenue (Million) Forecast, by Application 2020 & 2033
- Table 162: Oceania Family Office Industry Volume (Billion) Forecast, by Application 2020 & 2033
- Table 163: Rest of Asia Pacific Family Office Industry Revenue (Million) Forecast, by Application 2020 & 2033
- Table 164: Rest of Asia Pacific Family Office Industry Volume (Billion) Forecast, by Application 2020 & 2033
Frequently Asked Questions
1. What is the projected Compound Annual Growth Rate (CAGR) of the Family Office Industry?
The projected CAGR is approximately 6.52%.
2. Which companies are prominent players in the Family Office Industry?
Key companies in the market include Cascade Investment LLC, Bezos Expeditions, Bessemer Trust, MSD Capital, Stonehage Fleming, Glenmede, Emerson Collective, U S Trust - Bank of America Private Wealth Management, Bespoke Wealth Management, JPMorgan Chase Wealth Management, Goldman Sachs Family Office, Silvercrest Asset Management**List Not Exhaustive.
3. What are the main segments of the Family Office Industry?
The market segments include Product, Asset Class Of Investment, Geography, North America, Europe, Asia-Pacific, Latin America, Middle-East and Africa.
4. Can you provide details about the market size?
The market size is estimated to be USD 18.90 Million as of 2022.
5. What are some drivers contributing to market growth?
Demand for Customzied Solution; Growth In The Number of High Networth Individuals Across Regions.
6. What are the notable trends driving market growth?
Single-Family Offices Represent the Largest Segment of the Market.
7. Are there any restraints impacting market growth?
Demand for Customzied Solution; Growth In The Number of High Networth Individuals Across Regions.
8. Can you provide examples of recent developments in the market?
March 2023 - Cascade Partners acquired BlueWater Partners LLC, based in Grand Rapids, MI. This partnership brought together two firms dedicated to client service, increasing their capacity and offering a wide range of consulting services, including restructuring and performance improvements.
9. What pricing options are available for accessing the report?
Pricing options include single-user, multi-user, and enterprise licenses priced at USD 4750, USD 5250, and USD 8750 respectively.
10. Is the market size provided in terms of value or volume?
The market size is provided in terms of value, measured in Million and volume, measured in Billion.
11. Are there any specific market keywords associated with the report?
Yes, the market keyword associated with the report is "Family Office Industry," which aids in identifying and referencing the specific market segment covered.
12. How do I determine which pricing option suits my needs best?
The pricing options vary based on user requirements and access needs. Individual users may opt for single-user licenses, while businesses requiring broader access may choose multi-user or enterprise licenses for cost-effective access to the report.
13. Are there any additional resources or data provided in the Family Office Industry report?
While the report offers comprehensive insights, it's advisable to review the specific contents or supplementary materials provided to ascertain if additional resources or data are available.
14. How can I stay updated on further developments or reports in the Family Office Industry?
To stay informed about further developments, trends, and reports in the Family Office Industry, consider subscribing to industry newsletters, following relevant companies and organizations, or regularly checking reputable industry news sources and publications.
Methodology
Step 1 - Identification of Relevant Samples Size from Population Database


Step 2 - Approaches for Defining Global Market Size (Value, Volume* & Price*)

Note*: In applicable scenarios
Step 3 - Data Sources
Primary Research
- Web Analytics
- Survey Reports
- Research Institute
- Latest Research Reports
- Opinion Leaders
Secondary Research
- Annual Reports
- White Paper
- Latest Press Release
- Industry Association
- Paid Database
- Investor Presentations

Step 4 - Data Triangulation
Involves using different sources of information in order to increase the validity of a study
These sources are likely to be stakeholders in a program - participants, other researchers, program staff, other community members, and so on.
Then we put all data in single framework & apply various statistical tools to find out the dynamic on the market.
During the analysis stage, feedback from the stakeholder groups would be compared to determine areas of agreement as well as areas of divergence