

Key Insights
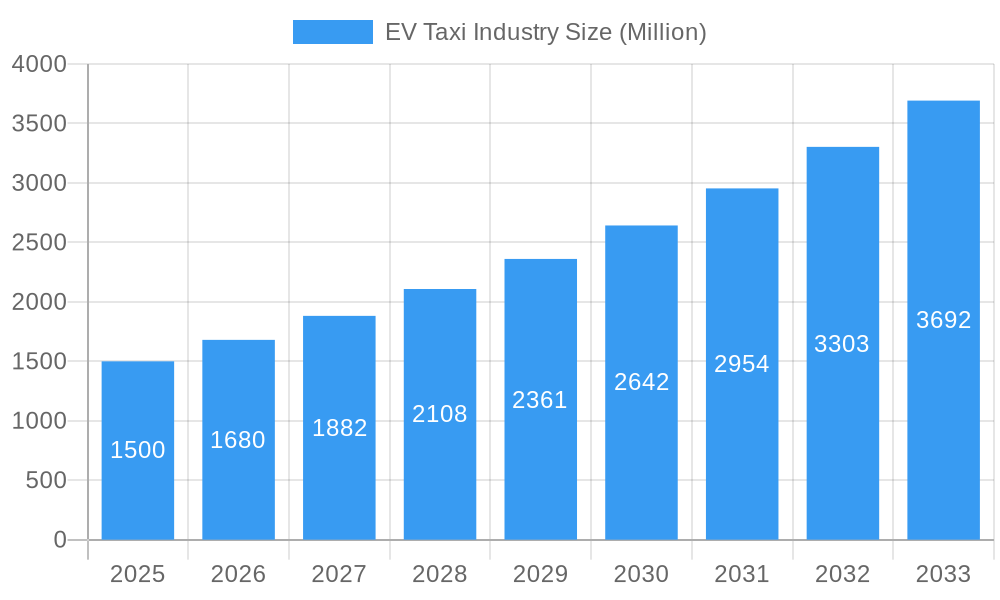
The global electric vehicle (EV) taxi market is projected for substantial growth, propelled by escalating environmental awareness, supportive government policies for EV adoption, and decreasing EV battery costs. Anticipated to expand at a Compound Annual Growth Rate (CAGR) of 25.56%, the market was valued at 29.54 billion in the base year 2025. This expansion is underpinned by rising fuel costs, making EVs a more economical choice, enhanced charging infrastructure availability, and a growing consumer preference for sustainable travel. The market is categorized by vehicle type (two-wheelers and four-wheelers) and EV type (hybrid and battery electric vehicles). While battery electric vehicles are expected to lead due to zero emissions, hybrid electric vehicles provide a viable interim solution for taxi operators. Key industry players, including Ola Cabs, Uber, and Blu Smart Mobility, are making significant investments in EV taxi fleets, driving competition and innovation. Geographic segments such as North America, Europe, and Asia-Pacific offer strong growth potential, with regional dynamics influenced by government regulations, charging infrastructure development, and consumer acceptance. Key challenges include the high initial cost of EVs, driver and passenger range anxiety, and the necessity for extensive charging infrastructure development, particularly in less developed regions.
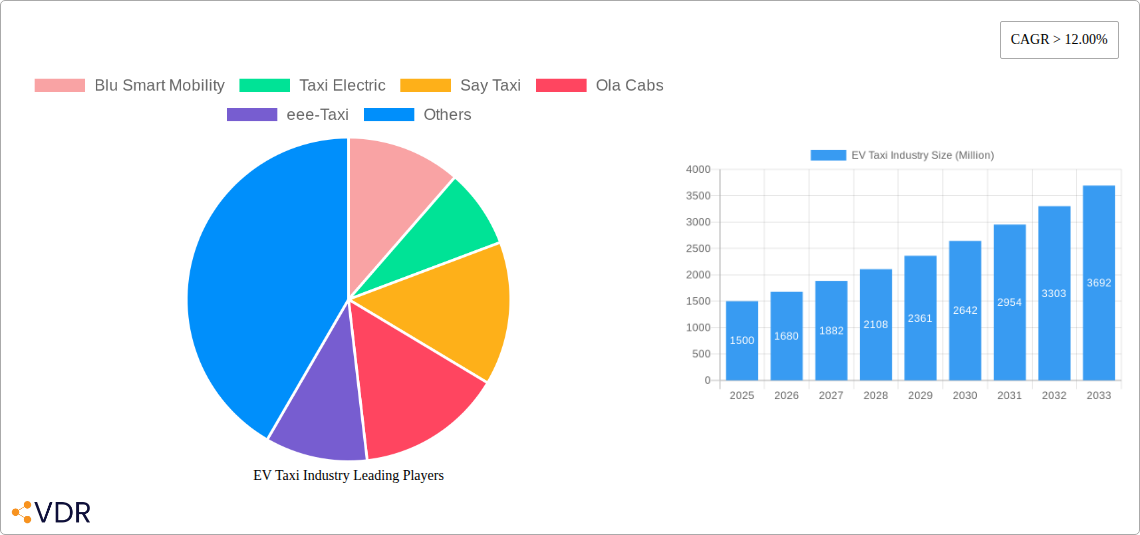
EV Taxi Industry Market Size (In Billion)
The four-wheeler segment currently dominates the market share over the two-wheeler segment, attributed to higher passenger capacity and longer operational ranges. Nevertheless, the two-wheeler segment is positioned for significant growth in congested urban environments, offering superior maneuverability and reduced traffic impact. Regional strategies are crucial; government incentives in China and Europe are accelerating EV taxi adoption, while consumer demand for sustainable transport fuels growth in North America. In emerging markets like India, the affordability of two-wheeler EVs makes this segment particularly attractive. Continuous investment in research and development to enhance battery technology and reduce EV costs bolsters long-term market prospects. Strategic collaborations among EV manufacturers, charging infrastructure providers, and taxi aggregators will be instrumental in accelerating market penetration.
EV Taxi Industry Company Market Share
The Electric Vehicle (EV) Taxi Industry: A Comprehensive Market Report (2019-2033)
This comprehensive report provides an in-depth analysis of the burgeoning EV taxi industry, encompassing market dynamics, growth trends, competitive landscape, and future outlook. With a study period spanning 2019-2033, a base year of 2025, and an estimated and forecast period of 2025-2033, this report is an invaluable resource for industry professionals, investors, and strategists seeking to navigate this rapidly evolving sector. The report segments the market by vehicle type (Two Wheeler Taxi, Four Wheeler Taxi) and powertrain (Hybrid Electric Vehicle, Battery Electric Vehicle), offering granular insights into key market segments.
EV Taxi Industry Market Dynamics & Structure
The EV taxi market is characterized by increasing market concentration, with key players like Ola Cabs and Uber aggressively expanding their fleets. Technological innovation, driven by advancements in battery technology and autonomous driving capabilities, is a major growth driver. Stringent emission regulations globally are further accelerating the shift towards EVs. However, high initial investment costs and limited charging infrastructure remain significant barriers. The market witnesses continuous mergers and acquisitions (M&A) activity, with an estimated xx million deals in the historical period (2019-2024).
- Market Concentration: Highly fragmented in early stages, consolidating towards larger players. Estimated market share of top 3 players in 2025: xx%.
- Technological Innovation: Battery range improvements, fast-charging infrastructure development, autonomous driving integration.
- Regulatory Framework: Government incentives (subsidies, tax breaks) and emission standards are key drivers.
- Competitive Substitutes: Traditional gasoline-powered taxis and ride-sharing services.
- End-User Demographics: Primarily urban populations with high disposable income and environmental awareness.
- M&A Trends: xx million deals (2019-2024), with an anticipated increase in strategic acquisitions in the forecast period.
EV Taxi Industry Growth Trends & Insights
The global EV taxi market experienced significant growth during the historical period (2019-2024), driven by increasing environmental concerns and technological advancements. The market size reached xx million units in 2024. This robust growth is projected to continue throughout the forecast period (2025-2033), with a Compound Annual Growth Rate (CAGR) of xx%. This expansion is fueled by rising adoption rates, particularly in urban areas with robust public transportation initiatives. Technological disruptions, such as the development of autonomous driving systems, are poised to further accelerate market growth. Consumer behavior is also shifting towards environmentally friendly transportation options, further boosting the demand for EV taxis.
Dominant Regions, Countries, or Segments in EV Taxi Industry
The EV taxi market is witnessing varied growth across regions, with [Name of Region/Country - e.g., North America/China] emerging as the dominant region, owing to supportive government policies, well-developed charging infrastructure, and high adoption rates. The four-wheeler taxi segment currently dominates, representing xx million units in 2025, but the two-wheeler taxi segment is expected to see significant growth, particularly in densely populated urban areas. Battery Electric Vehicles (BEVs) are gradually surpassing Hybrid Electric Vehicles (HEVs) in market share due to increasing battery range and performance.
- Key Drivers (North America): Strong government incentives, well-established charging infrastructure, high consumer demand.
- Key Drivers (China): Massive government investments in EV infrastructure, high production volumes, strong domestic demand.
- Dominance Factors: Market share, growth potential, government support, consumer preference.
EV Taxi Industry Product Landscape
The EV taxi industry offers a diverse range of vehicles, from compact two-wheelers to spacious four-wheelers. Innovations focus on increasing battery range, improving charging speed, and integrating advanced driver-assistance systems (ADAS). Key features include improved passenger comfort, safety features, and optimized route planning for efficient operation. Companies are focusing on unique selling propositions such as enhanced charging capabilities and fleet management systems.
Key Drivers, Barriers & Challenges in EV Taxi Industry
Key Drivers:
- Technological advancements in battery technology and autonomous driving.
- Government regulations and incentives promoting EV adoption.
- Growing consumer preference for sustainable transportation.
Key Challenges:
- High initial investment costs for EV taxis.
- Limited charging infrastructure, particularly in certain regions.
- Competition from traditional gasoline-powered taxis and ride-sharing services. This competition represents an estimated xx million unit market share in 2025.
Emerging Opportunities in EV Taxi Industry
- Expansion into untapped markets in developing countries.
- Integration of advanced technologies, such as autonomous driving and connected car features.
- Customization of EV taxis to cater to specific customer needs (e.g., luxury services).
Growth Accelerators in the EV Taxi Industry Industry
Technological advancements, strategic partnerships between automakers and ride-sharing companies, and government investments in charging infrastructure are key growth catalysts. The expansion of the EV taxi market into new geographic regions and the adoption of innovative business models further fuel long-term growth.
Key Players Shaping the EV Taxi Market
- Blu Smart Mobility
- Taxi Electric
- Say Taxi
- Ola Cabs
- eee-Taxi
- Connexxion
- Uber
- Prakrit
Notable Milestones in EV Taxi Industry Sector
- 2020: Introduction of the first all-electric taxi fleet in [City/Region].
- 2021: Government announces substantial subsidies for EV taxi adoption.
- 2022: Major ride-sharing company commits to an all-EV fleet by [Year].
- 2023: Significant expansion of charging infrastructure in major cities.
In-Depth EV Taxi Industry Market Outlook
The EV taxi market is poised for substantial growth in the coming years, driven by technological innovation, supportive government policies, and increasing consumer demand for sustainable transportation options. Strategic partnerships and market expansions will be crucial for success in this competitive landscape. The market is predicted to reach xx million units by 2033, presenting significant opportunities for investors and industry players.
EV Taxi Industry Segmentation
-
1. Type
- 1.1. Hybrid Electric Vehicle
- 1.2. Battery Electric Vehicle
-
2. Vehicle Type
- 2.1. Two Wheeler Taxi
- 2.2. Four Wheeler Taxi
EV Taxi Industry Segmentation By Geography
- 1. United States
- 2. Canada
- 3. Rest of North America
- 4. Germany
- 5. United Kingdom
- 6. France
- 7. Italy
- 8. Rest of Europe
- 9. China
- 10. India
- 11. Japan
- 12. South Korea
- 13. Rest of Asia Pacific
- 14. Mexico
- 15. Brazil
- 16. United Arab Emirates
- 17. Other Countries
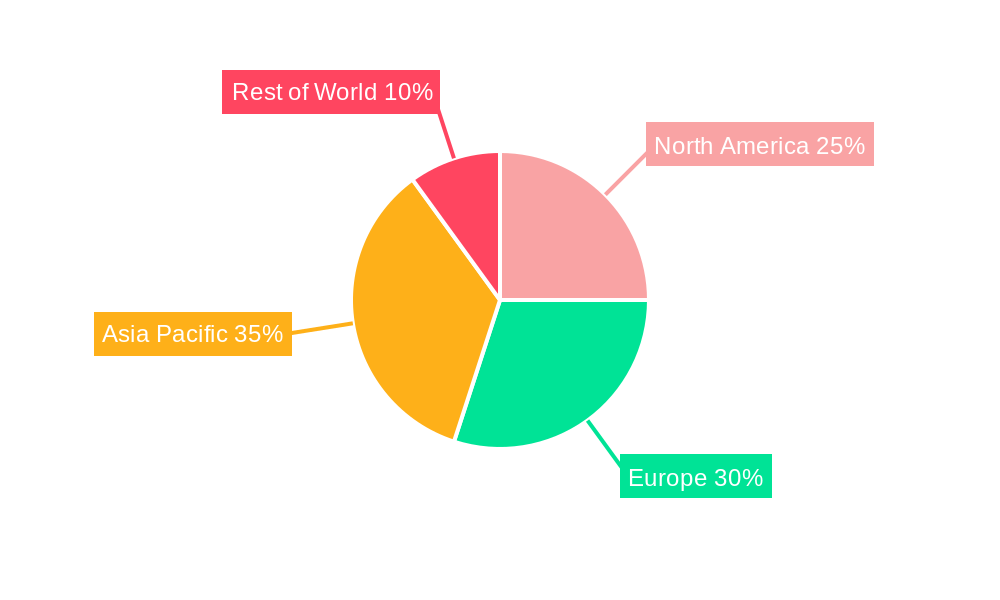
EV Taxi Industry Regional Market Share
Geographic Coverage of EV Taxi Industry
EV Taxi Industry REPORT HIGHLIGHTS
| Aspects | Details |
|---|---|
| Study Period | 2020-2034 |
| Base Year | 2025 |
| Estimated Year | 2026 |
| Forecast Period | 2026-2034 |
| Historical Period | 2020-2025 |
| Growth Rate | CAGR of 25.56% from 2020-2034 |
| Segmentation |
|
Table of Contents
- 1. Introduction
- 1.1. Research Scope
- 1.2. Market Segmentation
- 1.3. Research Objective
- 1.4. Definitions and Assumptions
- 2. Executive Summary
- 2.1. Market Snapshot
- 3. Market Dynamics
- 3.1. Market Drivers
- 3.2. Market Restrains
- 3.3. Market Trends
- 3.4. Market Opportunities
- 4. Market Factor Analysis
- 4.1. Porters Five Forces
- 4.1.1. Bargaining Power of Suppliers
- 4.1.2. Bargaining Power of Buyers
- 4.1.3. Threat of New Entrants
- 4.1.4. Threat of Substitutes
- 4.1.5. Competitive Rivalry
- 4.2. PESTEL analysis
- 4.3. BCG Analysis
- 4.3.1. Stars (High Growth, High Market Share)
- 4.3.2. Cash Cows (Low Growth, High Market Share)
- 4.3.3. Question Mark (High Growth, Low Market Share)
- 4.3.4. Dogs (Low Growth, Low Market Share)
- 4.4. Ansoff Matrix Analysis
- 4.5. Supply Chain Analysis
- 4.6. Regulatory Landscape
- 4.7. Current Market Potential and Opportunity Assessment (TAM–SAM–SOM Framework)
- 4.8. VDR Analyst Note
- 4.1. Porters Five Forces
- 5. Market Analysis, Insights and Forecast 2021-2033
- 5.1. Market Analysis, Insights and Forecast - by Type
- 5.1.1. Hybrid Electric Vehicle
- 5.1.2. Battery Electric Vehicle
- 5.2. Market Analysis, Insights and Forecast - by Vehicle Type
- 5.2.1. Two Wheeler Taxi
- 5.2.2. Four Wheeler Taxi
- 5.3. Market Analysis, Insights and Forecast - by Region
- 5.3.1. United States
- 5.3.2. Canada
- 5.3.3. Rest of North America
- 5.3.4. Germany
- 5.3.5. United Kingdom
- 5.3.6. France
- 5.3.7. Italy
- 5.3.8. Rest of Europe
- 5.3.9. China
- 5.3.10. India
- 5.3.11. Japan
- 5.3.12. South Korea
- 5.3.13. Rest of Asia Pacific
- 5.3.14. Mexico
- 5.3.15. Brazil
- 5.3.16. United Arab Emirates
- 5.3.17. Other Countries
- 5.1. Market Analysis, Insights and Forecast - by Type
- 6. Global EV Taxi Industry Analysis, Insights and Forecast, 2021-2033
- 6.1. Market Analysis, Insights and Forecast - by Type
- 6.1.1. Hybrid Electric Vehicle
- 6.1.2. Battery Electric Vehicle
- 6.2. Market Analysis, Insights and Forecast - by Vehicle Type
- 6.2.1. Two Wheeler Taxi
- 6.2.2. Four Wheeler Taxi
- 6.1. Market Analysis, Insights and Forecast - by Type
- 7. United States EV Taxi Industry Analysis, Insights and Forecast, 2021-2033
- 7.1. Market Analysis, Insights and Forecast - by Type
- 7.1.1. Hybrid Electric Vehicle
- 7.1.2. Battery Electric Vehicle
- 7.2. Market Analysis, Insights and Forecast - by Vehicle Type
- 7.2.1. Two Wheeler Taxi
- 7.2.2. Four Wheeler Taxi
- 7.1. Market Analysis, Insights and Forecast - by Type
- 8. Canada EV Taxi Industry Analysis, Insights and Forecast, 2021-2033
- 8.1. Market Analysis, Insights and Forecast - by Type
- 8.1.1. Hybrid Electric Vehicle
- 8.1.2. Battery Electric Vehicle
- 8.2. Market Analysis, Insights and Forecast - by Vehicle Type
- 8.2.1. Two Wheeler Taxi
- 8.2.2. Four Wheeler Taxi
- 8.1. Market Analysis, Insights and Forecast - by Type
- 9. Rest of North America EV Taxi Industry Analysis, Insights and Forecast, 2021-2033
- 9.1. Market Analysis, Insights and Forecast - by Type
- 9.1.1. Hybrid Electric Vehicle
- 9.1.2. Battery Electric Vehicle
- 9.2. Market Analysis, Insights and Forecast - by Vehicle Type
- 9.2.1. Two Wheeler Taxi
- 9.2.2. Four Wheeler Taxi
- 9.1. Market Analysis, Insights and Forecast - by Type
- 10. Germany EV Taxi Industry Analysis, Insights and Forecast, 2021-2033
- 10.1. Market Analysis, Insights and Forecast - by Type
- 10.1.1. Hybrid Electric Vehicle
- 10.1.2. Battery Electric Vehicle
- 10.2. Market Analysis, Insights and Forecast - by Vehicle Type
- 10.2.1. Two Wheeler Taxi
- 10.2.2. Four Wheeler Taxi
- 10.1. Market Analysis, Insights and Forecast - by Type
- 11. United Kingdom EV Taxi Industry Analysis, Insights and Forecast, 2021-2033
- 11.1. Market Analysis, Insights and Forecast - by Type
- 11.1.1. Hybrid Electric Vehicle
- 11.1.2. Battery Electric Vehicle
- 11.2. Market Analysis, Insights and Forecast - by Vehicle Type
- 11.2.1. Two Wheeler Taxi
- 11.2.2. Four Wheeler Taxi
- 11.1. Market Analysis, Insights and Forecast - by Type
- 12. France EV Taxi Industry Analysis, Insights and Forecast, 2021-2033
- 12.1. Market Analysis, Insights and Forecast - by Type
- 12.1.1. Hybrid Electric Vehicle
- 12.1.2. Battery Electric Vehicle
- 12.2. Market Analysis, Insights and Forecast - by Vehicle Type
- 12.2.1. Two Wheeler Taxi
- 12.2.2. Four Wheeler Taxi
- 12.1. Market Analysis, Insights and Forecast - by Type
- 13. Italy EV Taxi Industry Analysis, Insights and Forecast, 2021-2033
- 13.1. Market Analysis, Insights and Forecast - by Type
- 13.1.1. Hybrid Electric Vehicle
- 13.1.2. Battery Electric Vehicle
- 13.2. Market Analysis, Insights and Forecast - by Vehicle Type
- 13.2.1. Two Wheeler Taxi
- 13.2.2. Four Wheeler Taxi
- 13.1. Market Analysis, Insights and Forecast - by Type
- 14. Rest of Europe EV Taxi Industry Analysis, Insights and Forecast, 2021-2033
- 14.1. Market Analysis, Insights and Forecast - by Type
- 14.1.1. Hybrid Electric Vehicle
- 14.1.2. Battery Electric Vehicle
- 14.2. Market Analysis, Insights and Forecast - by Vehicle Type
- 14.2.1. Two Wheeler Taxi
- 14.2.2. Four Wheeler Taxi
- 14.1. Market Analysis, Insights and Forecast - by Type
- 15. China EV Taxi Industry Analysis, Insights and Forecast, 2021-2033
- 15.1. Market Analysis, Insights and Forecast - by Type
- 15.1.1. Hybrid Electric Vehicle
- 15.1.2. Battery Electric Vehicle
- 15.2. Market Analysis, Insights and Forecast - by Vehicle Type
- 15.2.1. Two Wheeler Taxi
- 15.2.2. Four Wheeler Taxi
- 15.1. Market Analysis, Insights and Forecast - by Type
- 16. India EV Taxi Industry Analysis, Insights and Forecast, 2021-2033
- 16.1. Market Analysis, Insights and Forecast - by Type
- 16.1.1. Hybrid Electric Vehicle
- 16.1.2. Battery Electric Vehicle
- 16.2. Market Analysis, Insights and Forecast - by Vehicle Type
- 16.2.1. Two Wheeler Taxi
- 16.2.2. Four Wheeler Taxi
- 16.1. Market Analysis, Insights and Forecast - by Type
- 17. Japan EV Taxi Industry Analysis, Insights and Forecast, 2021-2033
- 17.1. Market Analysis, Insights and Forecast - by Type
- 17.1.1. Hybrid Electric Vehicle
- 17.1.2. Battery Electric Vehicle
- 17.2. Market Analysis, Insights and Forecast - by Vehicle Type
- 17.2.1. Two Wheeler Taxi
- 17.2.2. Four Wheeler Taxi
- 17.1. Market Analysis, Insights and Forecast - by Type
- 18. South Korea EV Taxi Industry Analysis, Insights and Forecast, 2021-2033
- 18.1. Market Analysis, Insights and Forecast - by Type
- 18.1.1. Hybrid Electric Vehicle
- 18.1.2. Battery Electric Vehicle
- 18.2. Market Analysis, Insights and Forecast - by Vehicle Type
- 18.2.1. Two Wheeler Taxi
- 18.2.2. Four Wheeler Taxi
- 18.1. Market Analysis, Insights and Forecast - by Type
- 19. Rest of Asia Pacific EV Taxi Industry Analysis, Insights and Forecast, 2021-2033
- 19.1. Market Analysis, Insights and Forecast - by Type
- 19.1.1. Hybrid Electric Vehicle
- 19.1.2. Battery Electric Vehicle
- 19.2. Market Analysis, Insights and Forecast - by Vehicle Type
- 19.2.1. Two Wheeler Taxi
- 19.2.2. Four Wheeler Taxi
- 19.1. Market Analysis, Insights and Forecast - by Type
- 20. Mexico EV Taxi Industry Analysis, Insights and Forecast, 2021-2033
- 20.1. Market Analysis, Insights and Forecast - by Type
- 20.1.1. Hybrid Electric Vehicle
- 20.1.2. Battery Electric Vehicle
- 20.2. Market Analysis, Insights and Forecast - by Vehicle Type
- 20.2.1. Two Wheeler Taxi
- 20.2.2. Four Wheeler Taxi
- 20.1. Market Analysis, Insights and Forecast - by Type
- 21. Brazil EV Taxi Industry Analysis, Insights and Forecast, 2021-2033
- 21.1. Market Analysis, Insights and Forecast - by Type
- 21.1.1. Hybrid Electric Vehicle
- 21.1.2. Battery Electric Vehicle
- 21.2. Market Analysis, Insights and Forecast - by Vehicle Type
- 21.2.1. Two Wheeler Taxi
- 21.2.2. Four Wheeler Taxi
- 21.1. Market Analysis, Insights and Forecast - by Type
- 22. United Arab Emirates EV Taxi Industry Analysis, Insights and Forecast, 2021-2033
- 22.1. Market Analysis, Insights and Forecast - by Type
- 22.1.1. Hybrid Electric Vehicle
- 22.1.2. Battery Electric Vehicle
- 22.2. Market Analysis, Insights and Forecast - by Vehicle Type
- 22.2.1. Two Wheeler Taxi
- 22.2.2. Four Wheeler Taxi
- 22.1. Market Analysis, Insights and Forecast - by Type
- 23. Other Countries EV Taxi Industry Analysis, Insights and Forecast, 2021-2033
- 23.1. Market Analysis, Insights and Forecast - by Type
- 23.1.1. Hybrid Electric Vehicle
- 23.1.2. Battery Electric Vehicle
- 23.2. Market Analysis, Insights and Forecast - by Vehicle Type
- 23.2.1. Two Wheeler Taxi
- 23.2.2. Four Wheeler Taxi
- 23.1. Market Analysis, Insights and Forecast - by Type
- 24. Competitive Analysis
- 24.1. Company Profiles
- 24.1.1 Blu Smart Mobility
- 24.1.1.1. Company Overview
- 24.1.1.2. Products
- 24.1.1.3. Company Financials
- 24.1.1.4. SWOT Analysis
- 24.1.2 Taxi Electric
- 24.1.2.1. Company Overview
- 24.1.2.2. Products
- 24.1.2.3. Company Financials
- 24.1.2.4. SWOT Analysis
- 24.1.3 Say Taxi
- 24.1.3.1. Company Overview
- 24.1.3.2. Products
- 24.1.3.3. Company Financials
- 24.1.3.4. SWOT Analysis
- 24.1.4 Ola Cabs
- 24.1.4.1. Company Overview
- 24.1.4.2. Products
- 24.1.4.3. Company Financials
- 24.1.4.4. SWOT Analysis
- 24.1.5 eee-Taxi
- 24.1.5.1. Company Overview
- 24.1.5.2. Products
- 24.1.5.3. Company Financials
- 24.1.5.4. SWOT Analysis
- 24.1.6 Connexxion
- 24.1.6.1. Company Overview
- 24.1.6.2. Products
- 24.1.6.3. Company Financials
- 24.1.6.4. SWOT Analysis
- 24.1.7 Uber
- 24.1.7.1. Company Overview
- 24.1.7.2. Products
- 24.1.7.3. Company Financials
- 24.1.7.4. SWOT Analysis
- 24.1.8 Prakrit
- 24.1.8.1. Company Overview
- 24.1.8.2. Products
- 24.1.8.3. Company Financials
- 24.1.8.4. SWOT Analysis
- 24.1.1 Blu Smart Mobility
- 24.2. Market Entropy
- 24.2.1 Company's Key Areas Served
- 24.2.2 Recent Developments
- 24.3. Company Market Share Analysis 2025
- 24.3.1 Top 5 Companies Market Share Analysis
- 24.3.2 Top 3 Companies Market Share Analysis
- 24.4. List of Potential Customers
- 25. Research Methodology
List of Figures
- Figure 1: Global EV Taxi Industry Revenue Breakdown (billion, %) by Region 2025 & 2033
- Figure 2: United States EV Taxi Industry Revenue (billion), by Type 2025 & 2033
- Figure 3: United States EV Taxi Industry Revenue Share (%), by Type 2025 & 2033
- Figure 4: United States EV Taxi Industry Revenue (billion), by Vehicle Type 2025 & 2033
- Figure 5: United States EV Taxi Industry Revenue Share (%), by Vehicle Type 2025 & 2033
- Figure 6: United States EV Taxi Industry Revenue (billion), by Country 2025 & 2033
- Figure 7: United States EV Taxi Industry Revenue Share (%), by Country 2025 & 2033
- Figure 8: Canada EV Taxi Industry Revenue (billion), by Type 2025 & 2033
- Figure 9: Canada EV Taxi Industry Revenue Share (%), by Type 2025 & 2033
- Figure 10: Canada EV Taxi Industry Revenue (billion), by Vehicle Type 2025 & 2033
- Figure 11: Canada EV Taxi Industry Revenue Share (%), by Vehicle Type 2025 & 2033
- Figure 12: Canada EV Taxi Industry Revenue (billion), by Country 2025 & 2033
- Figure 13: Canada EV Taxi Industry Revenue Share (%), by Country 2025 & 2033
- Figure 14: Rest of North America EV Taxi Industry Revenue (billion), by Type 2025 & 2033
- Figure 15: Rest of North America EV Taxi Industry Revenue Share (%), by Type 2025 & 2033
- Figure 16: Rest of North America EV Taxi Industry Revenue (billion), by Vehicle Type 2025 & 2033
- Figure 17: Rest of North America EV Taxi Industry Revenue Share (%), by Vehicle Type 2025 & 2033
- Figure 18: Rest of North America EV Taxi Industry Revenue (billion), by Country 2025 & 2033
- Figure 19: Rest of North America EV Taxi Industry Revenue Share (%), by Country 2025 & 2033
- Figure 20: Germany EV Taxi Industry Revenue (billion), by Type 2025 & 2033
- Figure 21: Germany EV Taxi Industry Revenue Share (%), by Type 2025 & 2033
- Figure 22: Germany EV Taxi Industry Revenue (billion), by Vehicle Type 2025 & 2033
- Figure 23: Germany EV Taxi Industry Revenue Share (%), by Vehicle Type 2025 & 2033
- Figure 24: Germany EV Taxi Industry Revenue (billion), by Country 2025 & 2033
- Figure 25: Germany EV Taxi Industry Revenue Share (%), by Country 2025 & 2033
- Figure 26: United Kingdom EV Taxi Industry Revenue (billion), by Type 2025 & 2033
- Figure 27: United Kingdom EV Taxi Industry Revenue Share (%), by Type 2025 & 2033
- Figure 28: United Kingdom EV Taxi Industry Revenue (billion), by Vehicle Type 2025 & 2033
- Figure 29: United Kingdom EV Taxi Industry Revenue Share (%), by Vehicle Type 2025 & 2033
- Figure 30: United Kingdom EV Taxi Industry Revenue (billion), by Country 2025 & 2033
- Figure 31: United Kingdom EV Taxi Industry Revenue Share (%), by Country 2025 & 2033
- Figure 32: France EV Taxi Industry Revenue (billion), by Type 2025 & 2033
- Figure 33: France EV Taxi Industry Revenue Share (%), by Type 2025 & 2033
- Figure 34: France EV Taxi Industry Revenue (billion), by Vehicle Type 2025 & 2033
- Figure 35: France EV Taxi Industry Revenue Share (%), by Vehicle Type 2025 & 2033
- Figure 36: France EV Taxi Industry Revenue (billion), by Country 2025 & 2033
- Figure 37: France EV Taxi Industry Revenue Share (%), by Country 2025 & 2033
- Figure 38: Italy EV Taxi Industry Revenue (billion), by Type 2025 & 2033
- Figure 39: Italy EV Taxi Industry Revenue Share (%), by Type 2025 & 2033
- Figure 40: Italy EV Taxi Industry Revenue (billion), by Vehicle Type 2025 & 2033
- Figure 41: Italy EV Taxi Industry Revenue Share (%), by Vehicle Type 2025 & 2033
- Figure 42: Italy EV Taxi Industry Revenue (billion), by Country 2025 & 2033
- Figure 43: Italy EV Taxi Industry Revenue Share (%), by Country 2025 & 2033
- Figure 44: Rest of Europe EV Taxi Industry Revenue (billion), by Type 2025 & 2033
- Figure 45: Rest of Europe EV Taxi Industry Revenue Share (%), by Type 2025 & 2033
- Figure 46: Rest of Europe EV Taxi Industry Revenue (billion), by Vehicle Type 2025 & 2033
- Figure 47: Rest of Europe EV Taxi Industry Revenue Share (%), by Vehicle Type 2025 & 2033
- Figure 48: Rest of Europe EV Taxi Industry Revenue (billion), by Country 2025 & 2033
- Figure 49: Rest of Europe EV Taxi Industry Revenue Share (%), by Country 2025 & 2033
- Figure 50: China EV Taxi Industry Revenue (billion), by Type 2025 & 2033
- Figure 51: China EV Taxi Industry Revenue Share (%), by Type 2025 & 2033
- Figure 52: China EV Taxi Industry Revenue (billion), by Vehicle Type 2025 & 2033
- Figure 53: China EV Taxi Industry Revenue Share (%), by Vehicle Type 2025 & 2033
- Figure 54: China EV Taxi Industry Revenue (billion), by Country 2025 & 2033
- Figure 55: China EV Taxi Industry Revenue Share (%), by Country 2025 & 2033
- Figure 56: India EV Taxi Industry Revenue (billion), by Type 2025 & 2033
- Figure 57: India EV Taxi Industry Revenue Share (%), by Type 2025 & 2033
- Figure 58: India EV Taxi Industry Revenue (billion), by Vehicle Type 2025 & 2033
- Figure 59: India EV Taxi Industry Revenue Share (%), by Vehicle Type 2025 & 2033
- Figure 60: India EV Taxi Industry Revenue (billion), by Country 2025 & 2033
- Figure 61: India EV Taxi Industry Revenue Share (%), by Country 2025 & 2033
- Figure 62: Japan EV Taxi Industry Revenue (billion), by Type 2025 & 2033
- Figure 63: Japan EV Taxi Industry Revenue Share (%), by Type 2025 & 2033
- Figure 64: Japan EV Taxi Industry Revenue (billion), by Vehicle Type 2025 & 2033
- Figure 65: Japan EV Taxi Industry Revenue Share (%), by Vehicle Type 2025 & 2033
- Figure 66: Japan EV Taxi Industry Revenue (billion), by Country 2025 & 2033
- Figure 67: Japan EV Taxi Industry Revenue Share (%), by Country 2025 & 2033
- Figure 68: South Korea EV Taxi Industry Revenue (billion), by Type 2025 & 2033
- Figure 69: South Korea EV Taxi Industry Revenue Share (%), by Type 2025 & 2033
- Figure 70: South Korea EV Taxi Industry Revenue (billion), by Vehicle Type 2025 & 2033
- Figure 71: South Korea EV Taxi Industry Revenue Share (%), by Vehicle Type 2025 & 2033
- Figure 72: South Korea EV Taxi Industry Revenue (billion), by Country 2025 & 2033
- Figure 73: South Korea EV Taxi Industry Revenue Share (%), by Country 2025 & 2033
- Figure 74: Rest of Asia Pacific EV Taxi Industry Revenue (billion), by Type 2025 & 2033
- Figure 75: Rest of Asia Pacific EV Taxi Industry Revenue Share (%), by Type 2025 & 2033
- Figure 76: Rest of Asia Pacific EV Taxi Industry Revenue (billion), by Vehicle Type 2025 & 2033
- Figure 77: Rest of Asia Pacific EV Taxi Industry Revenue Share (%), by Vehicle Type 2025 & 2033
- Figure 78: Rest of Asia Pacific EV Taxi Industry Revenue (billion), by Country 2025 & 2033
- Figure 79: Rest of Asia Pacific EV Taxi Industry Revenue Share (%), by Country 2025 & 2033
- Figure 80: Mexico EV Taxi Industry Revenue (billion), by Type 2025 & 2033
- Figure 81: Mexico EV Taxi Industry Revenue Share (%), by Type 2025 & 2033
- Figure 82: Mexico EV Taxi Industry Revenue (billion), by Vehicle Type 2025 & 2033
- Figure 83: Mexico EV Taxi Industry Revenue Share (%), by Vehicle Type 2025 & 2033
- Figure 84: Mexico EV Taxi Industry Revenue (billion), by Country 2025 & 2033
- Figure 85: Mexico EV Taxi Industry Revenue Share (%), by Country 2025 & 2033
- Figure 86: Brazil EV Taxi Industry Revenue (billion), by Type 2025 & 2033
- Figure 87: Brazil EV Taxi Industry Revenue Share (%), by Type 2025 & 2033
- Figure 88: Brazil EV Taxi Industry Revenue (billion), by Vehicle Type 2025 & 2033
- Figure 89: Brazil EV Taxi Industry Revenue Share (%), by Vehicle Type 2025 & 2033
- Figure 90: Brazil EV Taxi Industry Revenue (billion), by Country 2025 & 2033
- Figure 91: Brazil EV Taxi Industry Revenue Share (%), by Country 2025 & 2033
- Figure 92: United Arab Emirates EV Taxi Industry Revenue (billion), by Type 2025 & 2033
- Figure 93: United Arab Emirates EV Taxi Industry Revenue Share (%), by Type 2025 & 2033
- Figure 94: United Arab Emirates EV Taxi Industry Revenue (billion), by Vehicle Type 2025 & 2033
- Figure 95: United Arab Emirates EV Taxi Industry Revenue Share (%), by Vehicle Type 2025 & 2033
- Figure 96: United Arab Emirates EV Taxi Industry Revenue (billion), by Country 2025 & 2033
- Figure 97: United Arab Emirates EV Taxi Industry Revenue Share (%), by Country 2025 & 2033
- Figure 98: Other Countries EV Taxi Industry Revenue (billion), by Type 2025 & 2033
- Figure 99: Other Countries EV Taxi Industry Revenue Share (%), by Type 2025 & 2033
- Figure 100: Other Countries EV Taxi Industry Revenue (billion), by Vehicle Type 2025 & 2033
- Figure 101: Other Countries EV Taxi Industry Revenue Share (%), by Vehicle Type 2025 & 2033
- Figure 102: Other Countries EV Taxi Industry Revenue (billion), by Country 2025 & 2033
- Figure 103: Other Countries EV Taxi Industry Revenue Share (%), by Country 2025 & 2033
List of Tables
- Table 1: Global EV Taxi Industry Revenue billion Forecast, by Type 2020 & 2033
- Table 2: Global EV Taxi Industry Revenue billion Forecast, by Vehicle Type 2020 & 2033
- Table 3: Global EV Taxi Industry Revenue billion Forecast, by Region 2020 & 2033
- Table 4: Global EV Taxi Industry Revenue billion Forecast, by Type 2020 & 2033
- Table 5: Global EV Taxi Industry Revenue billion Forecast, by Vehicle Type 2020 & 2033
- Table 6: Global EV Taxi Industry Revenue billion Forecast, by Country 2020 & 2033
- Table 7: Global EV Taxi Industry Revenue billion Forecast, by Type 2020 & 2033
- Table 8: Global EV Taxi Industry Revenue billion Forecast, by Vehicle Type 2020 & 2033
- Table 9: Global EV Taxi Industry Revenue billion Forecast, by Country 2020 & 2033
- Table 10: Global EV Taxi Industry Revenue billion Forecast, by Type 2020 & 2033
- Table 11: Global EV Taxi Industry Revenue billion Forecast, by Vehicle Type 2020 & 2033
- Table 12: Global EV Taxi Industry Revenue billion Forecast, by Country 2020 & 2033
- Table 13: Global EV Taxi Industry Revenue billion Forecast, by Type 2020 & 2033
- Table 14: Global EV Taxi Industry Revenue billion Forecast, by Vehicle Type 2020 & 2033
- Table 15: Global EV Taxi Industry Revenue billion Forecast, by Country 2020 & 2033
- Table 16: Global EV Taxi Industry Revenue billion Forecast, by Type 2020 & 2033
- Table 17: Global EV Taxi Industry Revenue billion Forecast, by Vehicle Type 2020 & 2033
- Table 18: Global EV Taxi Industry Revenue billion Forecast, by Country 2020 & 2033
- Table 19: Global EV Taxi Industry Revenue billion Forecast, by Type 2020 & 2033
- Table 20: Global EV Taxi Industry Revenue billion Forecast, by Vehicle Type 2020 & 2033
- Table 21: Global EV Taxi Industry Revenue billion Forecast, by Country 2020 & 2033
- Table 22: Global EV Taxi Industry Revenue billion Forecast, by Type 2020 & 2033
- Table 23: Global EV Taxi Industry Revenue billion Forecast, by Vehicle Type 2020 & 2033
- Table 24: Global EV Taxi Industry Revenue billion Forecast, by Country 2020 & 2033
- Table 25: Global EV Taxi Industry Revenue billion Forecast, by Type 2020 & 2033
- Table 26: Global EV Taxi Industry Revenue billion Forecast, by Vehicle Type 2020 & 2033
- Table 27: Global EV Taxi Industry Revenue billion Forecast, by Country 2020 & 2033
- Table 28: Global EV Taxi Industry Revenue billion Forecast, by Type 2020 & 2033
- Table 29: Global EV Taxi Industry Revenue billion Forecast, by Vehicle Type 2020 & 2033
- Table 30: Global EV Taxi Industry Revenue billion Forecast, by Country 2020 & 2033
- Table 31: Global EV Taxi Industry Revenue billion Forecast, by Type 2020 & 2033
- Table 32: Global EV Taxi Industry Revenue billion Forecast, by Vehicle Type 2020 & 2033
- Table 33: Global EV Taxi Industry Revenue billion Forecast, by Country 2020 & 2033
- Table 34: Global EV Taxi Industry Revenue billion Forecast, by Type 2020 & 2033
- Table 35: Global EV Taxi Industry Revenue billion Forecast, by Vehicle Type 2020 & 2033
- Table 36: Global EV Taxi Industry Revenue billion Forecast, by Country 2020 & 2033
- Table 37: Global EV Taxi Industry Revenue billion Forecast, by Type 2020 & 2033
- Table 38: Global EV Taxi Industry Revenue billion Forecast, by Vehicle Type 2020 & 2033
- Table 39: Global EV Taxi Industry Revenue billion Forecast, by Country 2020 & 2033
- Table 40: Global EV Taxi Industry Revenue billion Forecast, by Type 2020 & 2033
- Table 41: Global EV Taxi Industry Revenue billion Forecast, by Vehicle Type 2020 & 2033
- Table 42: Global EV Taxi Industry Revenue billion Forecast, by Country 2020 & 2033
- Table 43: Global EV Taxi Industry Revenue billion Forecast, by Type 2020 & 2033
- Table 44: Global EV Taxi Industry Revenue billion Forecast, by Vehicle Type 2020 & 2033
- Table 45: Global EV Taxi Industry Revenue billion Forecast, by Country 2020 & 2033
- Table 46: Global EV Taxi Industry Revenue billion Forecast, by Type 2020 & 2033
- Table 47: Global EV Taxi Industry Revenue billion Forecast, by Vehicle Type 2020 & 2033
- Table 48: Global EV Taxi Industry Revenue billion Forecast, by Country 2020 & 2033
- Table 49: Global EV Taxi Industry Revenue billion Forecast, by Type 2020 & 2033
- Table 50: Global EV Taxi Industry Revenue billion Forecast, by Vehicle Type 2020 & 2033
- Table 51: Global EV Taxi Industry Revenue billion Forecast, by Country 2020 & 2033
- Table 52: Global EV Taxi Industry Revenue billion Forecast, by Type 2020 & 2033
- Table 53: Global EV Taxi Industry Revenue billion Forecast, by Vehicle Type 2020 & 2033
- Table 54: Global EV Taxi Industry Revenue billion Forecast, by Country 2020 & 2033
Frequently Asked Questions
1. What is the projected Compound Annual Growth Rate (CAGR) of the EV Taxi Industry?
The projected CAGR is approximately 25.56%.
2. Which companies are prominent players in the EV Taxi Industry?
Key companies in the market include Blu Smart Mobility, Taxi Electric, Say Taxi, Ola Cabs, eee-Taxi, Connexxion, Uber, Prakrit.
3. What are the main segments of the EV Taxi Industry?
The market segments include Type, Vehicle Type.
4. Can you provide details about the market size?
The market size is estimated to be USD 29.54 billion as of 2022.
5. What are some drivers contributing to market growth?
Government Policies to promote electric Vehicles Sales.
6. What are the notable trends driving market growth?
Government Initiatives and Investment is Boosting the Demand.
7. Are there any restraints impacting market growth?
High Cost of Capital Expenditure for Electric Vehicle Infrastructure.
8. Can you provide examples of recent developments in the market?
N/A
9. What pricing options are available for accessing the report?
Pricing options include single-user, multi-user, and enterprise licenses priced at USD 4750, USD 5250, and USD 8750 respectively.
10. Is the market size provided in terms of value or volume?
The market size is provided in terms of value, measured in billion.
11. Are there any specific market keywords associated with the report?
Yes, the market keyword associated with the report is "EV Taxi Industry," which aids in identifying and referencing the specific market segment covered.
12. How do I determine which pricing option suits my needs best?
The pricing options vary based on user requirements and access needs. Individual users may opt for single-user licenses, while businesses requiring broader access may choose multi-user or enterprise licenses for cost-effective access to the report.
13. Are there any additional resources or data provided in the EV Taxi Industry report?
While the report offers comprehensive insights, it's advisable to review the specific contents or supplementary materials provided to ascertain if additional resources or data are available.
14. How can I stay updated on further developments or reports in the EV Taxi Industry?
To stay informed about further developments, trends, and reports in the EV Taxi Industry, consider subscribing to industry newsletters, following relevant companies and organizations, or regularly checking reputable industry news sources and publications.
Methodology
Step 1 - Identification of Relevant Samples Size from Population Database


Step 2 - Approaches for Defining Global Market Size (Value, Volume* & Price*)

Note*: In applicable scenarios
Step 3 - Data Sources
Primary Research
- Web Analytics
- Survey Reports
- Research Institute
- Latest Research Reports
- Opinion Leaders
Secondary Research
- Annual Reports
- White Paper
- Latest Press Release
- Industry Association
- Paid Database
- Investor Presentations

Step 4 - Data Triangulation
Involves using different sources of information in order to increase the validity of a study
These sources are likely to be stakeholders in a program - participants, other researchers, program staff, other community members, and so on.
Then we put all data in single framework & apply various statistical tools to find out the dynamic on the market.
During the analysis stage, feedback from the stakeholder groups would be compared to determine areas of agreement as well as areas of divergence