
Key Insights
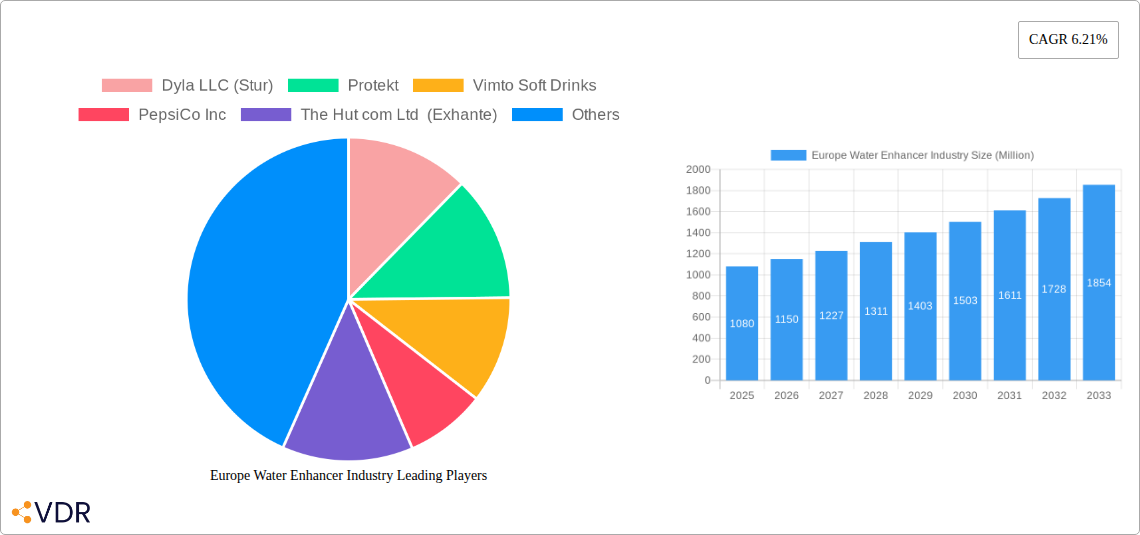
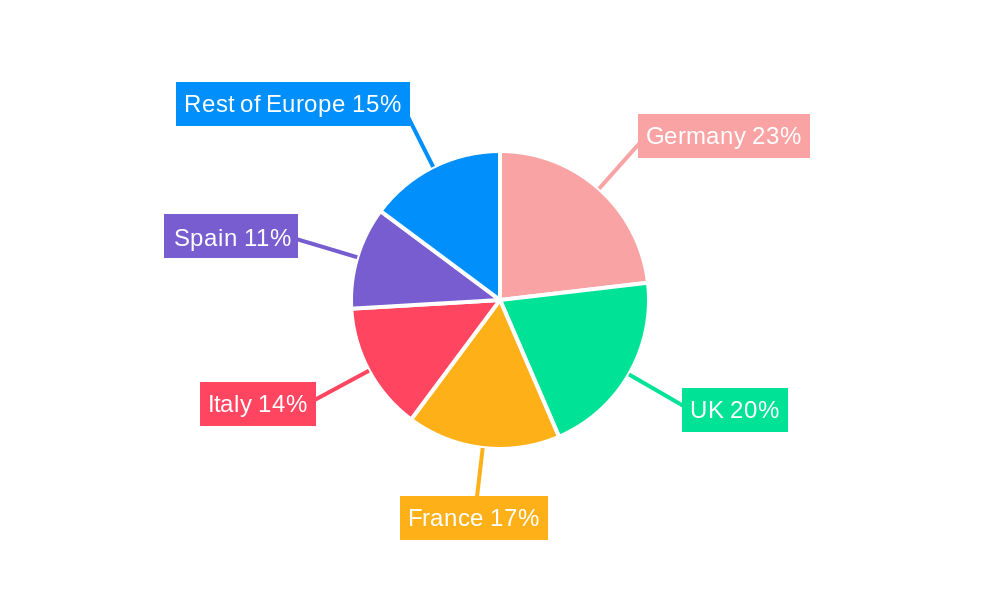
The European water enhancer market, valued at €1.08 billion in 2025, is projected to experience robust growth, driven by increasing health consciousness among consumers and a rising preference for healthier beverage alternatives. The market's Compound Annual Growth Rate (CAGR) of 6.21% from 2025 to 2033 indicates a significant expansion opportunity. Key drivers include the growing popularity of low-sugar and low-calorie options, coupled with the convenience and versatility offered by water enhancers. Consumers are increasingly seeking ways to personalize their drinks, and water enhancers provide a simple and effective method to add flavor and functionality without compromising on health. Market segmentation reveals significant growth across various distribution channels, with supermarkets/hypermarkets holding a major share, followed by online retail stores and convenience stores which are experiencing accelerated growth due to e-commerce expansion and increasing consumer preference for home delivery. Germany, the UK, and France represent the largest national markets within Europe, contributing significantly to the overall market value. While precise market share data for each country is unavailable, it's reasonable to expect Germany and the UK to lead due to their larger populations and established beverage markets. However, other countries in the region, such as Italy and Spain are likely to show stronger than average growth due to increasing adoption of healthier lifestyle choices. The competitive landscape is characterized by a mix of established multinational corporations and smaller, specialized brands. Competition is likely to intensify as more companies enter the market driven by the attractive growth prospects.
The market's growth trajectory is expected to be influenced by several factors. Continued innovation in flavor profiles and the introduction of functional water enhancers, such as those with added vitamins or electrolytes, will drive demand. Furthermore, increasing awareness of the negative health impacts of sugary drinks is expected to fuel the shift towards healthier alternatives. However, potential restraints include fluctuations in raw material prices and the overall economic climate, which can affect consumer spending on non-essential items. Nevertheless, the long-term outlook for the European water enhancer market remains positive, with strong growth potential driven by consumer preference for healthy and convenient beverage options.
This comprehensive report provides an in-depth analysis of the Europe Water Enhancer industry, covering market dynamics, growth trends, competitive landscape, and future outlook. The report examines the parent market (beverage enhancers) and its child market (water flavor enhancers) across key European countries, offering valuable insights for industry professionals, investors, and stakeholders. The study period spans from 2019 to 2033, with a focus on 2025 as the base and estimated year. Market values are presented in millions of units.
Europe Water Enhancer Industry Market Dynamics & Structure
This section analyzes the market's competitive landscape, innovation drivers, regulatory environment, and market trends. The European water enhancer market exhibits a moderately fragmented structure with several key players vying for market share. Market concentration is analyzed using a Herfindahl-Hirschman Index (HHI) calculation in the full report (value: xx).
Market Dynamics:
- Technological Innovation: The industry witnesses continuous innovation in flavor profiles, functional ingredients (vitamins, antioxidants), and convenient packaging formats (single-serve sachets, larger bottles).
- Regulatory Framework: EU regulations regarding food safety, labeling, and health claims significantly influence product development and marketing strategies. Compliance costs and evolving regulations represent a considerable challenge.
- Competitive Substitutes: Other hydration options like ready-to-drink beverages, sports drinks, and naturally flavored waters pose competitive pressure. The market analysis quantifies this competition (xx% market share of substitutes in 2024).
- End-User Demographics: The target consumer base comprises health-conscious individuals, athletes, and those seeking convenient ways to enhance the taste of water without added sugars. The report includes demographic segmentation data (age, income, lifestyle).
- M&A Trends: The number of mergers and acquisitions (M&A) in the sector has been moderate over the past five years, with xx major deals recorded between 2019 and 2024. Consolidation is anticipated to increase (xx predicted deals between 2025-2033) as larger players seek to expand their market reach and product portfolios.
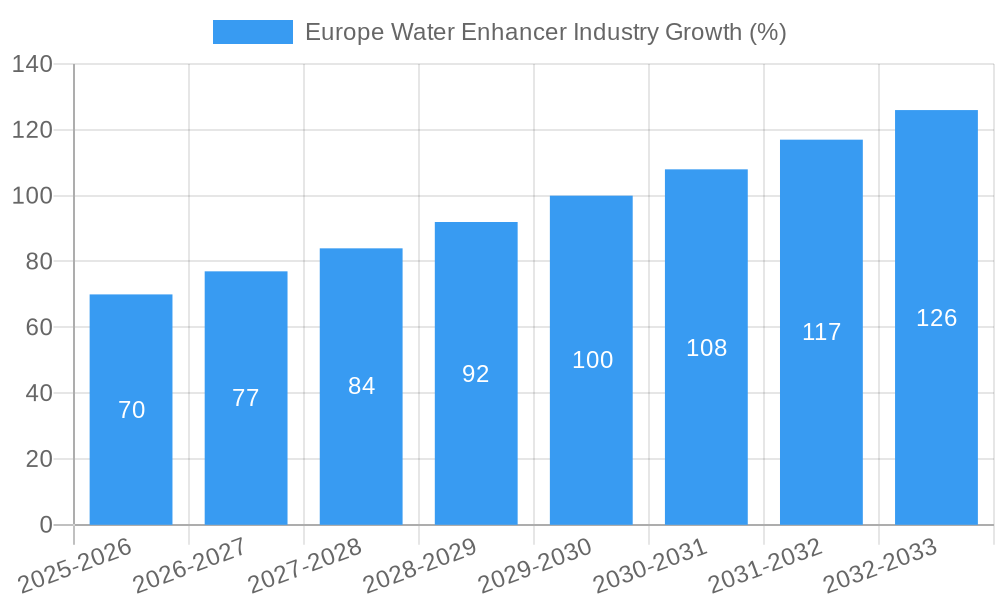
Europe Water Enhancer Industry Growth Trends & Insights
This section analyzes the historical and projected growth of the Europe water enhancer market. The market experienced a CAGR of xx% during the historical period (2019-2024). We project a CAGR of xx% during the forecast period (2025-2033), reaching a market size of xx million units by 2033. Market penetration is currently at xx% and is predicted to reach xx% by 2033. This growth is fueled by increasing health consciousness, a growing preference for healthier alternatives, and the convenience offered by water enhancers. The report delves deeper into consumer preference trends, evolving product categories, and the disruption of traditional beverage habits.
Dominant Regions, Countries, or Segments in Europe Water Enhancer Industry
The United Kingdom and Germany are currently the leading markets for water enhancers in Europe. Supermarkets/Hypermarkets represent the largest distribution channel, driven by high consumer traffic and established distribution networks.
Dominant Factors:
- United Kingdom: Strong consumer adoption of health and wellness products, coupled with a developed retail infrastructure, contributes to the UK's dominance.
- Germany: High per capita consumption of beverages, combined with a focus on functional foods and beverages, fuels market growth in Germany.
- Supermarkets/Hypermarkets: Wide product assortment, established consumer trust, and extensive reach make supermarkets the preferred distribution channel for water enhancers.
Growth Potential:
- Online Retail Stores: The online channel presents significant growth potential, driven by rising e-commerce adoption rates and increased consumer access to diverse products.
- France & Spain: Both countries demonstrate considerable growth potential due to increasing awareness of health benefits and evolving consumer preferences.
Europe Water Enhancer Industry Product Landscape
Water enhancers are available in various formats, including powder sachets, liquid concentrates, and tablets. Recent product innovations focus on natural ingredients, functional benefits (vitamins, minerals, antioxidants), and diverse flavor profiles to cater to specific consumer needs. The industry is witnessing a trend towards sugar-free and low-calorie options to align with growing health concerns.
Key Drivers, Barriers & Challenges in Europe Water Enhancer Industry
Key Drivers:
- Growing health and wellness awareness drives the demand for healthier beverage options.
- Convenience offered by water enhancers is a primary driver of adoption.
- Rising disposable incomes in several European countries boosts consumer spending on premium products.
Key Challenges:
- Intense competition from established beverage companies. Market share competition is fierce, with established brands holding substantial market share.
- The fluctuating prices of raw materials (e.g., natural sweeteners, flavoring agents) impact product pricing and profitability. The report details projected impact (xx% increase in raw material costs by 2028).
- Stringent regulatory requirements regarding food safety and labeling add complexity to product development and compliance.
Emerging Opportunities in Europe Water Enhancer Industry
- Expansion into niche segments like sports nutrition and functional beverages.
- Development of innovative flavors and blends to cater to evolving consumer preferences.
- Growing demand for eco-friendly packaging to attract environmentally conscious consumers.
Growth Accelerators in the Europe Water Enhancer Industry Industry
Technological advancements in flavor delivery systems and functional ingredient integration will accelerate market growth. Strategic partnerships with retailers and distributors will expand market reach, while successful marketing campaigns emphasizing health benefits will drive consumer adoption. Expansion into untapped markets within Europe, targeting specific demographic groups, and introducing new product formats, will play a key role.
Key Players Shaping the Europe Water Enhancer Industry Market
- Dyla LLC (Stur)
- Protekt
- Vimto Soft Drinks
- PepsiCo Inc
- The Hut com Ltd (Exhante)
- The Kraft Heinz Company
- The Coca-Cola Company
- Pure Flavour GmbH
- DreamPak
- Wisdom Natural Brands
Notable Milestones in Europe Water Enhancer Industry Sector
- 2022 (Q1): Robinsons launched new Benefit Drops in four flavors, each with a different functional benefit.
- 2022 (Q3): DreamPak launched Enhanca Hydrate water flavor enhancers in several flavors.
- 2022 (Q4): Protekt launched liquid supplements and beverage enhancers with antioxidants in the UK.
In-Depth Europe Water Enhancer Industry Market Outlook
The Europe water enhancer market is poised for significant growth, driven by continuous product innovation, expanding distribution channels, and increasing consumer demand for healthier beverage options. Strategic partnerships, expansion into emerging markets, and successful marketing campaigns will further accelerate market expansion. The rising consumer awareness of health and wellness trends and the ease of usage will contribute to the industry's growth in the coming years.
Europe Water Enhancer Industry Segmentation
-
1. Distribution Channel
- 1.1. Supermarkets/Hypermarkets
- 1.2. Convenience Stores
- 1.3. Online Retail Stores
- 1.4. Pharmacy & Health Store
- 1.5. Other Distribution Channels
Europe Water Enhancer Industry Segmentation By Geography
-
1. Europe
- 1.1. United Kingdom
- 1.2. Germany
- 1.3. France
- 1.4. Italy
- 1.5. Spain
- 1.6. Netherlands
- 1.7. Belgium
- 1.8. Sweden
- 1.9. Norway
- 1.10. Poland
- 1.11. Denmark
Europe Water Enhancer Industry REPORT HIGHLIGHTS
| Aspects | Details |
|---|---|
| Study Period | 2019-2033 |
| Base Year | 2024 |
| Estimated Year | 2025 |
| Forecast Period | 2025-2033 |
| Historical Period | 2019-2024 |
| Growth Rate | CAGR of 6.21% from 2019-2033 |
| Segmentation |
|
Table of Contents
- 1. Introduction
- 1.1. Research Scope
- 1.2. Market Segmentation
- 1.3. Research Methodology
- 1.4. Definitions and Assumptions
- 2. Executive Summary
- 2.1. Introduction
- 3. Market Dynamics
- 3.1. Introduction
- 3.2. Market Drivers
- 3.2.1. Increasing Sports Participation; Increasing Awareness about Health and Fitness
- 3.3. Market Restrains
- 3.3.1. Adverse Effects of Overconsumption of Products
- 3.4. Market Trends
- 3.4.1. Rising Demand for Non-Carbonated Beverages
- 4. Market Factor Analysis
- 4.1. Porters Five Forces
- 4.2. Supply/Value Chain
- 4.3. PESTEL analysis
- 4.4. Market Entropy
- 4.5. Patent/Trademark Analysis
- 5. Europe Water Enhancer Industry Analysis, Insights and Forecast, 2019-2031
- 5.1. Market Analysis, Insights and Forecast - by Distribution Channel
- 5.1.1. Supermarkets/Hypermarkets
- 5.1.2. Convenience Stores
- 5.1.3. Online Retail Stores
- 5.1.4. Pharmacy & Health Store
- 5.1.5. Other Distribution Channels
- 5.2. Market Analysis, Insights and Forecast - by Region
- 5.2.1. Europe
- 5.1. Market Analysis, Insights and Forecast - by Distribution Channel
- 6. Germany Europe Water Enhancer Industry Analysis, Insights and Forecast, 2019-2031
- 7. France Europe Water Enhancer Industry Analysis, Insights and Forecast, 2019-2031
- 8. Italy Europe Water Enhancer Industry Analysis, Insights and Forecast, 2019-2031
- 9. United Kingdom Europe Water Enhancer Industry Analysis, Insights and Forecast, 2019-2031
- 10. Netherlands Europe Water Enhancer Industry Analysis, Insights and Forecast, 2019-2031
- 11. Sweden Europe Water Enhancer Industry Analysis, Insights and Forecast, 2019-2031
- 12. Rest of Europe Europe Water Enhancer Industry Analysis, Insights and Forecast, 2019-2031
- 13. Competitive Analysis
- 13.1. Market Share Analysis 2024
- 13.2. Company Profiles
- 13.2.1 Dyla LLC (Stur)
- 13.2.1.1. Overview
- 13.2.1.2. Products
- 13.2.1.3. SWOT Analysis
- 13.2.1.4. Recent Developments
- 13.2.1.5. Financials (Based on Availability)
- 13.2.2 Protekt
- 13.2.2.1. Overview
- 13.2.2.2. Products
- 13.2.2.3. SWOT Analysis
- 13.2.2.4. Recent Developments
- 13.2.2.5. Financials (Based on Availability)
- 13.2.3 Vimto Soft Drinks
- 13.2.3.1. Overview
- 13.2.3.2. Products
- 13.2.3.3. SWOT Analysis
- 13.2.3.4. Recent Developments
- 13.2.3.5. Financials (Based on Availability)
- 13.2.4 PepsiCo Inc
- 13.2.4.1. Overview
- 13.2.4.2. Products
- 13.2.4.3. SWOT Analysis
- 13.2.4.4. Recent Developments
- 13.2.4.5. Financials (Based on Availability)
- 13.2.5 The Hut com Ltd (Exhante)
- 13.2.5.1. Overview
- 13.2.5.2. Products
- 13.2.5.3. SWOT Analysis
- 13.2.5.4. Recent Developments
- 13.2.5.5. Financials (Based on Availability)
- 13.2.6 The Kraft Heinz Company
- 13.2.6.1. Overview
- 13.2.6.2. Products
- 13.2.6.3. SWOT Analysis
- 13.2.6.4. Recent Developments
- 13.2.6.5. Financials (Based on Availability)
- 13.2.7 The Coca-Cola Company
- 13.2.7.1. Overview
- 13.2.7.2. Products
- 13.2.7.3. SWOT Analysis
- 13.2.7.4. Recent Developments
- 13.2.7.5. Financials (Based on Availability)
- 13.2.8 Pure Flavour GmbH
- 13.2.8.1. Overview
- 13.2.8.2. Products
- 13.2.8.3. SWOT Analysis
- 13.2.8.4. Recent Developments
- 13.2.8.5. Financials (Based on Availability)
- 13.2.9 DreamPak*List Not Exhaustive
- 13.2.9.1. Overview
- 13.2.9.2. Products
- 13.2.9.3. SWOT Analysis
- 13.2.9.4. Recent Developments
- 13.2.9.5. Financials (Based on Availability)
- 13.2.10 Wisdom Natural Brands
- 13.2.10.1. Overview
- 13.2.10.2. Products
- 13.2.10.3. SWOT Analysis
- 13.2.10.4. Recent Developments
- 13.2.10.5. Financials (Based on Availability)
- 13.2.1 Dyla LLC (Stur)
List of Figures
- Figure 1: Europe Water Enhancer Industry Revenue Breakdown (Million, %) by Product 2024 & 2032
- Figure 2: Europe Water Enhancer Industry Share (%) by Company 2024
List of Tables
- Table 1: Europe Water Enhancer Industry Revenue Million Forecast, by Region 2019 & 2032
- Table 2: Europe Water Enhancer Industry Volume K Litres Forecast, by Region 2019 & 2032
- Table 3: Europe Water Enhancer Industry Revenue Million Forecast, by Distribution Channel 2019 & 2032
- Table 4: Europe Water Enhancer Industry Volume K Litres Forecast, by Distribution Channel 2019 & 2032
- Table 5: Europe Water Enhancer Industry Revenue Million Forecast, by Region 2019 & 2032
- Table 6: Europe Water Enhancer Industry Volume K Litres Forecast, by Region 2019 & 2032
- Table 7: Europe Water Enhancer Industry Revenue Million Forecast, by Country 2019 & 2032
- Table 8: Europe Water Enhancer Industry Volume K Litres Forecast, by Country 2019 & 2032
- Table 9: Germany Europe Water Enhancer Industry Revenue (Million) Forecast, by Application 2019 & 2032
- Table 10: Germany Europe Water Enhancer Industry Volume (K Litres) Forecast, by Application 2019 & 2032
- Table 11: France Europe Water Enhancer Industry Revenue (Million) Forecast, by Application 2019 & 2032
- Table 12: France Europe Water Enhancer Industry Volume (K Litres) Forecast, by Application 2019 & 2032
- Table 13: Italy Europe Water Enhancer Industry Revenue (Million) Forecast, by Application 2019 & 2032
- Table 14: Italy Europe Water Enhancer Industry Volume (K Litres) Forecast, by Application 2019 & 2032
- Table 15: United Kingdom Europe Water Enhancer Industry Revenue (Million) Forecast, by Application 2019 & 2032
- Table 16: United Kingdom Europe Water Enhancer Industry Volume (K Litres) Forecast, by Application 2019 & 2032
- Table 17: Netherlands Europe Water Enhancer Industry Revenue (Million) Forecast, by Application 2019 & 2032
- Table 18: Netherlands Europe Water Enhancer Industry Volume (K Litres) Forecast, by Application 2019 & 2032
- Table 19: Sweden Europe Water Enhancer Industry Revenue (Million) Forecast, by Application 2019 & 2032
- Table 20: Sweden Europe Water Enhancer Industry Volume (K Litres) Forecast, by Application 2019 & 2032
- Table 21: Rest of Europe Europe Water Enhancer Industry Revenue (Million) Forecast, by Application 2019 & 2032
- Table 22: Rest of Europe Europe Water Enhancer Industry Volume (K Litres) Forecast, by Application 2019 & 2032
- Table 23: Europe Water Enhancer Industry Revenue Million Forecast, by Distribution Channel 2019 & 2032
- Table 24: Europe Water Enhancer Industry Volume K Litres Forecast, by Distribution Channel 2019 & 2032
- Table 25: Europe Water Enhancer Industry Revenue Million Forecast, by Country 2019 & 2032
- Table 26: Europe Water Enhancer Industry Volume K Litres Forecast, by Country 2019 & 2032
- Table 27: United Kingdom Europe Water Enhancer Industry Revenue (Million) Forecast, by Application 2019 & 2032
- Table 28: United Kingdom Europe Water Enhancer Industry Volume (K Litres) Forecast, by Application 2019 & 2032
- Table 29: Germany Europe Water Enhancer Industry Revenue (Million) Forecast, by Application 2019 & 2032
- Table 30: Germany Europe Water Enhancer Industry Volume (K Litres) Forecast, by Application 2019 & 2032
- Table 31: France Europe Water Enhancer Industry Revenue (Million) Forecast, by Application 2019 & 2032
- Table 32: France Europe Water Enhancer Industry Volume (K Litres) Forecast, by Application 2019 & 2032
- Table 33: Italy Europe Water Enhancer Industry Revenue (Million) Forecast, by Application 2019 & 2032
- Table 34: Italy Europe Water Enhancer Industry Volume (K Litres) Forecast, by Application 2019 & 2032
- Table 35: Spain Europe Water Enhancer Industry Revenue (Million) Forecast, by Application 2019 & 2032
- Table 36: Spain Europe Water Enhancer Industry Volume (K Litres) Forecast, by Application 2019 & 2032
- Table 37: Netherlands Europe Water Enhancer Industry Revenue (Million) Forecast, by Application 2019 & 2032
- Table 38: Netherlands Europe Water Enhancer Industry Volume (K Litres) Forecast, by Application 2019 & 2032
- Table 39: Belgium Europe Water Enhancer Industry Revenue (Million) Forecast, by Application 2019 & 2032
- Table 40: Belgium Europe Water Enhancer Industry Volume (K Litres) Forecast, by Application 2019 & 2032
- Table 41: Sweden Europe Water Enhancer Industry Revenue (Million) Forecast, by Application 2019 & 2032
- Table 42: Sweden Europe Water Enhancer Industry Volume (K Litres) Forecast, by Application 2019 & 2032
- Table 43: Norway Europe Water Enhancer Industry Revenue (Million) Forecast, by Application 2019 & 2032
- Table 44: Norway Europe Water Enhancer Industry Volume (K Litres) Forecast, by Application 2019 & 2032
- Table 45: Poland Europe Water Enhancer Industry Revenue (Million) Forecast, by Application 2019 & 2032
- Table 46: Poland Europe Water Enhancer Industry Volume (K Litres) Forecast, by Application 2019 & 2032
- Table 47: Denmark Europe Water Enhancer Industry Revenue (Million) Forecast, by Application 2019 & 2032
- Table 48: Denmark Europe Water Enhancer Industry Volume (K Litres) Forecast, by Application 2019 & 2032
Frequently Asked Questions
1. What is the projected Compound Annual Growth Rate (CAGR) of the Europe Water Enhancer Industry?
The projected CAGR is approximately 6.21%.
2. Which companies are prominent players in the Europe Water Enhancer Industry?
Key companies in the market include Dyla LLC (Stur), Protekt, Vimto Soft Drinks, PepsiCo Inc, The Hut com Ltd (Exhante), The Kraft Heinz Company, The Coca-Cola Company, Pure Flavour GmbH, DreamPak*List Not Exhaustive, Wisdom Natural Brands.
3. What are the main segments of the Europe Water Enhancer Industry?
The market segments include Distribution Channel.
4. Can you provide details about the market size?
The market size is estimated to be USD 1.08 Million as of 2022.
5. What are some drivers contributing to market growth?
Increasing Sports Participation; Increasing Awareness about Health and Fitness.
6. What are the notable trends driving market growth?
Rising Demand for Non-Carbonated Beverages.
7. Are there any restraints impacting market growth?
Adverse Effects of Overconsumption of Products.
8. Can you provide examples of recent developments in the market?
In 2022, Robinsons launched new Benefit Drops in four flavors. Each with a different added functional benefit, the Britvic-owned range offers shoppers a convenient and tasty way to gain additional vitamins while on the move. It helps consumers make tastier, healthier choices in line with Britvic’s long-term Healthier People strategy.
9. What pricing options are available for accessing the report?
Pricing options include single-user, multi-user, and enterprise licenses priced at USD 4750, USD 5250, and USD 8750 respectively.
10. Is the market size provided in terms of value or volume?
The market size is provided in terms of value, measured in Million and volume, measured in K Litres.
11. Are there any specific market keywords associated with the report?
Yes, the market keyword associated with the report is "Europe Water Enhancer Industry," which aids in identifying and referencing the specific market segment covered.
12. How do I determine which pricing option suits my needs best?
The pricing options vary based on user requirements and access needs. Individual users may opt for single-user licenses, while businesses requiring broader access may choose multi-user or enterprise licenses for cost-effective access to the report.
13. Are there any additional resources or data provided in the Europe Water Enhancer Industry report?
While the report offers comprehensive insights, it's advisable to review the specific contents or supplementary materials provided to ascertain if additional resources or data are available.
14. How can I stay updated on further developments or reports in the Europe Water Enhancer Industry?
To stay informed about further developments, trends, and reports in the Europe Water Enhancer Industry, consider subscribing to industry newsletters, following relevant companies and organizations, or regularly checking reputable industry news sources and publications.
Methodology
Step 1 - Identification of Relevant Samples Size from Population Database


Step 2 - Approaches for Defining Global Market Size (Value, Volume* & Price*)

Note*: In applicable scenarios
Step 3 - Data Sources
Primary Research
- Web Analytics
- Survey Reports
- Research Institute
- Latest Research Reports
- Opinion Leaders
Secondary Research
- Annual Reports
- White Paper
- Latest Press Release
- Industry Association
- Paid Database
- Investor Presentations

Step 4 - Data Triangulation
Involves using different sources of information in order to increase the validity of a study
These sources are likely to be stakeholders in a program - participants, other researchers, program staff, other community members, and so on.
Then we put all data in single framework & apply various statistical tools to find out the dynamic on the market.
During the analysis stage, feedback from the stakeholder groups would be compared to determine areas of agreement as well as areas of divergence


