

Key Insights
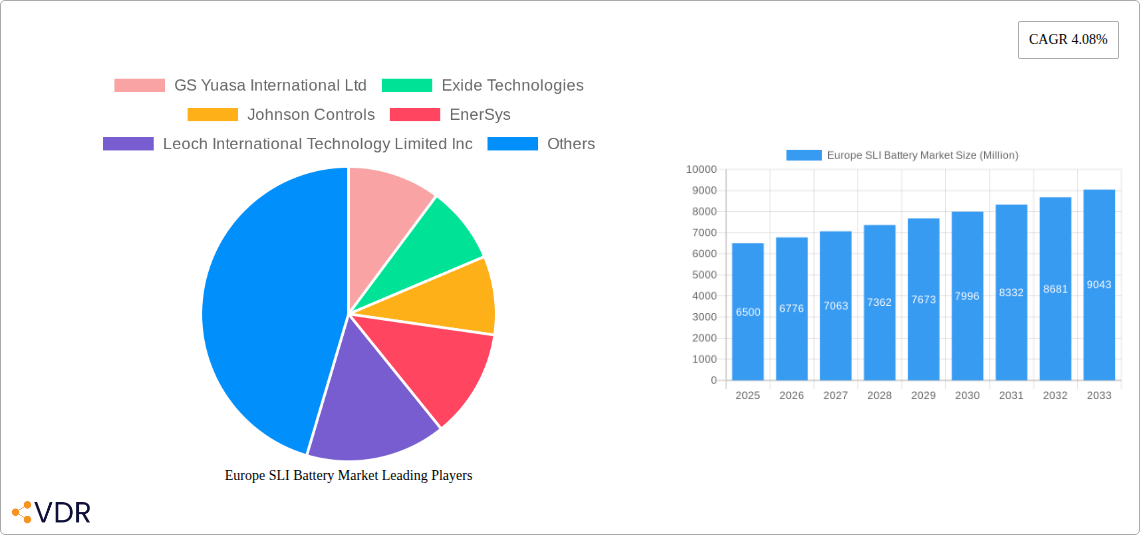
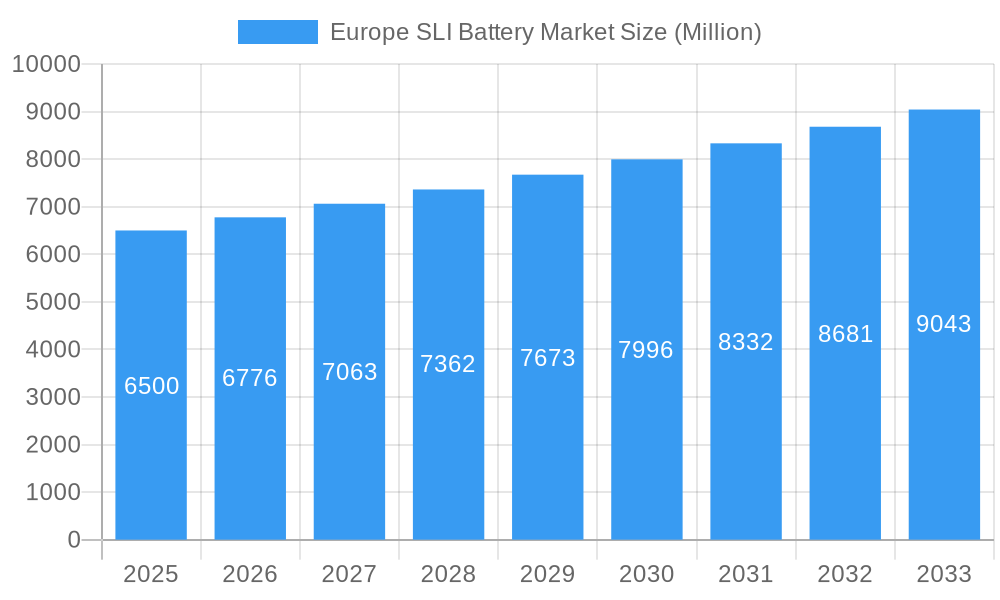
The Europe SLI (Starting, Lighting, and Ignition) battery market, valued at €6.5 billion in 2025, is projected to experience robust growth, driven by the burgeoning automotive sector and increasing demand for electric vehicles (EVs) and hybrid electric vehicles (HEVs). The market's Compound Annual Growth Rate (CAGR) of 4.08% from 2025 to 2033 indicates a steady expansion, fueled by technological advancements leading to longer lifespan batteries and improved performance. Stringent environmental regulations promoting fuel efficiency and reduced emissions are further propelling market growth. However, challenges like fluctuating raw material prices, particularly lead and other metals, and growing competition from alternative energy storage solutions, including lithium-ion batteries, could pose restraints. The market segmentation likely includes passenger vehicles, commercial vehicles, and motorcycles, with a varied distribution across different battery chemistries (lead-acid dominating currently, but with increasing adoption of advanced lead-acid and niche applications for other chemistries). Key players like GS Yuasa, Exide Technologies, and Johnson Controls are fiercely competing, focusing on innovation, product diversification, and strategic partnerships to maintain market share. The growth will likely be uneven across different European regions, with larger economies and higher vehicle ownership potentially exhibiting stronger growth rates.
Europe SLI Battery Market Market Size (In Billion)
The forecast period of 2025-2033 will see significant shifts in the market landscape. The increasing penetration of EVs and HEVs will drive demand for higher-capacity batteries and potentially lead to changes in battery design and manufacturing processes. Furthermore, the growing adoption of start-stop technologies and enhanced vehicle electrification features will create further demand. Companies are likely investing in research and development to improve battery life, performance, and sustainability, incorporating recycling initiatives and environmentally friendly production methods. This will lead to increased market consolidation as companies seek to gain a competitive advantage through economies of scale and technological leadership. Regional variations will likely persist due to differences in vehicle ownership, government policies, and economic conditions across the European Union. Continuous monitoring of evolving consumer preferences and technological innovations will be critical for companies to thrive in this dynamic market.
Europe SLI Battery Market Company Market Share
Europe SLI Battery Market: A Comprehensive Report (2019-2033)
This in-depth report provides a comprehensive analysis of the Europe SLI (Starting, Lighting, and Ignition) Battery market, encompassing market dynamics, growth trends, competitive landscape, and future outlook. The study period covers 2019-2033, with 2025 as the base year and estimated year. This report is crucial for industry professionals, investors, and strategists seeking a detailed understanding of this vital sector. The report analyzes the parent market of automotive batteries and the child market of SLI batteries within the European landscape.
Europe SLI Battery Market Market Dynamics & Structure
This section delves into the intricate dynamics shaping the European SLI battery market. We analyze market concentration, revealing the market share held by key players such as GS Yuasa International Ltd, Exide Technologies, Johnson Controls, EnerSys, Leoch International Technology Limited Inc, East Penn Manufacturing Company, C&D Technologies Inc, Clarios International Inc, Trojan Battery Company, and Crown Battery Manufacturing Company (and other prominent companies). Further analysis explores the impact of technological innovation—particularly in VRLA (Valve-Regulated Lead-Acid) battery technology—on market competitiveness. The report also examines regulatory frameworks, including the EU's Regulation (EU) 2023/1542, which significantly influences production, sustainability, and waste management practices. Finally, we assess the influence of competitive product substitutes, end-user demographics, and recent mergers and acquisitions (M&A) activities, providing quantitative data on market share percentages and M&A deal volumes (xx Million units).
- Market Concentration: xx% dominated by top 5 players.
- Technological Innovation: Focus on VRLA (Gel Cell and AGM) advancements.
- Regulatory Landscape: Impact of EU Regulation (EU) 2023/1542 on sustainability and safety standards.
- Competitive Substitutes: Analysis of alternative technologies and their market penetration.
- M&A Activity: xx M&A deals in the past 5 years, impacting market consolidation.
Europe SLI Battery Market Growth Trends & Insights
This section provides a detailed analysis of the Europe SLI battery market's growth trajectory using historical data (2019-2024) and projections (2025-2033). We examine market size evolution, quantifying growth in Million units and calculating the Compound Annual Growth Rate (CAGR). The report explores adoption rates across various end-user segments and dissects the influence of technological disruptions, including the emergence of advanced VRLA technologies and the impact of the EU's battery regulation. Furthermore, we analyze shifts in consumer behavior, such as increasing demand for eco-friendly batteries and the preference for longer-lasting, higher-performance products. The analysis incorporates both qualitative and quantitative data to provide a comprehensive understanding of market trends. (approx. 600 words of detailed analysis).
- Market Size (Million units): 2019: xx, 2024: xx, 2025: xx (Estimated), 2033: xx (Projected)
- CAGR (2025-2033): xx%
- Market Penetration: xx% in key segments (e.g., automotive).
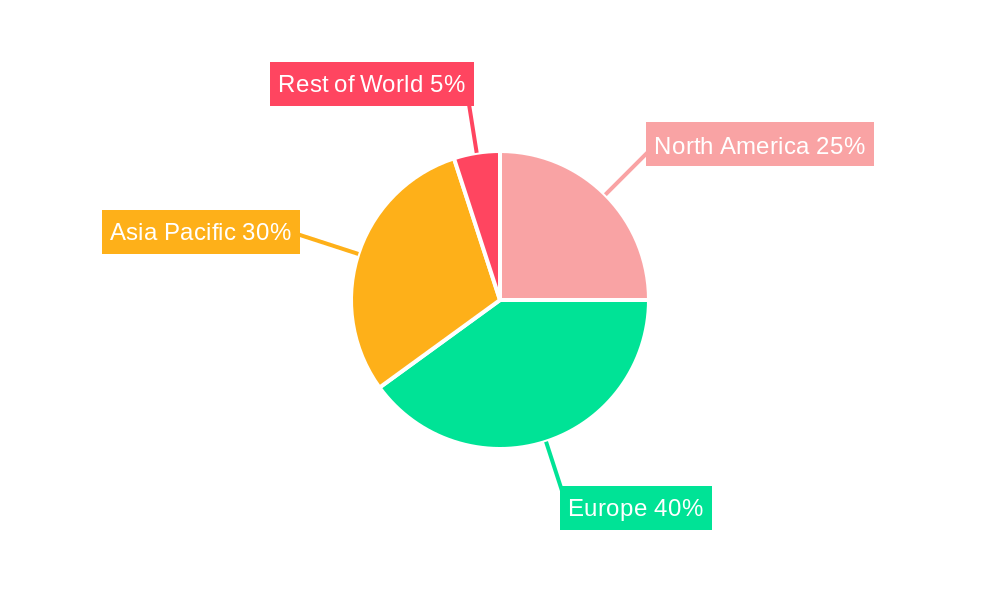
Dominant Regions, Countries, or Segments in Europe SLI Battery Market
This section identifies the leading regions, countries, and segments driving the growth of the European SLI battery market. We provide a detailed analysis (approx. 600 words) of the factors contributing to their dominance, including market share, growth potential, and key drivers. These drivers will be broken down using bullet points and analyzed within paragraphs.
- Leading Region: [Region Name], due to [specific reasons].
- Key Country Drivers: [Country Name] - [specific factors], [Country Name] - [specific factors].
- Dominant Segment: [Segment Name], fueled by [market dynamics].
- Economic Policies: Influence of government incentives and regulations on market growth.
- Infrastructure Development: The role of expanding automotive and industrial sectors.
Europe SLI Battery Market Product Landscape
The European SLI battery market offers a diverse range of products, with innovations focused on improving performance, lifespan, and environmental impact. This section (100-150 words) provides a concise overview of leading product types, highlighting key features such as improved energy density, enhanced safety features, and advancements in VRLA technologies like AGM and gel cell batteries. Unique selling propositions and technological breakthroughs are also emphasized.
Key Drivers, Barriers & Challenges in Europe SLI Battery Market
This section (approx. 300 words) identifies and analyzes the key drivers and challenges impacting the European SLI battery market. Drivers include increasing vehicle production, the growth of renewable energy storage, and technological advancements. Challenges encompass supply chain disruptions, environmental regulations (e.g., the impact of the EU's battery regulation on manufacturing costs), and intense competition. Quantifiable impacts of these challenges are discussed.
- Key Drivers: Technological advancements, growing automotive sector, renewable energy integration.
- Key Challenges: Supply chain vulnerabilities, stringent environmental regulations, competitive pressures.
Emerging Opportunities in Europe SLI Battery Market
This section (150 words) highlights emerging opportunities within the European SLI battery market. These may include untapped market segments, innovative applications of SLI batteries in niche sectors, or shifting consumer preferences toward sustainable and high-performance products.
Growth Accelerators in the Europe SLI Battery Market Industry
This section (150 words) discusses factors that will drive long-term growth within the European SLI battery market. These include technological breakthroughs, strategic partnerships, and expansions into new geographic markets or applications.
Key Players Shaping the Europe SLI Battery Market Market
This section lists key players and their market share (if available), offering links to company websites wherever possible.
- GS Yuasa International Ltd
- Exide Technologies
- Johnson Controls
- EnerSys
- Leoch International Technology Limited Inc
- East Penn Manufacturing Company
- C&D Technologies Inc
- Clarios International Inc
- Trojan Battery Company
- Crown Battery Manufacturing Company
- List Not Exhaustive
Notable Milestones in Europe SLI Battery Market Sector
- June 2023: EU introduces Regulation (EU) 2023/1542 on batteries and waste management, significantly impacting the industry's sustainability practices.
- February 2024: Euro Energy Resources Limited unveils breakthroughs in VRLA batteries, potentially disrupting the market with advanced gel cell and AGM technologies.
In-Depth Europe SLI Battery Market Market Outlook
This section (150 words) summarizes the key growth accelerators identified throughout the report and offers a concise outlook on the future potential and strategic opportunities within the European SLI battery market. The long-term growth prospects are highlighted, emphasizing the market's potential for innovation and expansion.
Europe SLI Battery Market Segmentation
-
1. Type
- 1.1. Flooded Battery
- 1.2. VRLA Battery
- 1.3. EBF Battery
-
2. End-User
- 2.1. Automotive
- 2.2. Others
Europe SLI Battery Market Segmentation By Geography
- 1. Germany
- 2. France
- 3. United Kingdom
- 4. Italy
- 5. Spain
- 6. NORDIC
- 7. Russia
- 8. Turkey
- 9. Rest of Europe
Europe SLI Battery Market Regional Market Share
Geographic Coverage of Europe SLI Battery Market
Europe SLI Battery Market REPORT HIGHLIGHTS
| Aspects | Details |
|---|---|
| Study Period | 2020-2034 |
| Base Year | 2025 |
| Estimated Year | 2026 |
| Forecast Period | 2026-2034 |
| Historical Period | 2020-2025 |
| Growth Rate | CAGR of 4.08% from 2020-2034 |
| Segmentation |
|
Table of Contents
- 1. Introduction
- 1.1. Research Scope
- 1.2. Market Segmentation
- 1.3. Research Objective
- 1.4. Definitions and Assumptions
- 2. Executive Summary
- 2.1. Market Snapshot
- 3. Market Dynamics
- 3.1. Market Drivers
- 3.2. Market Restrains
- 3.3. Market Trends
- 3.4. Market Opportunities
- 4. Market Factor Analysis
- 4.1. Porters Five Forces
- 4.1.1. Bargaining Power of Suppliers
- 4.1.2. Bargaining Power of Buyers
- 4.1.3. Threat of New Entrants
- 4.1.4. Threat of Substitutes
- 4.1.5. Competitive Rivalry
- 4.2. PESTEL analysis
- 4.3. BCG Analysis
- 4.3.1. Stars (High Growth, High Market Share)
- 4.3.2. Cash Cows (Low Growth, High Market Share)
- 4.3.3. Question Mark (High Growth, Low Market Share)
- 4.3.4. Dogs (Low Growth, Low Market Share)
- 4.4. Ansoff Matrix Analysis
- 4.5. Supply Chain Analysis
- 4.6. Regulatory Landscape
- 4.7. Current Market Potential and Opportunity Assessment (TAM–SAM–SOM Framework)
- 4.8. VDR Analyst Note
- 4.1. Porters Five Forces
- 5. Market Analysis, Insights and Forecast 2021-2033
- 5.1. Market Analysis, Insights and Forecast - by Type
- 5.1.1. Flooded Battery
- 5.1.2. VRLA Battery
- 5.1.3. EBF Battery
- 5.2. Market Analysis, Insights and Forecast - by End-User
- 5.2.1. Automotive
- 5.2.2. Others
- 5.3. Market Analysis, Insights and Forecast - by Region
- 5.3.1. Germany
- 5.3.2. France
- 5.3.3. United Kingdom
- 5.3.4. Italy
- 5.3.5. Spain
- 5.3.6. NORDIC
- 5.3.7. Russia
- 5.3.8. Turkey
- 5.3.9. Rest of Europe
- 5.1. Market Analysis, Insights and Forecast - by Type
- 6. Global Europe SLI Battery Market Analysis, Insights and Forecast, 2021-2033
- 6.1. Market Analysis, Insights and Forecast - by Type
- 6.1.1. Flooded Battery
- 6.1.2. VRLA Battery
- 6.1.3. EBF Battery
- 6.2. Market Analysis, Insights and Forecast - by End-User
- 6.2.1. Automotive
- 6.2.2. Others
- 6.1. Market Analysis, Insights and Forecast - by Type
- 7. Germany Europe SLI Battery Market Analysis, Insights and Forecast, 2021-2033
- 7.1. Market Analysis, Insights and Forecast - by Type
- 7.1.1. Flooded Battery
- 7.1.2. VRLA Battery
- 7.1.3. EBF Battery
- 7.2. Market Analysis, Insights and Forecast - by End-User
- 7.2.1. Automotive
- 7.2.2. Others
- 7.1. Market Analysis, Insights and Forecast - by Type
- 8. France Europe SLI Battery Market Analysis, Insights and Forecast, 2021-2033
- 8.1. Market Analysis, Insights and Forecast - by Type
- 8.1.1. Flooded Battery
- 8.1.2. VRLA Battery
- 8.1.3. EBF Battery
- 8.2. Market Analysis, Insights and Forecast - by End-User
- 8.2.1. Automotive
- 8.2.2. Others
- 8.1. Market Analysis, Insights and Forecast - by Type
- 9. United Kingdom Europe SLI Battery Market Analysis, Insights and Forecast, 2021-2033
- 9.1. Market Analysis, Insights and Forecast - by Type
- 9.1.1. Flooded Battery
- 9.1.2. VRLA Battery
- 9.1.3. EBF Battery
- 9.2. Market Analysis, Insights and Forecast - by End-User
- 9.2.1. Automotive
- 9.2.2. Others
- 9.1. Market Analysis, Insights and Forecast - by Type
- 10. Italy Europe SLI Battery Market Analysis, Insights and Forecast, 2021-2033
- 10.1. Market Analysis, Insights and Forecast - by Type
- 10.1.1. Flooded Battery
- 10.1.2. VRLA Battery
- 10.1.3. EBF Battery
- 10.2. Market Analysis, Insights and Forecast - by End-User
- 10.2.1. Automotive
- 10.2.2. Others
- 10.1. Market Analysis, Insights and Forecast - by Type
- 11. Spain Europe SLI Battery Market Analysis, Insights and Forecast, 2021-2033
- 11.1. Market Analysis, Insights and Forecast - by Type
- 11.1.1. Flooded Battery
- 11.1.2. VRLA Battery
- 11.1.3. EBF Battery
- 11.2. Market Analysis, Insights and Forecast - by End-User
- 11.2.1. Automotive
- 11.2.2. Others
- 11.1. Market Analysis, Insights and Forecast - by Type
- 12. NORDIC Europe SLI Battery Market Analysis, Insights and Forecast, 2021-2033
- 12.1. Market Analysis, Insights and Forecast - by Type
- 12.1.1. Flooded Battery
- 12.1.2. VRLA Battery
- 12.1.3. EBF Battery
- 12.2. Market Analysis, Insights and Forecast - by End-User
- 12.2.1. Automotive
- 12.2.2. Others
- 12.1. Market Analysis, Insights and Forecast - by Type
- 13. Russia Europe SLI Battery Market Analysis, Insights and Forecast, 2021-2033
- 13.1. Market Analysis, Insights and Forecast - by Type
- 13.1.1. Flooded Battery
- 13.1.2. VRLA Battery
- 13.1.3. EBF Battery
- 13.2. Market Analysis, Insights and Forecast - by End-User
- 13.2.1. Automotive
- 13.2.2. Others
- 13.1. Market Analysis, Insights and Forecast - by Type
- 14. Turkey Europe SLI Battery Market Analysis, Insights and Forecast, 2021-2033
- 14.1. Market Analysis, Insights and Forecast - by Type
- 14.1.1. Flooded Battery
- 14.1.2. VRLA Battery
- 14.1.3. EBF Battery
- 14.2. Market Analysis, Insights and Forecast - by End-User
- 14.2.1. Automotive
- 14.2.2. Others
- 14.1. Market Analysis, Insights and Forecast - by Type
- 15. Rest of Europe Europe SLI Battery Market Analysis, Insights and Forecast, 2021-2033
- 15.1. Market Analysis, Insights and Forecast - by Type
- 15.1.1. Flooded Battery
- 15.1.2. VRLA Battery
- 15.1.3. EBF Battery
- 15.2. Market Analysis, Insights and Forecast - by End-User
- 15.2.1. Automotive
- 15.2.2. Others
- 15.1. Market Analysis, Insights and Forecast - by Type
- 16. Competitive Analysis
- 16.1. Company Profiles
- 16.1.1 GS Yuasa International Ltd
- 16.1.1.1. Company Overview
- 16.1.1.2. Products
- 16.1.1.3. Company Financials
- 16.1.1.4. SWOT Analysis
- 16.1.2 Exide Technologies
- 16.1.2.1. Company Overview
- 16.1.2.2. Products
- 16.1.2.3. Company Financials
- 16.1.2.4. SWOT Analysis
- 16.1.3 Johnson Controls
- 16.1.3.1. Company Overview
- 16.1.3.2. Products
- 16.1.3.3. Company Financials
- 16.1.3.4. SWOT Analysis
- 16.1.4 EnerSys
- 16.1.4.1. Company Overview
- 16.1.4.2. Products
- 16.1.4.3. Company Financials
- 16.1.4.4. SWOT Analysis
- 16.1.5 Leoch International Technology Limited Inc
- 16.1.5.1. Company Overview
- 16.1.5.2. Products
- 16.1.5.3. Company Financials
- 16.1.5.4. SWOT Analysis
- 16.1.6 East Penn Manufacturing Company
- 16.1.6.1. Company Overview
- 16.1.6.2. Products
- 16.1.6.3. Company Financials
- 16.1.6.4. SWOT Analysis
- 16.1.7 C&D Technologies Inc
- 16.1.7.1. Company Overview
- 16.1.7.2. Products
- 16.1.7.3. Company Financials
- 16.1.7.4. SWOT Analysis
- 16.1.8 Clarios International Inc
- 16.1.8.1. Company Overview
- 16.1.8.2. Products
- 16.1.8.3. Company Financials
- 16.1.8.4. SWOT Analysis
- 16.1.9 Trojan Battery Company
- 16.1.9.1. Company Overview
- 16.1.9.2. Products
- 16.1.9.3. Company Financials
- 16.1.9.4. SWOT Analysis
- 16.1.10 Crown Battery Manufacturing Company*List Not Exhaustive 6 4 List of Other Prominent Companies6 5 Market Ranking/Share (%) Analysi
- 16.1.10.1. Company Overview
- 16.1.10.2. Products
- 16.1.10.3. Company Financials
- 16.1.10.4. SWOT Analysis
- 16.1.1 GS Yuasa International Ltd
- 16.2. Market Entropy
- 16.2.1 Company's Key Areas Served
- 16.2.2 Recent Developments
- 16.3. Company Market Share Analysis 2025
- 16.3.1 Top 5 Companies Market Share Analysis
- 16.3.2 Top 3 Companies Market Share Analysis
- 16.4. List of Potential Customers
- 17. Research Methodology
List of Figures
- Figure 1: Global Europe SLI Battery Market Revenue Breakdown (Million, %) by Region 2025 & 2033
- Figure 2: Global Europe SLI Battery Market Volume Breakdown (Billion, %) by Region 2025 & 2033
- Figure 3: Germany Europe SLI Battery Market Revenue (Million), by Type 2025 & 2033
- Figure 4: Germany Europe SLI Battery Market Volume (Billion), by Type 2025 & 2033
- Figure 5: Germany Europe SLI Battery Market Revenue Share (%), by Type 2025 & 2033
- Figure 6: Germany Europe SLI Battery Market Volume Share (%), by Type 2025 & 2033
- Figure 7: Germany Europe SLI Battery Market Revenue (Million), by End-User 2025 & 2033
- Figure 8: Germany Europe SLI Battery Market Volume (Billion), by End-User 2025 & 2033
- Figure 9: Germany Europe SLI Battery Market Revenue Share (%), by End-User 2025 & 2033
- Figure 10: Germany Europe SLI Battery Market Volume Share (%), by End-User 2025 & 2033
- Figure 11: Germany Europe SLI Battery Market Revenue (Million), by Country 2025 & 2033
- Figure 12: Germany Europe SLI Battery Market Volume (Billion), by Country 2025 & 2033
- Figure 13: Germany Europe SLI Battery Market Revenue Share (%), by Country 2025 & 2033
- Figure 14: Germany Europe SLI Battery Market Volume Share (%), by Country 2025 & 2033
- Figure 15: France Europe SLI Battery Market Revenue (Million), by Type 2025 & 2033
- Figure 16: France Europe SLI Battery Market Volume (Billion), by Type 2025 & 2033
- Figure 17: France Europe SLI Battery Market Revenue Share (%), by Type 2025 & 2033
- Figure 18: France Europe SLI Battery Market Volume Share (%), by Type 2025 & 2033
- Figure 19: France Europe SLI Battery Market Revenue (Million), by End-User 2025 & 2033
- Figure 20: France Europe SLI Battery Market Volume (Billion), by End-User 2025 & 2033
- Figure 21: France Europe SLI Battery Market Revenue Share (%), by End-User 2025 & 2033
- Figure 22: France Europe SLI Battery Market Volume Share (%), by End-User 2025 & 2033
- Figure 23: France Europe SLI Battery Market Revenue (Million), by Country 2025 & 2033
- Figure 24: France Europe SLI Battery Market Volume (Billion), by Country 2025 & 2033
- Figure 25: France Europe SLI Battery Market Revenue Share (%), by Country 2025 & 2033
- Figure 26: France Europe SLI Battery Market Volume Share (%), by Country 2025 & 2033
- Figure 27: United Kingdom Europe SLI Battery Market Revenue (Million), by Type 2025 & 2033
- Figure 28: United Kingdom Europe SLI Battery Market Volume (Billion), by Type 2025 & 2033
- Figure 29: United Kingdom Europe SLI Battery Market Revenue Share (%), by Type 2025 & 2033
- Figure 30: United Kingdom Europe SLI Battery Market Volume Share (%), by Type 2025 & 2033
- Figure 31: United Kingdom Europe SLI Battery Market Revenue (Million), by End-User 2025 & 2033
- Figure 32: United Kingdom Europe SLI Battery Market Volume (Billion), by End-User 2025 & 2033
- Figure 33: United Kingdom Europe SLI Battery Market Revenue Share (%), by End-User 2025 & 2033
- Figure 34: United Kingdom Europe SLI Battery Market Volume Share (%), by End-User 2025 & 2033
- Figure 35: United Kingdom Europe SLI Battery Market Revenue (Million), by Country 2025 & 2033
- Figure 36: United Kingdom Europe SLI Battery Market Volume (Billion), by Country 2025 & 2033
- Figure 37: United Kingdom Europe SLI Battery Market Revenue Share (%), by Country 2025 & 2033
- Figure 38: United Kingdom Europe SLI Battery Market Volume Share (%), by Country 2025 & 2033
- Figure 39: Italy Europe SLI Battery Market Revenue (Million), by Type 2025 & 2033
- Figure 40: Italy Europe SLI Battery Market Volume (Billion), by Type 2025 & 2033
- Figure 41: Italy Europe SLI Battery Market Revenue Share (%), by Type 2025 & 2033
- Figure 42: Italy Europe SLI Battery Market Volume Share (%), by Type 2025 & 2033
- Figure 43: Italy Europe SLI Battery Market Revenue (Million), by End-User 2025 & 2033
- Figure 44: Italy Europe SLI Battery Market Volume (Billion), by End-User 2025 & 2033
- Figure 45: Italy Europe SLI Battery Market Revenue Share (%), by End-User 2025 & 2033
- Figure 46: Italy Europe SLI Battery Market Volume Share (%), by End-User 2025 & 2033
- Figure 47: Italy Europe SLI Battery Market Revenue (Million), by Country 2025 & 2033
- Figure 48: Italy Europe SLI Battery Market Volume (Billion), by Country 2025 & 2033
- Figure 49: Italy Europe SLI Battery Market Revenue Share (%), by Country 2025 & 2033
- Figure 50: Italy Europe SLI Battery Market Volume Share (%), by Country 2025 & 2033
- Figure 51: Spain Europe SLI Battery Market Revenue (Million), by Type 2025 & 2033
- Figure 52: Spain Europe SLI Battery Market Volume (Billion), by Type 2025 & 2033
- Figure 53: Spain Europe SLI Battery Market Revenue Share (%), by Type 2025 & 2033
- Figure 54: Spain Europe SLI Battery Market Volume Share (%), by Type 2025 & 2033
- Figure 55: Spain Europe SLI Battery Market Revenue (Million), by End-User 2025 & 2033
- Figure 56: Spain Europe SLI Battery Market Volume (Billion), by End-User 2025 & 2033
- Figure 57: Spain Europe SLI Battery Market Revenue Share (%), by End-User 2025 & 2033
- Figure 58: Spain Europe SLI Battery Market Volume Share (%), by End-User 2025 & 2033
- Figure 59: Spain Europe SLI Battery Market Revenue (Million), by Country 2025 & 2033
- Figure 60: Spain Europe SLI Battery Market Volume (Billion), by Country 2025 & 2033
- Figure 61: Spain Europe SLI Battery Market Revenue Share (%), by Country 2025 & 2033
- Figure 62: Spain Europe SLI Battery Market Volume Share (%), by Country 2025 & 2033
- Figure 63: NORDIC Europe SLI Battery Market Revenue (Million), by Type 2025 & 2033
- Figure 64: NORDIC Europe SLI Battery Market Volume (Billion), by Type 2025 & 2033
- Figure 65: NORDIC Europe SLI Battery Market Revenue Share (%), by Type 2025 & 2033
- Figure 66: NORDIC Europe SLI Battery Market Volume Share (%), by Type 2025 & 2033
- Figure 67: NORDIC Europe SLI Battery Market Revenue (Million), by End-User 2025 & 2033
- Figure 68: NORDIC Europe SLI Battery Market Volume (Billion), by End-User 2025 & 2033
- Figure 69: NORDIC Europe SLI Battery Market Revenue Share (%), by End-User 2025 & 2033
- Figure 70: NORDIC Europe SLI Battery Market Volume Share (%), by End-User 2025 & 2033
- Figure 71: NORDIC Europe SLI Battery Market Revenue (Million), by Country 2025 & 2033
- Figure 72: NORDIC Europe SLI Battery Market Volume (Billion), by Country 2025 & 2033
- Figure 73: NORDIC Europe SLI Battery Market Revenue Share (%), by Country 2025 & 2033
- Figure 74: NORDIC Europe SLI Battery Market Volume Share (%), by Country 2025 & 2033
- Figure 75: Russia Europe SLI Battery Market Revenue (Million), by Type 2025 & 2033
- Figure 76: Russia Europe SLI Battery Market Volume (Billion), by Type 2025 & 2033
- Figure 77: Russia Europe SLI Battery Market Revenue Share (%), by Type 2025 & 2033
- Figure 78: Russia Europe SLI Battery Market Volume Share (%), by Type 2025 & 2033
- Figure 79: Russia Europe SLI Battery Market Revenue (Million), by End-User 2025 & 2033
- Figure 80: Russia Europe SLI Battery Market Volume (Billion), by End-User 2025 & 2033
- Figure 81: Russia Europe SLI Battery Market Revenue Share (%), by End-User 2025 & 2033
- Figure 82: Russia Europe SLI Battery Market Volume Share (%), by End-User 2025 & 2033
- Figure 83: Russia Europe SLI Battery Market Revenue (Million), by Country 2025 & 2033
- Figure 84: Russia Europe SLI Battery Market Volume (Billion), by Country 2025 & 2033
- Figure 85: Russia Europe SLI Battery Market Revenue Share (%), by Country 2025 & 2033
- Figure 86: Russia Europe SLI Battery Market Volume Share (%), by Country 2025 & 2033
- Figure 87: Turkey Europe SLI Battery Market Revenue (Million), by Type 2025 & 2033
- Figure 88: Turkey Europe SLI Battery Market Volume (Billion), by Type 2025 & 2033
- Figure 89: Turkey Europe SLI Battery Market Revenue Share (%), by Type 2025 & 2033
- Figure 90: Turkey Europe SLI Battery Market Volume Share (%), by Type 2025 & 2033
- Figure 91: Turkey Europe SLI Battery Market Revenue (Million), by End-User 2025 & 2033
- Figure 92: Turkey Europe SLI Battery Market Volume (Billion), by End-User 2025 & 2033
- Figure 93: Turkey Europe SLI Battery Market Revenue Share (%), by End-User 2025 & 2033
- Figure 94: Turkey Europe SLI Battery Market Volume Share (%), by End-User 2025 & 2033
- Figure 95: Turkey Europe SLI Battery Market Revenue (Million), by Country 2025 & 2033
- Figure 96: Turkey Europe SLI Battery Market Volume (Billion), by Country 2025 & 2033
- Figure 97: Turkey Europe SLI Battery Market Revenue Share (%), by Country 2025 & 2033
- Figure 98: Turkey Europe SLI Battery Market Volume Share (%), by Country 2025 & 2033
- Figure 99: Rest of Europe Europe SLI Battery Market Revenue (Million), by Type 2025 & 2033
- Figure 100: Rest of Europe Europe SLI Battery Market Volume (Billion), by Type 2025 & 2033
- Figure 101: Rest of Europe Europe SLI Battery Market Revenue Share (%), by Type 2025 & 2033
- Figure 102: Rest of Europe Europe SLI Battery Market Volume Share (%), by Type 2025 & 2033
- Figure 103: Rest of Europe Europe SLI Battery Market Revenue (Million), by End-User 2025 & 2033
- Figure 104: Rest of Europe Europe SLI Battery Market Volume (Billion), by End-User 2025 & 2033
- Figure 105: Rest of Europe Europe SLI Battery Market Revenue Share (%), by End-User 2025 & 2033
- Figure 106: Rest of Europe Europe SLI Battery Market Volume Share (%), by End-User 2025 & 2033
- Figure 107: Rest of Europe Europe SLI Battery Market Revenue (Million), by Country 2025 & 2033
- Figure 108: Rest of Europe Europe SLI Battery Market Volume (Billion), by Country 2025 & 2033
- Figure 109: Rest of Europe Europe SLI Battery Market Revenue Share (%), by Country 2025 & 2033
- Figure 110: Rest of Europe Europe SLI Battery Market Volume Share (%), by Country 2025 & 2033
List of Tables
- Table 1: Global Europe SLI Battery Market Revenue Million Forecast, by Type 2020 & 2033
- Table 2: Global Europe SLI Battery Market Volume Billion Forecast, by Type 2020 & 2033
- Table 3: Global Europe SLI Battery Market Revenue Million Forecast, by End-User 2020 & 2033
- Table 4: Global Europe SLI Battery Market Volume Billion Forecast, by End-User 2020 & 2033
- Table 5: Global Europe SLI Battery Market Revenue Million Forecast, by Region 2020 & 2033
- Table 6: Global Europe SLI Battery Market Volume Billion Forecast, by Region 2020 & 2033
- Table 7: Global Europe SLI Battery Market Revenue Million Forecast, by Type 2020 & 2033
- Table 8: Global Europe SLI Battery Market Volume Billion Forecast, by Type 2020 & 2033
- Table 9: Global Europe SLI Battery Market Revenue Million Forecast, by End-User 2020 & 2033
- Table 10: Global Europe SLI Battery Market Volume Billion Forecast, by End-User 2020 & 2033
- Table 11: Global Europe SLI Battery Market Revenue Million Forecast, by Country 2020 & 2033
- Table 12: Global Europe SLI Battery Market Volume Billion Forecast, by Country 2020 & 2033
- Table 13: Global Europe SLI Battery Market Revenue Million Forecast, by Type 2020 & 2033
- Table 14: Global Europe SLI Battery Market Volume Billion Forecast, by Type 2020 & 2033
- Table 15: Global Europe SLI Battery Market Revenue Million Forecast, by End-User 2020 & 2033
- Table 16: Global Europe SLI Battery Market Volume Billion Forecast, by End-User 2020 & 2033
- Table 17: Global Europe SLI Battery Market Revenue Million Forecast, by Country 2020 & 2033
- Table 18: Global Europe SLI Battery Market Volume Billion Forecast, by Country 2020 & 2033
- Table 19: Global Europe SLI Battery Market Revenue Million Forecast, by Type 2020 & 2033
- Table 20: Global Europe SLI Battery Market Volume Billion Forecast, by Type 2020 & 2033
- Table 21: Global Europe SLI Battery Market Revenue Million Forecast, by End-User 2020 & 2033
- Table 22: Global Europe SLI Battery Market Volume Billion Forecast, by End-User 2020 & 2033
- Table 23: Global Europe SLI Battery Market Revenue Million Forecast, by Country 2020 & 2033
- Table 24: Global Europe SLI Battery Market Volume Billion Forecast, by Country 2020 & 2033
- Table 25: Global Europe SLI Battery Market Revenue Million Forecast, by Type 2020 & 2033
- Table 26: Global Europe SLI Battery Market Volume Billion Forecast, by Type 2020 & 2033
- Table 27: Global Europe SLI Battery Market Revenue Million Forecast, by End-User 2020 & 2033
- Table 28: Global Europe SLI Battery Market Volume Billion Forecast, by End-User 2020 & 2033
- Table 29: Global Europe SLI Battery Market Revenue Million Forecast, by Country 2020 & 2033
- Table 30: Global Europe SLI Battery Market Volume Billion Forecast, by Country 2020 & 2033
- Table 31: Global Europe SLI Battery Market Revenue Million Forecast, by Type 2020 & 2033
- Table 32: Global Europe SLI Battery Market Volume Billion Forecast, by Type 2020 & 2033
- Table 33: Global Europe SLI Battery Market Revenue Million Forecast, by End-User 2020 & 2033
- Table 34: Global Europe SLI Battery Market Volume Billion Forecast, by End-User 2020 & 2033
- Table 35: Global Europe SLI Battery Market Revenue Million Forecast, by Country 2020 & 2033
- Table 36: Global Europe SLI Battery Market Volume Billion Forecast, by Country 2020 & 2033
- Table 37: Global Europe SLI Battery Market Revenue Million Forecast, by Type 2020 & 2033
- Table 38: Global Europe SLI Battery Market Volume Billion Forecast, by Type 2020 & 2033
- Table 39: Global Europe SLI Battery Market Revenue Million Forecast, by End-User 2020 & 2033
- Table 40: Global Europe SLI Battery Market Volume Billion Forecast, by End-User 2020 & 2033
- Table 41: Global Europe SLI Battery Market Revenue Million Forecast, by Country 2020 & 2033
- Table 42: Global Europe SLI Battery Market Volume Billion Forecast, by Country 2020 & 2033
- Table 43: Global Europe SLI Battery Market Revenue Million Forecast, by Type 2020 & 2033
- Table 44: Global Europe SLI Battery Market Volume Billion Forecast, by Type 2020 & 2033
- Table 45: Global Europe SLI Battery Market Revenue Million Forecast, by End-User 2020 & 2033
- Table 46: Global Europe SLI Battery Market Volume Billion Forecast, by End-User 2020 & 2033
- Table 47: Global Europe SLI Battery Market Revenue Million Forecast, by Country 2020 & 2033
- Table 48: Global Europe SLI Battery Market Volume Billion Forecast, by Country 2020 & 2033
- Table 49: Global Europe SLI Battery Market Revenue Million Forecast, by Type 2020 & 2033
- Table 50: Global Europe SLI Battery Market Volume Billion Forecast, by Type 2020 & 2033
- Table 51: Global Europe SLI Battery Market Revenue Million Forecast, by End-User 2020 & 2033
- Table 52: Global Europe SLI Battery Market Volume Billion Forecast, by End-User 2020 & 2033
- Table 53: Global Europe SLI Battery Market Revenue Million Forecast, by Country 2020 & 2033
- Table 54: Global Europe SLI Battery Market Volume Billion Forecast, by Country 2020 & 2033
- Table 55: Global Europe SLI Battery Market Revenue Million Forecast, by Type 2020 & 2033
- Table 56: Global Europe SLI Battery Market Volume Billion Forecast, by Type 2020 & 2033
- Table 57: Global Europe SLI Battery Market Revenue Million Forecast, by End-User 2020 & 2033
- Table 58: Global Europe SLI Battery Market Volume Billion Forecast, by End-User 2020 & 2033
- Table 59: Global Europe SLI Battery Market Revenue Million Forecast, by Country 2020 & 2033
- Table 60: Global Europe SLI Battery Market Volume Billion Forecast, by Country 2020 & 2033
Frequently Asked Questions
1. What is the projected Compound Annual Growth Rate (CAGR) of the Europe SLI Battery Market?
The projected CAGR is approximately 4.08%.
2. Which companies are prominent players in the Europe SLI Battery Market?
Key companies in the market include GS Yuasa International Ltd, Exide Technologies, Johnson Controls, EnerSys, Leoch International Technology Limited Inc, East Penn Manufacturing Company, C&D Technologies Inc, Clarios International Inc, Trojan Battery Company, Crown Battery Manufacturing Company*List Not Exhaustive 6 4 List of Other Prominent Companies6 5 Market Ranking/Share (%) Analysi.
3. What are the main segments of the Europe SLI Battery Market?
The market segments include Type, End-User.
4. Can you provide details about the market size?
The market size is estimated to be USD 6.5 Million as of 2022.
5. What are some drivers contributing to market growth?
4.; Increasing Adoption of Motor Vehicles4.; Growing Demand for SLI Batteries from Industrial and Agricultural Applications.
6. What are the notable trends driving market growth?
Automotive End User Industry to Witness Significant Growth.
7. Are there any restraints impacting market growth?
4.; Increasing Adoption of Motor Vehicles4.; Growing Demand for SLI Batteries from Industrial and Agricultural Applications.
8. Can you provide examples of recent developments in the market?
In February 2024, Euro Energy Resources Limited will unveil its latest breakthroughs in Valve-regulated Lead Acid (VRLA) batteries, redefining power storage benchmarks. The company's VRLA lineup includes gel cell and absorbed glass mat (AGM) variants tailored for diverse applications, spanning from high-power vehicle needs for SLI applications to deep-cycle demands in renewable energy storage.
9. What pricing options are available for accessing the report?
Pricing options include single-user, multi-user, and enterprise licenses priced at USD 4750, USD 5250, and USD 8750 respectively.
10. Is the market size provided in terms of value or volume?
The market size is provided in terms of value, measured in Million and volume, measured in Billion.
11. Are there any specific market keywords associated with the report?
Yes, the market keyword associated with the report is "Europe SLI Battery Market," which aids in identifying and referencing the specific market segment covered.
12. How do I determine which pricing option suits my needs best?
The pricing options vary based on user requirements and access needs. Individual users may opt for single-user licenses, while businesses requiring broader access may choose multi-user or enterprise licenses for cost-effective access to the report.
13. Are there any additional resources or data provided in the Europe SLI Battery Market report?
While the report offers comprehensive insights, it's advisable to review the specific contents or supplementary materials provided to ascertain if additional resources or data are available.
14. How can I stay updated on further developments or reports in the Europe SLI Battery Market?
To stay informed about further developments, trends, and reports in the Europe SLI Battery Market, consider subscribing to industry newsletters, following relevant companies and organizations, or regularly checking reputable industry news sources and publications.
Methodology
Step 1 - Identification of Relevant Samples Size from Population Database


Step 2 - Approaches for Defining Global Market Size (Value, Volume* & Price*)

Note*: In applicable scenarios
Step 3 - Data Sources
Primary Research
- Web Analytics
- Survey Reports
- Research Institute
- Latest Research Reports
- Opinion Leaders
Secondary Research
- Annual Reports
- White Paper
- Latest Press Release
- Industry Association
- Paid Database
- Investor Presentations

Step 4 - Data Triangulation
Involves using different sources of information in order to increase the validity of a study
These sources are likely to be stakeholders in a program - participants, other researchers, program staff, other community members, and so on.
Then we put all data in single framework & apply various statistical tools to find out the dynamic on the market.
During the analysis stage, feedback from the stakeholder groups would be compared to determine areas of agreement as well as areas of divergence