

Key Insights
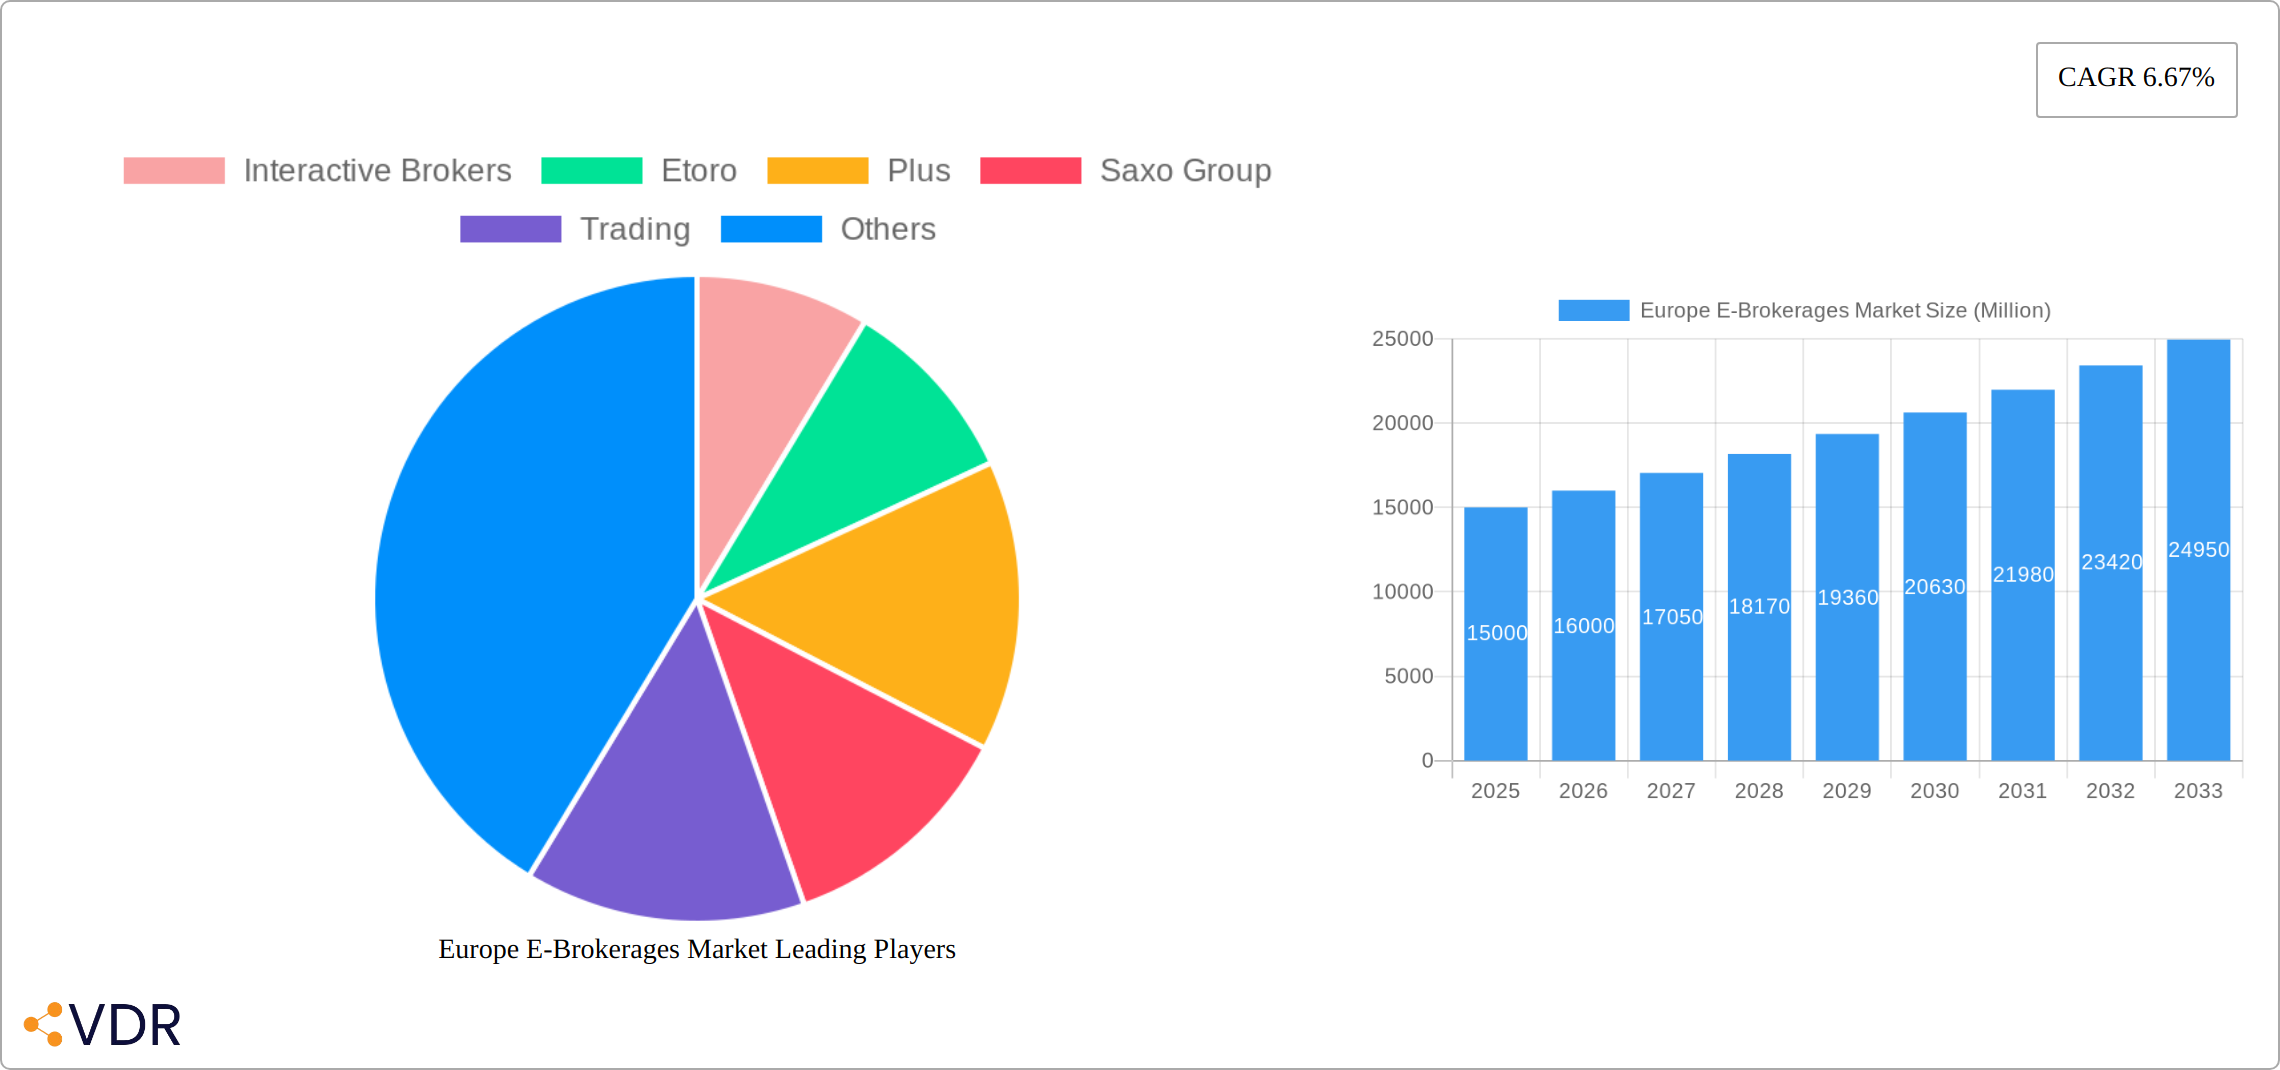
The European e-brokerage market demonstrates strong expansion, fueled by accelerating digitalization, the proliferation of mobile trading, and growing investor engagement among younger demographics. With a projected CAGR of 9.4% from a market size of 14.1 billion in the base year 2024, this upward trend is anticipated to persist. Key growth drivers include the enhanced accessibility and convenience of online platforms, reduced commission fees versus traditional services, and readily available educational resources and investment tools. The competitive arena is dynamic, featuring established entities and innovative new players. Success hinges on differentiation through platform usability, diverse investment product portfolios (ETFs, stocks, cryptocurrencies, options), superior customer service, and stringent regulatory adherence. Regional growth variances are expected, influenced by financial literacy and technology adoption rates.
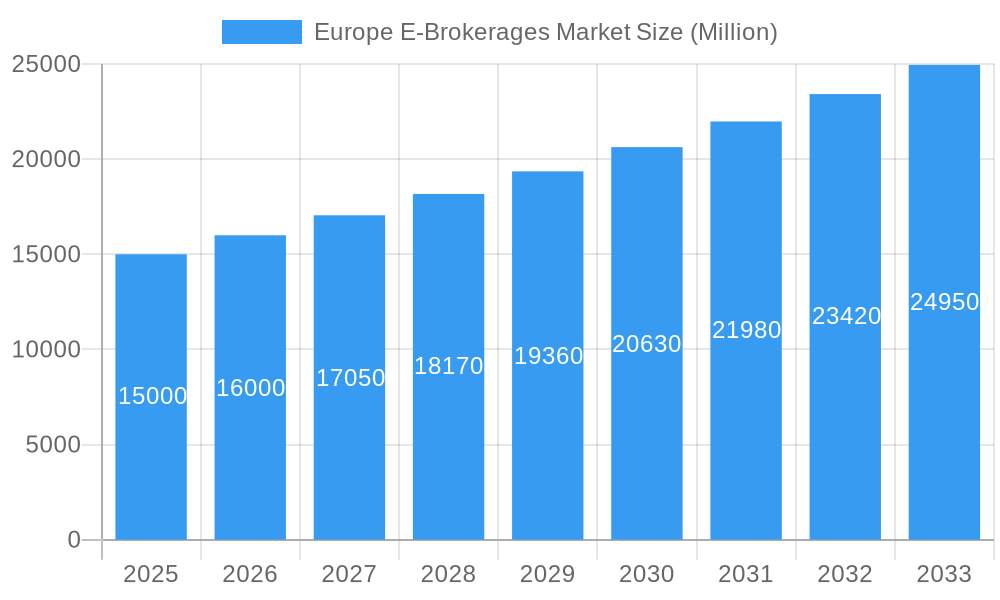
Europe E-Brokerages Market Market Size (In Billion)
European e-brokerage market segmentation spans diverse customer profiles (novice to expert traders), platform types (web and mobile), and service models (basic to advanced analytics). Intense competition necessitates ongoing innovation to meet evolving investor demands. Regulatory shifts within the EU, emphasizing investor protection and market transparency, are profoundly shaping operational frameworks. Future growth will be shaped by macroeconomic trends, technological innovations such as AI-driven trading, and evolving investor behaviors. Advanced investment tools will further cater to a broad investor base. Strategic collaborations and M&A activities are probable as companies aim to bolster market presence and product suites.
Europe E-Brokerages Market Company Market Share
Europe E-Brokerages Market: A Comprehensive Report (2019-2033)
This in-depth report provides a comprehensive analysis of the Europe E-brokerages market, encompassing market dynamics, growth trends, regional performance, key players, and future outlook. The study period covers 2019-2033, with 2025 as the base and estimated year. The report delves into the parent market of online brokerage services and the child market of European e-brokerage platforms, offering invaluable insights for industry professionals, investors, and strategic decision-makers. The market size is projected to reach xx Million by 2033.
Europe E-Brokerages Market Market Dynamics & Structure
The European e-brokerage market is a dynamic landscape shaped by intense competition, rapid technological advancements, and a complex regulatory environment. Established players and innovative fintech startups coexist, fostering both fierce rivalry and continuous innovation. This section delves into the key factors influencing the market's structure and competitive dynamics.
Market Concentration & Competition:
- Market concentration is moderate, with several dominant players controlling a significant portion of the market share. While precise figures fluctuate, the top 5 players likely accounted for approximately [Insert Updated Percentage]% of the market in 2025. This concentration is expected to [Increase/Decrease/Remain relatively stable] in the coming years.
- Competition is fierce, driven by aggressive pricing strategies, the relentless pursuit of technological superiority, and the ever-evolving regulatory compliance landscape. Differentiation through unique features and superior customer service is crucial for success.
Technological Innovation:
- The market is characterized by continuous technological innovation, with advanced trading platforms, AI-powered analytical tools, and seamless mobile-first functionalities driving user engagement and efficiency.
- Emerging technologies like blockchain and decentralized finance (DeFi) hold significant disruptive potential, although mainstream adoption remains relatively limited. The implications of these technologies for the future of e-brokerages warrant close monitoring.
- Significant barriers to innovation persist, including the substantial financial investments required for technology upgrades and the complexities of navigating a rapidly changing regulatory landscape.
Regulatory Framework:
- The European Securities and Markets Authority (ESMA) plays a pivotal role in shaping market operations, particularly concerning investor protection, risk management, and the overall integrity of the financial markets. Adherence to ESMA regulations is paramount for all market participants.
- Compliance with the General Data Protection Regulation (GDPR) and other evolving data privacy laws is critical, impacting data handling practices and demanding robust security measures.
- [Add any other relevant regulatory bodies or specific regulations impacting the market]
Competitive Product Substitutes:
- Traditional brokerage firms remain competitive, but e-brokerages' superior convenience and cost-effectiveness provide a compelling advantage, particularly for digitally native investors.
- Robo-advisors and other automated investment platforms represent a growing form of indirect competition, targeting investors seeking automated, low-cost investment solutions.
- [Add any other relevant competitive substitutes]
End-User Demographics:
- The user base spans both retail and institutional investors, with a notable rise in younger investors' participation. Understanding the diverse needs and preferences of these different segments is crucial for targeted service development.
- Investor sophistication varies widely, influencing the demand for different service levels, from basic trading functionalities to sophisticated analytical tools and personalized investment advice.
M&A Trends:
- Consolidation and the pursuit of technological advancement have fueled a moderate level of mergers and acquisitions (M&A) activity in recent years. The estimated volume of M&A deals in 2024 was [Insert Updated Number], indicating [Growth/Decline/Stabilization] compared to previous years. This trend is expected to [continue/slow down/accelerate] in the future, driven by [mention specific factors]
Europe E-Brokerages Market Growth Trends & Insights
The European e-brokerages market has experienced significant growth over the past few years, driven by the increasing adoption of online trading platforms and a rise in retail investor participation. This trend is expected to continue, fuelled by technological advancements and favorable market conditions. The Compound Annual Growth Rate (CAGR) for the market is projected to be xx% during the forecast period (2025-2033), with market penetration expected to reach xx% by 2033. This growth is being driven by several key factors including:
- Increased accessibility to financial markets: Online platforms lower barriers to entry for retail investors.
- Technological advancements: Improved trading platforms and mobile apps provide a seamless user experience.
- Rising digital adoption: Consumers are increasingly comfortable managing their finances online.
- Growing awareness of financial investment opportunities: Education and marketing efforts increase interest in investing.
- Favorable regulatory conditions (with caveats): While regulatory complexity exists, frameworks aim to enhance market transparency and investor protection.
Dominant Regions, Countries, or Segments in Europe E-Brokerages Market
The UK, Germany, and France are the leading markets within Europe, driven by high internet penetration, robust financial literacy, and a relatively developed regulatory environment. However, other countries within the EU are demonstrating promising growth potential.
- United Kingdom: A highly developed financial ecosystem, coupled with high digital literacy, makes the UK a dominant market.
- Germany: A large and financially stable economy, but a more risk-averse investor culture than the UK, influences growth patterns.
- France: Similar to Germany, a large market with growing adoption of online brokerage services.
- Other EU Countries: Scandinavia and the Benelux countries exhibit strong potential due to high tech adoption and financial savviness. Eastern European countries display a slower but steady rate of growth driven by economic development.
Key Drivers:
- Strong economic growth (in certain regions): Economic stability fuels investor confidence and investment activity.
- Favorable regulatory environments: Regulations fostering investor confidence support market expansion.
- High internet penetration: Broad access to the internet facilitates online trading adoption.
- Growing awareness and financial education: Increased financial literacy drives participation in the market.
Europe E-Brokerages Market Product Landscape
E-brokerage platforms are increasingly sophisticated, offering a range of products and services beyond basic trading. Key offerings include advanced charting tools, automated trading systems, educational resources, and diverse asset classes (stocks, bonds, forex, cryptocurrencies, options, etc.). The competitive advantage hinges on user-friendly interfaces, competitive pricing, superior customer service, and unique features like fractional shares or copy trading.
Key Drivers, Barriers & Challenges in Europe E-Brokerages Market
Key Drivers:
- The rising popularity of online trading among retail and institutional investors is a primary growth driver.
- Technological advancements, such as AI-driven trading tools and mobile-first applications, are improving the user experience and attracting new customers.
- Favorable regulatory frameworks in certain regions are encouraging market expansion.
Key Challenges and Restraints:
- Regulatory uncertainty and evolving compliance requirements represent ongoing challenges for e-brokerages. Failure to meet stringent requirements can lead to significant financial penalties (quantifiable impact: xx Million in potential fines annually, estimated).
- Cybersecurity threats and data breaches pose risks to both the brokerages and their clients (quantifiable impact: potential loss of client trust and revenue).
- Intense competition from established and new market entrants necessitates continuous innovation and adaptation.
Emerging Opportunities in Europe E-Brokerages Market
- Expansion into underserved markets: Reaching out to previously untapped demographics (e.g., older generations, specific geographic regions) presents opportunities.
- Development of niche investment products: Catering to specialized investment strategies (e.g., ESG investing, thematic investing) can attract specific investor segments.
- Integration of innovative technologies: The adoption of blockchain, AI, and other cutting-edge technologies could improve platform functionality and efficiency.
Growth Accelerators in the Europe E-Brokerages Market Industry
Strategic partnerships with financial institutions and technology providers can accelerate market penetration and enhance service offerings. Furthermore, investments in research and development, coupled with effective marketing and client education programs, will play a crucial role in sustaining long-term growth. The expansion into new geographic regions, while carefully navigating regulatory differences, can yield significant returns.
Key Players Shaping the Europe E-Brokerages Market Market
- Interactive Brokers
- Etoro
- Plus500
- Saxo Group
- Trading 212
- Degiro
- Exante
- X-Trade Brokers
- Robinhood
- SwissQuote
- BUX
- Vanguard
- Capital.com
- Tradestation
- Freetrade
- Hargreaves Lansdown
- IC Markets
- Other Key Players (List Not Exhaustive)
Notable Milestones in Europe E-Brokerages Market Sector
- February 2023: Interactive Brokers launched its new IBUSOPT order destination, enhancing options trading execution for retail and institutional clients. This reflects the growing popularity of options trading and a commitment to improving service quality.
- January 2023: eToro launched ValueGurus, providing retail investors with access to portfolios curated by experienced value investors. This initiative aims to attract investors seeking long-term, value-driven investments and reflects the increasing demand for curated investment strategies.
In-Depth Europe E-Brokerages Market Market Outlook
The future of the European e-brokerages market appears bright, with continued growth driven by technological advancements, regulatory developments, and evolving investor behavior. Opportunities abound for companies that can adapt to the changing market landscape, focusing on innovation, customer experience, and strategic partnerships. The increasing demand for personalized investment solutions and sophisticated trading tools will shape future market dynamics, providing a fertile ground for growth and innovation.
Europe E-Brokerages Market Segmentation
-
1. Investor Type
- 1.1. Retail
- 1.2. Institutional
-
2. Services Offered
- 2.1. Full Time Brokers
- 2.2. Discount Brokers
-
3. Operation
- 3.1. Domestic
- 3.2. Foreign
Europe E-Brokerages Market Segmentation By Geography
- 1. Germany
- 2. United Kingdom
- 3. Russia
- 4. Spain
- 5. Netherlands
- 6. Denmark
- 7. Sweden
- 8. Finland
- 9. Norway
- 10. Rest of Europe
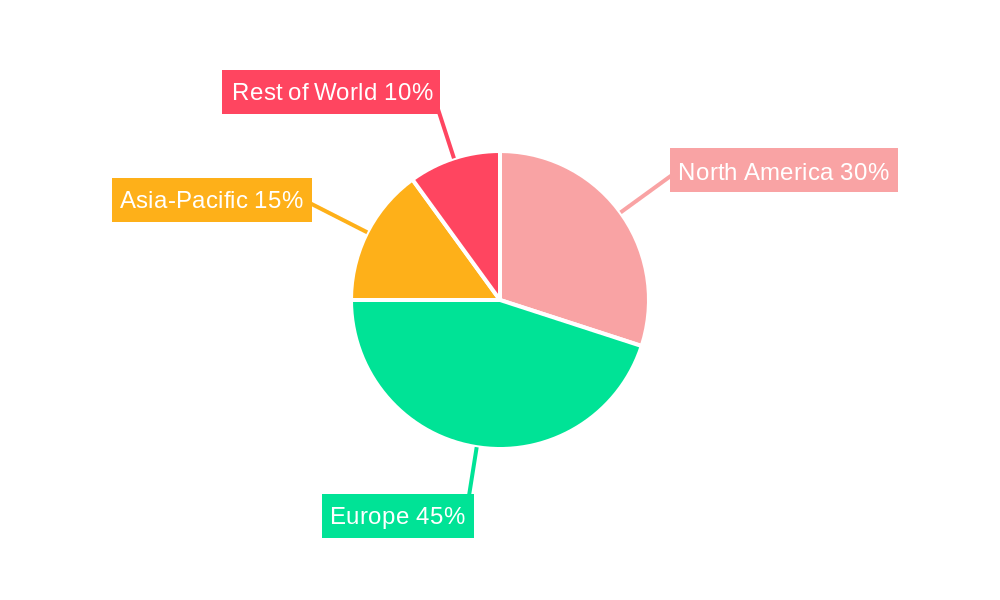
Europe E-Brokerages Market Regional Market Share
Geographic Coverage of Europe E-Brokerages Market
Europe E-Brokerages Market REPORT HIGHLIGHTS
| Aspects | Details |
|---|---|
| Study Period | 2020-2034 |
| Base Year | 2025 |
| Estimated Year | 2026 |
| Forecast Period | 2026-2034 |
| Historical Period | 2020-2025 |
| Growth Rate | CAGR of 9.4% from 2020-2034 |
| Segmentation |
|
Table of Contents
- 1. Introduction
- 1.1. Research Scope
- 1.2. Market Segmentation
- 1.3. Research Objective
- 1.4. Definitions and Assumptions
- 2. Executive Summary
- 2.1. Market Snapshot
- 3. Market Dynamics
- 3.1. Market Drivers
- 3.2. Market Restrains
- 3.3. Market Trends
- 3.4. Market Opportunities
- 4. Market Factor Analysis
- 4.1. Porters Five Forces
- 4.1.1. Bargaining Power of Suppliers
- 4.1.2. Bargaining Power of Buyers
- 4.1.3. Threat of New Entrants
- 4.1.4. Threat of Substitutes
- 4.1.5. Competitive Rivalry
- 4.2. PESTEL analysis
- 4.3. BCG Analysis
- 4.3.1. Stars (High Growth, High Market Share)
- 4.3.2. Cash Cows (Low Growth, High Market Share)
- 4.3.3. Question Mark (High Growth, Low Market Share)
- 4.3.4. Dogs (Low Growth, Low Market Share)
- 4.4. Ansoff Matrix Analysis
- 4.5. Supply Chain Analysis
- 4.6. Regulatory Landscape
- 4.7. Current Market Potential and Opportunity Assessment (TAM–SAM–SOM Framework)
- 4.8. VDR Analyst Note
- 4.1. Porters Five Forces
- 5. Market Analysis, Insights and Forecast 2021-2033
- 5.1. Market Analysis, Insights and Forecast - by Investor Type
- 5.1.1. Retail
- 5.1.2. Institutional
- 5.2. Market Analysis, Insights and Forecast - by Services Offered
- 5.2.1. Full Time Brokers
- 5.2.2. Discount Brokers
- 5.3. Market Analysis, Insights and Forecast - by Operation
- 5.3.1. Domestic
- 5.3.2. Foreign
- 5.4. Market Analysis, Insights and Forecast - by Region
- 5.4.1. Germany
- 5.4.2. United Kingdom
- 5.4.3. Russia
- 5.4.4. Spain
- 5.4.5. Netherlands
- 5.4.6. Denmark
- 5.4.7. Sweden
- 5.4.8. Finland
- 5.4.9. Norway
- 5.4.10. Rest of Europe
- 5.1. Market Analysis, Insights and Forecast - by Investor Type
- 6. Global Europe E-Brokerages Market Analysis, Insights and Forecast, 2021-2033
- 6.1. Market Analysis, Insights and Forecast - by Investor Type
- 6.1.1. Retail
- 6.1.2. Institutional
- 6.2. Market Analysis, Insights and Forecast - by Services Offered
- 6.2.1. Full Time Brokers
- 6.2.2. Discount Brokers
- 6.3. Market Analysis, Insights and Forecast - by Operation
- 6.3.1. Domestic
- 6.3.2. Foreign
- 6.1. Market Analysis, Insights and Forecast - by Investor Type
- 7. Germany Europe E-Brokerages Market Analysis, Insights and Forecast, 2021-2033
- 7.1. Market Analysis, Insights and Forecast - by Investor Type
- 7.1.1. Retail
- 7.1.2. Institutional
- 7.2. Market Analysis, Insights and Forecast - by Services Offered
- 7.2.1. Full Time Brokers
- 7.2.2. Discount Brokers
- 7.3. Market Analysis, Insights and Forecast - by Operation
- 7.3.1. Domestic
- 7.3.2. Foreign
- 7.1. Market Analysis, Insights and Forecast - by Investor Type
- 8. United Kingdom Europe E-Brokerages Market Analysis, Insights and Forecast, 2021-2033
- 8.1. Market Analysis, Insights and Forecast - by Investor Type
- 8.1.1. Retail
- 8.1.2. Institutional
- 8.2. Market Analysis, Insights and Forecast - by Services Offered
- 8.2.1. Full Time Brokers
- 8.2.2. Discount Brokers
- 8.3. Market Analysis, Insights and Forecast - by Operation
- 8.3.1. Domestic
- 8.3.2. Foreign
- 8.1. Market Analysis, Insights and Forecast - by Investor Type
- 9. Russia Europe E-Brokerages Market Analysis, Insights and Forecast, 2021-2033
- 9.1. Market Analysis, Insights and Forecast - by Investor Type
- 9.1.1. Retail
- 9.1.2. Institutional
- 9.2. Market Analysis, Insights and Forecast - by Services Offered
- 9.2.1. Full Time Brokers
- 9.2.2. Discount Brokers
- 9.3. Market Analysis, Insights and Forecast - by Operation
- 9.3.1. Domestic
- 9.3.2. Foreign
- 9.1. Market Analysis, Insights and Forecast - by Investor Type
- 10. Spain Europe E-Brokerages Market Analysis, Insights and Forecast, 2021-2033
- 10.1. Market Analysis, Insights and Forecast - by Investor Type
- 10.1.1. Retail
- 10.1.2. Institutional
- 10.2. Market Analysis, Insights and Forecast - by Services Offered
- 10.2.1. Full Time Brokers
- 10.2.2. Discount Brokers
- 10.3. Market Analysis, Insights and Forecast - by Operation
- 10.3.1. Domestic
- 10.3.2. Foreign
- 10.1. Market Analysis, Insights and Forecast - by Investor Type
- 11. Netherlands Europe E-Brokerages Market Analysis, Insights and Forecast, 2021-2033
- 11.1. Market Analysis, Insights and Forecast - by Investor Type
- 11.1.1. Retail
- 11.1.2. Institutional
- 11.2. Market Analysis, Insights and Forecast - by Services Offered
- 11.2.1. Full Time Brokers
- 11.2.2. Discount Brokers
- 11.3. Market Analysis, Insights and Forecast - by Operation
- 11.3.1. Domestic
- 11.3.2. Foreign
- 11.1. Market Analysis, Insights and Forecast - by Investor Type
- 12. Denmark Europe E-Brokerages Market Analysis, Insights and Forecast, 2021-2033
- 12.1. Market Analysis, Insights and Forecast - by Investor Type
- 12.1.1. Retail
- 12.1.2. Institutional
- 12.2. Market Analysis, Insights and Forecast - by Services Offered
- 12.2.1. Full Time Brokers
- 12.2.2. Discount Brokers
- 12.3. Market Analysis, Insights and Forecast - by Operation
- 12.3.1. Domestic
- 12.3.2. Foreign
- 12.1. Market Analysis, Insights and Forecast - by Investor Type
- 13. Sweden Europe E-Brokerages Market Analysis, Insights and Forecast, 2021-2033
- 13.1. Market Analysis, Insights and Forecast - by Investor Type
- 13.1.1. Retail
- 13.1.2. Institutional
- 13.2. Market Analysis, Insights and Forecast - by Services Offered
- 13.2.1. Full Time Brokers
- 13.2.2. Discount Brokers
- 13.3. Market Analysis, Insights and Forecast - by Operation
- 13.3.1. Domestic
- 13.3.2. Foreign
- 13.1. Market Analysis, Insights and Forecast - by Investor Type
- 14. Finland Europe E-Brokerages Market Analysis, Insights and Forecast, 2021-2033
- 14.1. Market Analysis, Insights and Forecast - by Investor Type
- 14.1.1. Retail
- 14.1.2. Institutional
- 14.2. Market Analysis, Insights and Forecast - by Services Offered
- 14.2.1. Full Time Brokers
- 14.2.2. Discount Brokers
- 14.3. Market Analysis, Insights and Forecast - by Operation
- 14.3.1. Domestic
- 14.3.2. Foreign
- 14.1. Market Analysis, Insights and Forecast - by Investor Type
- 15. Norway Europe E-Brokerages Market Analysis, Insights and Forecast, 2021-2033
- 15.1. Market Analysis, Insights and Forecast - by Investor Type
- 15.1.1. Retail
- 15.1.2. Institutional
- 15.2. Market Analysis, Insights and Forecast - by Services Offered
- 15.2.1. Full Time Brokers
- 15.2.2. Discount Brokers
- 15.3. Market Analysis, Insights and Forecast - by Operation
- 15.3.1. Domestic
- 15.3.2. Foreign
- 15.1. Market Analysis, Insights and Forecast - by Investor Type
- 16. Rest of Europe Europe E-Brokerages Market Analysis, Insights and Forecast, 2021-2033
- 16.1. Market Analysis, Insights and Forecast - by Investor Type
- 16.1.1. Retail
- 16.1.2. Institutional
- 16.2. Market Analysis, Insights and Forecast - by Services Offered
- 16.2.1. Full Time Brokers
- 16.2.2. Discount Brokers
- 16.3. Market Analysis, Insights and Forecast - by Operation
- 16.3.1. Domestic
- 16.3.2. Foreign
- 16.1. Market Analysis, Insights and Forecast - by Investor Type
- 17. Competitive Analysis
- 17.1. Company Profiles
- 17.1.1 Interactive Brokers
- 17.1.1.1. Company Overview
- 17.1.1.2. Products
- 17.1.1.3. Company Financials
- 17.1.1.4. SWOT Analysis
- 17.1.2 Etoro
- 17.1.2.1. Company Overview
- 17.1.2.2. Products
- 17.1.2.3. Company Financials
- 17.1.2.4. SWOT Analysis
- 17.1.3 Plus
- 17.1.3.1. Company Overview
- 17.1.3.2. Products
- 17.1.3.3. Company Financials
- 17.1.3.4. SWOT Analysis
- 17.1.4 Saxo Group
- 17.1.4.1. Company Overview
- 17.1.4.2. Products
- 17.1.4.3. Company Financials
- 17.1.4.4. SWOT Analysis
- 17.1.5 Trading
- 17.1.5.1. Company Overview
- 17.1.5.2. Products
- 17.1.5.3. Company Financials
- 17.1.5.4. SWOT Analysis
- 17.1.6 Degiro
- 17.1.6.1. Company Overview
- 17.1.6.2. Products
- 17.1.6.3. Company Financials
- 17.1.6.4. SWOT Analysis
- 17.1.7 Exante
- 17.1.7.1. Company Overview
- 17.1.7.2. Products
- 17.1.7.3. Company Financials
- 17.1.7.4. SWOT Analysis
- 17.1.8 X-Trade Brokers
- 17.1.8.1. Company Overview
- 17.1.8.2. Products
- 17.1.8.3. Company Financials
- 17.1.8.4. SWOT Analysis
- 17.1.9 Robinhood
- 17.1.9.1. Company Overview
- 17.1.9.2. Products
- 17.1.9.3. Company Financials
- 17.1.9.4. SWOT Analysis
- 17.1.10 SwissQuote
- 17.1.10.1. Company Overview
- 17.1.10.2. Products
- 17.1.10.3. Company Financials
- 17.1.10.4. SWOT Analysis
- 17.1.11 BUX
- 17.1.11.1. Company Overview
- 17.1.11.2. Products
- 17.1.11.3. Company Financials
- 17.1.11.4. SWOT Analysis
- 17.1.12 Vanguard
- 17.1.12.1. Company Overview
- 17.1.12.2. Products
- 17.1.12.3. Company Financials
- 17.1.12.4. SWOT Analysis
- 17.1.13 Capital Com
- 17.1.13.1. Company Overview
- 17.1.13.2. Products
- 17.1.13.3. Company Financials
- 17.1.13.4. SWOT Analysis
- 17.1.14 Tradestation
- 17.1.14.1. Company Overview
- 17.1.14.2. Products
- 17.1.14.3. Company Financials
- 17.1.14.4. SWOT Analysis
- 17.1.15 Freetrade
- 17.1.15.1. Company Overview
- 17.1.15.2. Products
- 17.1.15.3. Company Financials
- 17.1.15.4. SWOT Analysis
- 17.1.16 Hargreaves Lansdown
- 17.1.16.1. Company Overview
- 17.1.16.2. Products
- 17.1.16.3. Company Financials
- 17.1.16.4. SWOT Analysis
- 17.1.17 IC Market
- 17.1.17.1. Company Overview
- 17.1.17.2. Products
- 17.1.17.3. Company Financials
- 17.1.17.4. SWOT Analysis
- 17.1.18 Other Key Players**List Not Exhaustive
- 17.1.18.1. Company Overview
- 17.1.18.2. Products
- 17.1.18.3. Company Financials
- 17.1.18.4. SWOT Analysis
- 17.1.1 Interactive Brokers
- 17.2. Market Entropy
- 17.2.1 Company's Key Areas Served
- 17.2.2 Recent Developments
- 17.3. Company Market Share Analysis 2025
- 17.3.1 Top 5 Companies Market Share Analysis
- 17.3.2 Top 3 Companies Market Share Analysis
- 17.4. List of Potential Customers
- 18. Research Methodology
List of Figures
- Figure 1: Global Europe E-Brokerages Market Revenue Breakdown (billion, %) by Region 2025 & 2033
- Figure 2: Germany Europe E-Brokerages Market Revenue (billion), by Investor Type 2025 & 2033
- Figure 3: Germany Europe E-Brokerages Market Revenue Share (%), by Investor Type 2025 & 2033
- Figure 4: Germany Europe E-Brokerages Market Revenue (billion), by Services Offered 2025 & 2033
- Figure 5: Germany Europe E-Brokerages Market Revenue Share (%), by Services Offered 2025 & 2033
- Figure 6: Germany Europe E-Brokerages Market Revenue (billion), by Operation 2025 & 2033
- Figure 7: Germany Europe E-Brokerages Market Revenue Share (%), by Operation 2025 & 2033
- Figure 8: Germany Europe E-Brokerages Market Revenue (billion), by Country 2025 & 2033
- Figure 9: Germany Europe E-Brokerages Market Revenue Share (%), by Country 2025 & 2033
- Figure 10: United Kingdom Europe E-Brokerages Market Revenue (billion), by Investor Type 2025 & 2033
- Figure 11: United Kingdom Europe E-Brokerages Market Revenue Share (%), by Investor Type 2025 & 2033
- Figure 12: United Kingdom Europe E-Brokerages Market Revenue (billion), by Services Offered 2025 & 2033
- Figure 13: United Kingdom Europe E-Brokerages Market Revenue Share (%), by Services Offered 2025 & 2033
- Figure 14: United Kingdom Europe E-Brokerages Market Revenue (billion), by Operation 2025 & 2033
- Figure 15: United Kingdom Europe E-Brokerages Market Revenue Share (%), by Operation 2025 & 2033
- Figure 16: United Kingdom Europe E-Brokerages Market Revenue (billion), by Country 2025 & 2033
- Figure 17: United Kingdom Europe E-Brokerages Market Revenue Share (%), by Country 2025 & 2033
- Figure 18: Russia Europe E-Brokerages Market Revenue (billion), by Investor Type 2025 & 2033
- Figure 19: Russia Europe E-Brokerages Market Revenue Share (%), by Investor Type 2025 & 2033
- Figure 20: Russia Europe E-Brokerages Market Revenue (billion), by Services Offered 2025 & 2033
- Figure 21: Russia Europe E-Brokerages Market Revenue Share (%), by Services Offered 2025 & 2033
- Figure 22: Russia Europe E-Brokerages Market Revenue (billion), by Operation 2025 & 2033
- Figure 23: Russia Europe E-Brokerages Market Revenue Share (%), by Operation 2025 & 2033
- Figure 24: Russia Europe E-Brokerages Market Revenue (billion), by Country 2025 & 2033
- Figure 25: Russia Europe E-Brokerages Market Revenue Share (%), by Country 2025 & 2033
- Figure 26: Spain Europe E-Brokerages Market Revenue (billion), by Investor Type 2025 & 2033
- Figure 27: Spain Europe E-Brokerages Market Revenue Share (%), by Investor Type 2025 & 2033
- Figure 28: Spain Europe E-Brokerages Market Revenue (billion), by Services Offered 2025 & 2033
- Figure 29: Spain Europe E-Brokerages Market Revenue Share (%), by Services Offered 2025 & 2033
- Figure 30: Spain Europe E-Brokerages Market Revenue (billion), by Operation 2025 & 2033
- Figure 31: Spain Europe E-Brokerages Market Revenue Share (%), by Operation 2025 & 2033
- Figure 32: Spain Europe E-Brokerages Market Revenue (billion), by Country 2025 & 2033
- Figure 33: Spain Europe E-Brokerages Market Revenue Share (%), by Country 2025 & 2033
- Figure 34: Netherlands Europe E-Brokerages Market Revenue (billion), by Investor Type 2025 & 2033
- Figure 35: Netherlands Europe E-Brokerages Market Revenue Share (%), by Investor Type 2025 & 2033
- Figure 36: Netherlands Europe E-Brokerages Market Revenue (billion), by Services Offered 2025 & 2033
- Figure 37: Netherlands Europe E-Brokerages Market Revenue Share (%), by Services Offered 2025 & 2033
- Figure 38: Netherlands Europe E-Brokerages Market Revenue (billion), by Operation 2025 & 2033
- Figure 39: Netherlands Europe E-Brokerages Market Revenue Share (%), by Operation 2025 & 2033
- Figure 40: Netherlands Europe E-Brokerages Market Revenue (billion), by Country 2025 & 2033
- Figure 41: Netherlands Europe E-Brokerages Market Revenue Share (%), by Country 2025 & 2033
- Figure 42: Denmark Europe E-Brokerages Market Revenue (billion), by Investor Type 2025 & 2033
- Figure 43: Denmark Europe E-Brokerages Market Revenue Share (%), by Investor Type 2025 & 2033
- Figure 44: Denmark Europe E-Brokerages Market Revenue (billion), by Services Offered 2025 & 2033
- Figure 45: Denmark Europe E-Brokerages Market Revenue Share (%), by Services Offered 2025 & 2033
- Figure 46: Denmark Europe E-Brokerages Market Revenue (billion), by Operation 2025 & 2033
- Figure 47: Denmark Europe E-Brokerages Market Revenue Share (%), by Operation 2025 & 2033
- Figure 48: Denmark Europe E-Brokerages Market Revenue (billion), by Country 2025 & 2033
- Figure 49: Denmark Europe E-Brokerages Market Revenue Share (%), by Country 2025 & 2033
- Figure 50: Sweden Europe E-Brokerages Market Revenue (billion), by Investor Type 2025 & 2033
- Figure 51: Sweden Europe E-Brokerages Market Revenue Share (%), by Investor Type 2025 & 2033
- Figure 52: Sweden Europe E-Brokerages Market Revenue (billion), by Services Offered 2025 & 2033
- Figure 53: Sweden Europe E-Brokerages Market Revenue Share (%), by Services Offered 2025 & 2033
- Figure 54: Sweden Europe E-Brokerages Market Revenue (billion), by Operation 2025 & 2033
- Figure 55: Sweden Europe E-Brokerages Market Revenue Share (%), by Operation 2025 & 2033
- Figure 56: Sweden Europe E-Brokerages Market Revenue (billion), by Country 2025 & 2033
- Figure 57: Sweden Europe E-Brokerages Market Revenue Share (%), by Country 2025 & 2033
- Figure 58: Finland Europe E-Brokerages Market Revenue (billion), by Investor Type 2025 & 2033
- Figure 59: Finland Europe E-Brokerages Market Revenue Share (%), by Investor Type 2025 & 2033
- Figure 60: Finland Europe E-Brokerages Market Revenue (billion), by Services Offered 2025 & 2033
- Figure 61: Finland Europe E-Brokerages Market Revenue Share (%), by Services Offered 2025 & 2033
- Figure 62: Finland Europe E-Brokerages Market Revenue (billion), by Operation 2025 & 2033
- Figure 63: Finland Europe E-Brokerages Market Revenue Share (%), by Operation 2025 & 2033
- Figure 64: Finland Europe E-Brokerages Market Revenue (billion), by Country 2025 & 2033
- Figure 65: Finland Europe E-Brokerages Market Revenue Share (%), by Country 2025 & 2033
- Figure 66: Norway Europe E-Brokerages Market Revenue (billion), by Investor Type 2025 & 2033
- Figure 67: Norway Europe E-Brokerages Market Revenue Share (%), by Investor Type 2025 & 2033
- Figure 68: Norway Europe E-Brokerages Market Revenue (billion), by Services Offered 2025 & 2033
- Figure 69: Norway Europe E-Brokerages Market Revenue Share (%), by Services Offered 2025 & 2033
- Figure 70: Norway Europe E-Brokerages Market Revenue (billion), by Operation 2025 & 2033
- Figure 71: Norway Europe E-Brokerages Market Revenue Share (%), by Operation 2025 & 2033
- Figure 72: Norway Europe E-Brokerages Market Revenue (billion), by Country 2025 & 2033
- Figure 73: Norway Europe E-Brokerages Market Revenue Share (%), by Country 2025 & 2033
- Figure 74: Rest of Europe Europe E-Brokerages Market Revenue (billion), by Investor Type 2025 & 2033
- Figure 75: Rest of Europe Europe E-Brokerages Market Revenue Share (%), by Investor Type 2025 & 2033
- Figure 76: Rest of Europe Europe E-Brokerages Market Revenue (billion), by Services Offered 2025 & 2033
- Figure 77: Rest of Europe Europe E-Brokerages Market Revenue Share (%), by Services Offered 2025 & 2033
- Figure 78: Rest of Europe Europe E-Brokerages Market Revenue (billion), by Operation 2025 & 2033
- Figure 79: Rest of Europe Europe E-Brokerages Market Revenue Share (%), by Operation 2025 & 2033
- Figure 80: Rest of Europe Europe E-Brokerages Market Revenue (billion), by Country 2025 & 2033
- Figure 81: Rest of Europe Europe E-Brokerages Market Revenue Share (%), by Country 2025 & 2033
List of Tables
- Table 1: Global Europe E-Brokerages Market Revenue billion Forecast, by Investor Type 2020 & 2033
- Table 2: Global Europe E-Brokerages Market Revenue billion Forecast, by Services Offered 2020 & 2033
- Table 3: Global Europe E-Brokerages Market Revenue billion Forecast, by Operation 2020 & 2033
- Table 4: Global Europe E-Brokerages Market Revenue billion Forecast, by Region 2020 & 2033
- Table 5: Global Europe E-Brokerages Market Revenue billion Forecast, by Investor Type 2020 & 2033
- Table 6: Global Europe E-Brokerages Market Revenue billion Forecast, by Services Offered 2020 & 2033
- Table 7: Global Europe E-Brokerages Market Revenue billion Forecast, by Operation 2020 & 2033
- Table 8: Global Europe E-Brokerages Market Revenue billion Forecast, by Country 2020 & 2033
- Table 9: Global Europe E-Brokerages Market Revenue billion Forecast, by Investor Type 2020 & 2033
- Table 10: Global Europe E-Brokerages Market Revenue billion Forecast, by Services Offered 2020 & 2033
- Table 11: Global Europe E-Brokerages Market Revenue billion Forecast, by Operation 2020 & 2033
- Table 12: Global Europe E-Brokerages Market Revenue billion Forecast, by Country 2020 & 2033
- Table 13: Global Europe E-Brokerages Market Revenue billion Forecast, by Investor Type 2020 & 2033
- Table 14: Global Europe E-Brokerages Market Revenue billion Forecast, by Services Offered 2020 & 2033
- Table 15: Global Europe E-Brokerages Market Revenue billion Forecast, by Operation 2020 & 2033
- Table 16: Global Europe E-Brokerages Market Revenue billion Forecast, by Country 2020 & 2033
- Table 17: Global Europe E-Brokerages Market Revenue billion Forecast, by Investor Type 2020 & 2033
- Table 18: Global Europe E-Brokerages Market Revenue billion Forecast, by Services Offered 2020 & 2033
- Table 19: Global Europe E-Brokerages Market Revenue billion Forecast, by Operation 2020 & 2033
- Table 20: Global Europe E-Brokerages Market Revenue billion Forecast, by Country 2020 & 2033
- Table 21: Global Europe E-Brokerages Market Revenue billion Forecast, by Investor Type 2020 & 2033
- Table 22: Global Europe E-Brokerages Market Revenue billion Forecast, by Services Offered 2020 & 2033
- Table 23: Global Europe E-Brokerages Market Revenue billion Forecast, by Operation 2020 & 2033
- Table 24: Global Europe E-Brokerages Market Revenue billion Forecast, by Country 2020 & 2033
- Table 25: Global Europe E-Brokerages Market Revenue billion Forecast, by Investor Type 2020 & 2033
- Table 26: Global Europe E-Brokerages Market Revenue billion Forecast, by Services Offered 2020 & 2033
- Table 27: Global Europe E-Brokerages Market Revenue billion Forecast, by Operation 2020 & 2033
- Table 28: Global Europe E-Brokerages Market Revenue billion Forecast, by Country 2020 & 2033
- Table 29: Global Europe E-Brokerages Market Revenue billion Forecast, by Investor Type 2020 & 2033
- Table 30: Global Europe E-Brokerages Market Revenue billion Forecast, by Services Offered 2020 & 2033
- Table 31: Global Europe E-Brokerages Market Revenue billion Forecast, by Operation 2020 & 2033
- Table 32: Global Europe E-Brokerages Market Revenue billion Forecast, by Country 2020 & 2033
- Table 33: Global Europe E-Brokerages Market Revenue billion Forecast, by Investor Type 2020 & 2033
- Table 34: Global Europe E-Brokerages Market Revenue billion Forecast, by Services Offered 2020 & 2033
- Table 35: Global Europe E-Brokerages Market Revenue billion Forecast, by Operation 2020 & 2033
- Table 36: Global Europe E-Brokerages Market Revenue billion Forecast, by Country 2020 & 2033
- Table 37: Global Europe E-Brokerages Market Revenue billion Forecast, by Investor Type 2020 & 2033
- Table 38: Global Europe E-Brokerages Market Revenue billion Forecast, by Services Offered 2020 & 2033
- Table 39: Global Europe E-Brokerages Market Revenue billion Forecast, by Operation 2020 & 2033
- Table 40: Global Europe E-Brokerages Market Revenue billion Forecast, by Country 2020 & 2033
- Table 41: Global Europe E-Brokerages Market Revenue billion Forecast, by Investor Type 2020 & 2033
- Table 42: Global Europe E-Brokerages Market Revenue billion Forecast, by Services Offered 2020 & 2033
- Table 43: Global Europe E-Brokerages Market Revenue billion Forecast, by Operation 2020 & 2033
- Table 44: Global Europe E-Brokerages Market Revenue billion Forecast, by Country 2020 & 2033
Frequently Asked Questions
1. What is the projected Compound Annual Growth Rate (CAGR) of the Europe E-Brokerages Market?
The projected CAGR is approximately 9.4%.
2. Which companies are prominent players in the Europe E-Brokerages Market?
Key companies in the market include Interactive Brokers, Etoro, Plus, Saxo Group, Trading, Degiro, Exante, X-Trade Brokers, Robinhood, SwissQuote, BUX, Vanguard, Capital Com, Tradestation, Freetrade, Hargreaves Lansdown, IC Market, Other Key Players**List Not Exhaustive.
3. What are the main segments of the Europe E-Brokerages Market?
The market segments include Investor Type, Services Offered, Operation.
4. Can you provide details about the market size?
The market size is estimated to be USD 14.1 billion as of 2022.
5. What are some drivers contributing to market growth?
N/A
6. What are the notable trends driving market growth?
Growing Retail Investors in The Region is Driving The E-Brokerages Market.
7. Are there any restraints impacting market growth?
N/A
8. Can you provide examples of recent developments in the market?
February 2023: Interactive Brokers announced the launch of its new IBUSOPT order destination. With the dramatic increase in retail options trading, Interactive Brokers has launched this new order destination to help its retail and institutional clients achieve better price execution on their options trades.
9. What pricing options are available for accessing the report?
Pricing options include single-user, multi-user, and enterprise licenses priced at USD 4750, USD 5250, and USD 8750 respectively.
10. Is the market size provided in terms of value or volume?
The market size is provided in terms of value, measured in billion.
11. Are there any specific market keywords associated with the report?
Yes, the market keyword associated with the report is "Europe E-Brokerages Market," which aids in identifying and referencing the specific market segment covered.
12. How do I determine which pricing option suits my needs best?
The pricing options vary based on user requirements and access needs. Individual users may opt for single-user licenses, while businesses requiring broader access may choose multi-user or enterprise licenses for cost-effective access to the report.
13. Are there any additional resources or data provided in the Europe E-Brokerages Market report?
While the report offers comprehensive insights, it's advisable to review the specific contents or supplementary materials provided to ascertain if additional resources or data are available.
14. How can I stay updated on further developments or reports in the Europe E-Brokerages Market?
To stay informed about further developments, trends, and reports in the Europe E-Brokerages Market, consider subscribing to industry newsletters, following relevant companies and organizations, or regularly checking reputable industry news sources and publications.
Methodology
Step 1 - Identification of Relevant Samples Size from Population Database


Step 2 - Approaches for Defining Global Market Size (Value, Volume* & Price*)

Note*: In applicable scenarios
Step 3 - Data Sources
Primary Research
- Web Analytics
- Survey Reports
- Research Institute
- Latest Research Reports
- Opinion Leaders
Secondary Research
- Annual Reports
- White Paper
- Latest Press Release
- Industry Association
- Paid Database
- Investor Presentations

Step 4 - Data Triangulation
Involves using different sources of information in order to increase the validity of a study
These sources are likely to be stakeholders in a program - participants, other researchers, program staff, other community members, and so on.
Then we put all data in single framework & apply various statistical tools to find out the dynamic on the market.
During the analysis stage, feedback from the stakeholder groups would be compared to determine areas of agreement as well as areas of divergence