

Key Insights
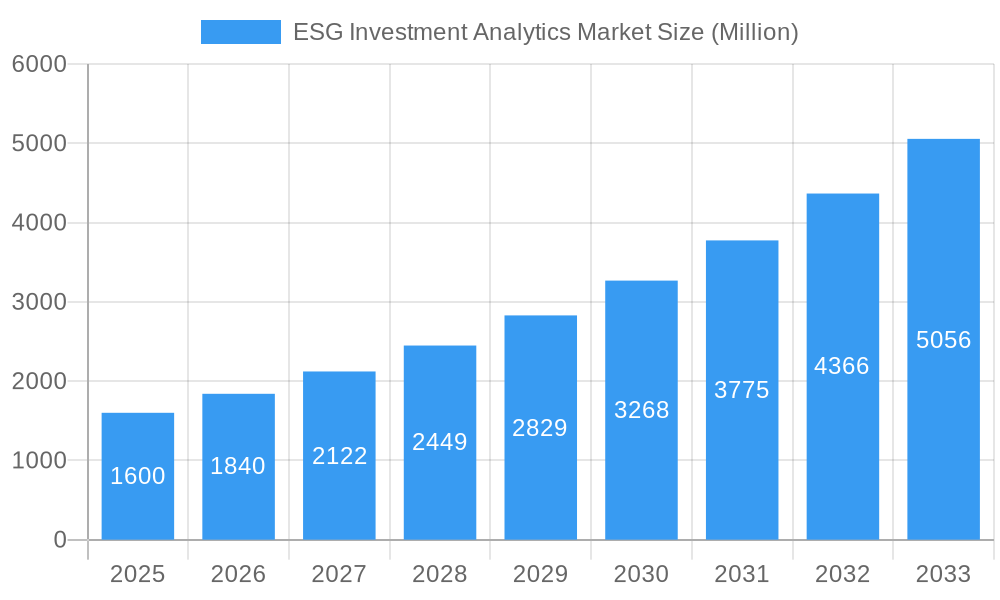
The ESG (Environmental, Social, and Governance) Investment Analytics market is experiencing robust growth, projected to reach \$1.60 billion in 2025 and maintain a Compound Annual Growth Rate (CAGR) of 15.12% from 2025 to 2033. This expansion is driven by increasing regulatory scrutiny of ESG performance, growing investor demand for sustainable investments, and the rising awareness of environmental and social risks among corporations. The market is further propelled by technological advancements enabling more sophisticated data analysis and reporting, facilitating better ESG performance measurement and risk management. Key players like PwC, EY, Deloitte, KPMG, and specialized firms like MSCI Inc. and RepRisk are driving innovation and competition within the sector, offering a range of services from data analytics and reporting to ESG consulting and assurance. The market’s segmentation likely includes offerings tailored to different investor types (institutional, retail), asset classes (equities, fixed income), and specific ESG factors (carbon emissions, social impact, governance practices). Geographical distribution will likely see strong growth in North America and Europe, reflecting established financial markets and stringent ESG regulations. However, growth opportunities also exist in emerging markets as ESG investing gains traction globally.
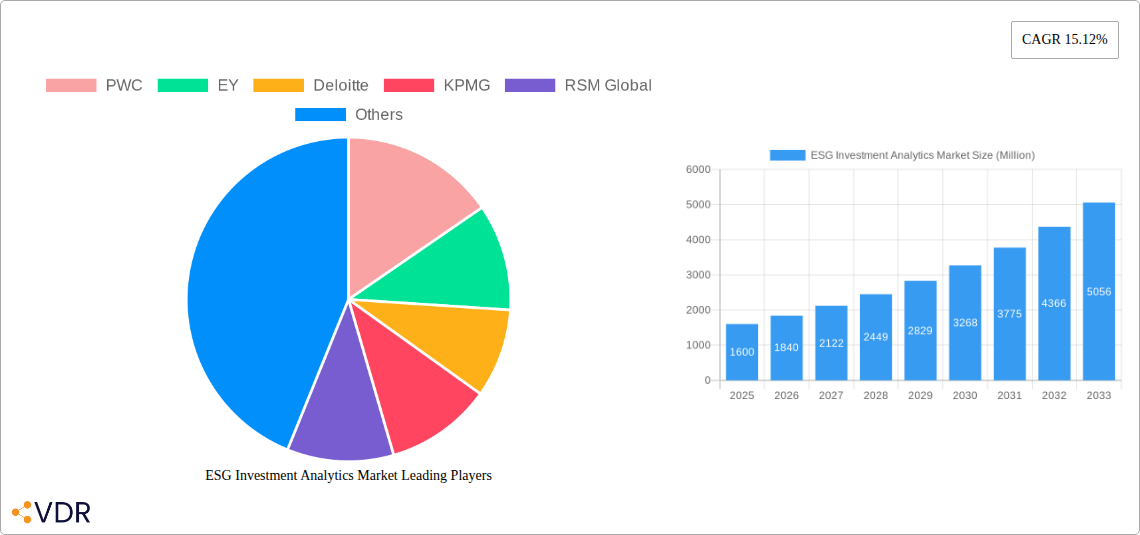
ESG Investment Analytics Market Market Size (In Billion)
The significant growth trajectory is expected to continue throughout the forecast period due to ongoing regulatory changes, strengthening investor preferences, and the increasing integration of ESG factors into mainstream investment decisions. While challenges such as data standardization and the complexity of ESG metrics remain, market innovations and the consolidation of data providers are expected to alleviate these concerns. The market's future success hinges on the continuous development of robust and reliable ESG data, the ability to effectively integrate ESG analysis into investment workflows, and the expanding availability of ESG-related investment products. The competitive landscape will likely evolve with mergers and acquisitions, further driving innovation and potentially leading to market consolidation among leading providers.
ESG Investment Analytics Market Company Market Share
ESG Investment Analytics Market: A Comprehensive Report (2019-2033)
This comprehensive report provides an in-depth analysis of the ESG Investment Analytics Market, encompassing market dynamics, growth trends, regional dominance, product landscape, key players, and future outlook. The study period covers 2019-2033, with 2025 serving as the base and estimated year. The report offers valuable insights for investors, industry professionals, and strategists seeking to navigate this rapidly evolving market. The parent market is the broader Financial Technology (FinTech) sector, while the child market is specifically ESG data analytics and reporting tools.
ESG Investment Analytics Market Dynamics & Structure
The ESG Investment Analytics Market is experiencing robust growth, driven by increasing regulatory scrutiny, heightened investor demand for sustainable investments, and technological advancements. Market concentration is moderate, with a few large players (e.g., PwC, EY, Deloitte, KPMG) holding significant market share, but numerous niche players also contribute. Technological innovation, particularly in AI and machine learning, is transforming data analysis and reporting capabilities. However, integration challenges and data standardization remain barriers to wider adoption. M&A activity is also increasing, with larger firms acquiring smaller specialized companies to expand their offerings. The market is segmented by service type (data analytics, reporting, consulting), deployment mode (cloud, on-premise), and end-user (institutional investors, asset managers, corporations).
- Market Concentration: Moderately concentrated, with top 5 players holding approximately xx% market share in 2025.
- Technological Drivers: AI, Machine Learning, Big Data analytics are transforming data processing and insights generation.
- Regulatory Framework: Increasingly stringent regulations (e.g., SFDR, CSRD) are driving demand for robust ESG analytics.
- Competitive Substitutes: Limited direct substitutes, but general market research and financial analysis tools provide indirect competition.
- End-User Demographics: Primarily institutional investors, asset managers, and corporations with large portfolios.
- M&A Trends: Increasing deal volume driven by expansion strategies and technology acquisition. Approximately xx M&A deals were recorded between 2019 and 2024.
ESG Investment Analytics Market Growth Trends & Insights
The ESG Investment Analytics Market is projected to experience significant growth during the forecast period (2025-2033). The market size is estimated at $xx million in 2025 and is projected to reach $xx million by 2033, exhibiting a CAGR of xx%. This growth is fueled by rising investor awareness of ESG factors, the increasing availability of ESG data, and the development of sophisticated analytical tools. Adoption rates are steadily increasing, particularly amongst institutional investors seeking to integrate ESG considerations into their investment strategies. Technological disruptions, such as the rise of AI-powered analytics, are further accelerating market growth. Consumer behavior shifts toward sustainable and responsible investments are significantly contributing to this trend. Market penetration is expected to reach xx% by 2033.
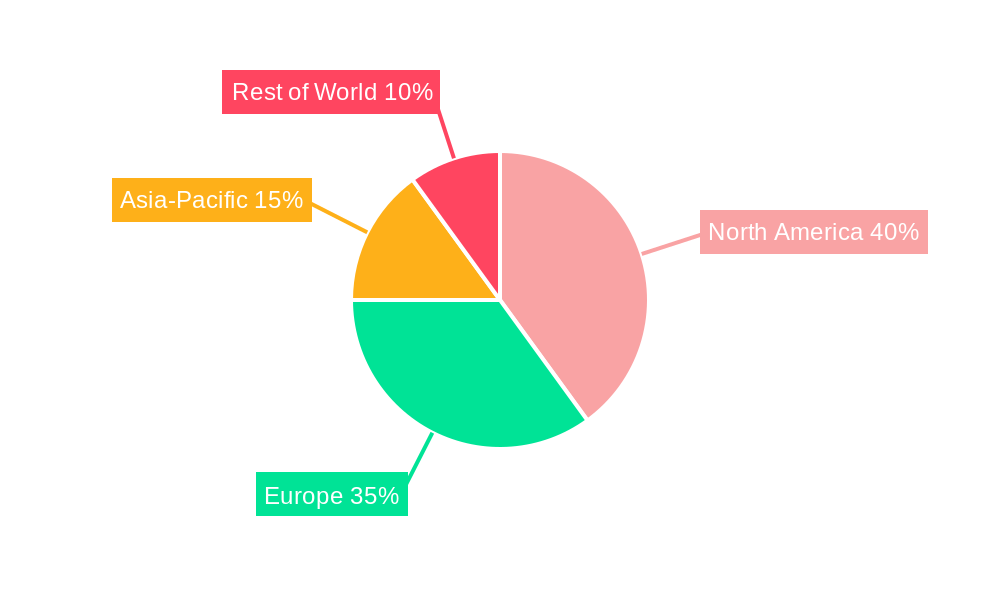
Dominant Regions, Countries, or Segments in ESG Investment Analytics Market
North America currently dominates the ESG Investment Analytics Market, driven by strong regulatory frameworks, high investor awareness, and the presence of major market players. Europe is also a significant market, exhibiting strong growth due to the implementation of the Sustainable Finance Disclosure Regulation (SFDR) and other related regulations. Asia-Pacific is emerging as a rapidly growing market, fueled by increasing government support for sustainable development and growing investor interest.
- North America: High market share (xx%) driven by established regulatory frameworks and a large base of institutional investors.
- Europe: Strong growth potential (xx% CAGR) due to increasing regulatory pressure and investor demand.
- Asia-Pacific: Rapidly expanding market (xx% CAGR) with significant untapped potential.
Key drivers in these regions include robust regulatory frameworks, favorable government policies, and the increasing adoption of ESG principles by businesses. Market dominance is determined by the concentration of institutional investors, the level of regulatory stringency, and the prevalence of advanced technology adoption.
ESG Investment Analytics Market Product Landscape
The ESG Investment Analytics market offers a range of products including data aggregation and analysis platforms, ESG risk assessment tools, portfolio management solutions, and reporting software. These products are characterized by increasing sophistication, integrating AI and machine learning to deliver more precise and actionable insights. Unique selling propositions focus on ease of use, data accuracy, comprehensive coverage, and advanced analytical capabilities. Technological advancements include improved data visualization, predictive modeling, and scenario analysis.
Key Drivers, Barriers & Challenges in ESG Investment Analytics Market
Key Drivers:
- Increasing regulatory pressure demanding ESG disclosures (e.g., SFDR, TCFD).
- Growing investor demand for ESG-integrated investment strategies.
- Technological advancements enabling more sophisticated data analysis.
Challenges & Restraints:
- Data inconsistency and lack of standardization across different sources.
- High implementation costs for sophisticated analytics solutions.
- Difficulty in accurately measuring and quantifying ESG impacts.
- Competition from established financial analytics providers.
Emerging Opportunities in ESG Investment Analytics Market
- Expansion into underserved markets (e.g., emerging economies).
- Development of specialized ESG analytics for specific sectors.
- Integration of ESG data into mainstream financial platforms.
- Increased demand for ESG data visualization and reporting tools.
Growth Accelerators in the ESG Investment Analytics Market Industry
Strategic partnerships between data providers, technology firms, and financial institutions are playing a significant role in accelerating market growth. Technological breakthroughs in AI and machine learning are enhancing data processing capabilities and driving the development of more sophisticated analytical tools. Furthermore, market expansion into new regions and sectors is expected to create significant growth opportunities.
Notable Milestones in ESG Investment Analytics Market Sector
- June 2023: ESG Book and Arcesium partnered to deliver market-leading sustainability data for institutional investors. This significantly enhances the availability and accessibility of high-quality ESG data.
- May 2023: Collective Artists Network partnered with DialESG to offer India's first comprehensive ESG solution, addressing a growing market need for ESG management in a key emerging economy.
In-Depth ESG Investment Analytics Market Market Outlook
The ESG Investment Analytics Market is poised for continued robust growth, driven by increasing regulatory pressures, growing investor demand, and technological innovation. The market's future potential is significant, with numerous opportunities for expansion into new markets, the development of specialized solutions, and further integration with mainstream financial systems. Strategic partnerships and technological advancements will play key roles in shaping the future landscape of the market.
ESG Investment Analytics Market Segmentation
-
1. Type
- 1.1. Addressing ESG Expectations
- 1.2. Preparing ESG Reports
-
2. Application
- 2.1. Financial Industry
- 2.2. Consumer and Retail
ESG Investment Analytics Market Segmentation By Geography
-
1. North America
- 1.1. United States
- 1.2. Canada
- 1.3. Rest of North America
-
2. Europe
- 2.1. Germany
- 2.2. United Kingdom
- 2.3. Russia
- 2.4. Rest of Europe
-
3. Asia Pacific
- 3.1. India
- 3.2. China
- 3.3. Japan
- 3.4. Rest of Asia Pacific
-
4. South America
- 4.1. Brazil
- 4.2. Argentina
- 4.3. Rest of South America
- 5. Middle East
-
6. United Arab Emirates
- 6.1. Saudi Arabia
- 6.2. South Africa
- 6.3. Rest of Middle East
ESG Investment Analytics Market Regional Market Share
Geographic Coverage of ESG Investment Analytics Market
ESG Investment Analytics Market REPORT HIGHLIGHTS
| Aspects | Details |
|---|---|
| Study Period | 2020-2034 |
| Base Year | 2025 |
| Estimated Year | 2026 |
| Forecast Period | 2026-2034 |
| Historical Period | 2020-2025 |
| Growth Rate | CAGR of 15.12% from 2020-2034 |
| Segmentation |
|
Table of Contents
- 1. Introduction
- 1.1. Research Scope
- 1.2. Market Segmentation
- 1.3. Research Objective
- 1.4. Definitions and Assumptions
- 2. Executive Summary
- 2.1. Market Snapshot
- 3. Market Dynamics
- 3.1. Market Drivers
- 3.2. Market Restrains
- 3.3. Market Trends
- 3.4. Market Opportunities
- 4. Market Factor Analysis
- 4.1. Porters Five Forces
- 4.1.1. Bargaining Power of Suppliers
- 4.1.2. Bargaining Power of Buyers
- 4.1.3. Threat of New Entrants
- 4.1.4. Threat of Substitutes
- 4.1.5. Competitive Rivalry
- 4.2. PESTEL analysis
- 4.3. BCG Analysis
- 4.3.1. Stars (High Growth, High Market Share)
- 4.3.2. Cash Cows (Low Growth, High Market Share)
- 4.3.3. Question Mark (High Growth, Low Market Share)
- 4.3.4. Dogs (Low Growth, Low Market Share)
- 4.4. Ansoff Matrix Analysis
- 4.5. Supply Chain Analysis
- 4.6. Regulatory Landscape
- 4.7. Current Market Potential and Opportunity Assessment (TAM–SAM–SOM Framework)
- 4.8. VDR Analyst Note
- 4.1. Porters Five Forces
- 5. Market Analysis, Insights and Forecast 2021-2033
- 5.1. Market Analysis, Insights and Forecast - by Type
- 5.1.1. Addressing ESG Expectations
- 5.1.2. Preparing ESG Reports
- 5.2. Market Analysis, Insights and Forecast - by Application
- 5.2.1. Financial Industry
- 5.2.2. Consumer and Retail
- 5.3. Market Analysis, Insights and Forecast - by Region
- 5.3.1. North America
- 5.3.2. Europe
- 5.3.3. Asia Pacific
- 5.3.4. South America
- 5.3.5. Middle East
- 5.3.6. United Arab Emirates
- 5.1. Market Analysis, Insights and Forecast - by Type
- 6. Global ESG Investment Analytics Market Analysis, Insights and Forecast, 2021-2033
- 6.1. Market Analysis, Insights and Forecast - by Type
- 6.1.1. Addressing ESG Expectations
- 6.1.2. Preparing ESG Reports
- 6.2. Market Analysis, Insights and Forecast - by Application
- 6.2.1. Financial Industry
- 6.2.2. Consumer and Retail
- 6.1. Market Analysis, Insights and Forecast - by Type
- 7. North America ESG Investment Analytics Market Analysis, Insights and Forecast, 2021-2033
- 7.1. Market Analysis, Insights and Forecast - by Type
- 7.1.1. Addressing ESG Expectations
- 7.1.2. Preparing ESG Reports
- 7.2. Market Analysis, Insights and Forecast - by Application
- 7.2.1. Financial Industry
- 7.2.2. Consumer and Retail
- 7.1. Market Analysis, Insights and Forecast - by Type
- 8. Europe ESG Investment Analytics Market Analysis, Insights and Forecast, 2021-2033
- 8.1. Market Analysis, Insights and Forecast - by Type
- 8.1.1. Addressing ESG Expectations
- 8.1.2. Preparing ESG Reports
- 8.2. Market Analysis, Insights and Forecast - by Application
- 8.2.1. Financial Industry
- 8.2.2. Consumer and Retail
- 8.1. Market Analysis, Insights and Forecast - by Type
- 9. Asia Pacific ESG Investment Analytics Market Analysis, Insights and Forecast, 2021-2033
- 9.1. Market Analysis, Insights and Forecast - by Type
- 9.1.1. Addressing ESG Expectations
- 9.1.2. Preparing ESG Reports
- 9.2. Market Analysis, Insights and Forecast - by Application
- 9.2.1. Financial Industry
- 9.2.2. Consumer and Retail
- 9.1. Market Analysis, Insights and Forecast - by Type
- 10. South America ESG Investment Analytics Market Analysis, Insights and Forecast, 2021-2033
- 10.1. Market Analysis, Insights and Forecast - by Type
- 10.1.1. Addressing ESG Expectations
- 10.1.2. Preparing ESG Reports
- 10.2. Market Analysis, Insights and Forecast - by Application
- 10.2.1. Financial Industry
- 10.2.2. Consumer and Retail
- 10.1. Market Analysis, Insights and Forecast - by Type
- 11. Middle East ESG Investment Analytics Market Analysis, Insights and Forecast, 2021-2033
- 11.1. Market Analysis, Insights and Forecast - by Type
- 11.1.1. Addressing ESG Expectations
- 11.1.2. Preparing ESG Reports
- 11.2. Market Analysis, Insights and Forecast - by Application
- 11.2.1. Financial Industry
- 11.2.2. Consumer and Retail
- 11.1. Market Analysis, Insights and Forecast - by Type
- 12. United Arab Emirates ESG Investment Analytics Market Analysis, Insights and Forecast, 2021-2033
- 12.1. Market Analysis, Insights and Forecast - by Type
- 12.1.1. Addressing ESG Expectations
- 12.1.2. Preparing ESG Reports
- 12.2. Market Analysis, Insights and Forecast - by Application
- 12.2.1. Financial Industry
- 12.2.2. Consumer and Retail
- 12.1. Market Analysis, Insights and Forecast - by Type
- 13. Competitive Analysis
- 13.1. Company Profiles
- 13.1.1 PWC
- 13.1.1.1. Company Overview
- 13.1.1.2. Products
- 13.1.1.3. Company Financials
- 13.1.1.4. SWOT Analysis
- 13.1.2 EY
- 13.1.2.1. Company Overview
- 13.1.2.2. Products
- 13.1.2.3. Company Financials
- 13.1.2.4. SWOT Analysis
- 13.1.3 Deloitte
- 13.1.3.1. Company Overview
- 13.1.3.2. Products
- 13.1.3.3. Company Financials
- 13.1.3.4. SWOT Analysis
- 13.1.4 KPMG
- 13.1.4.1. Company Overview
- 13.1.4.2. Products
- 13.1.4.3. Company Financials
- 13.1.4.4. SWOT Analysis
- 13.1.5 RSM Global
- 13.1.5.1. Company Overview
- 13.1.5.2. Products
- 13.1.5.3. Company Financials
- 13.1.5.4. SWOT Analysis
- 13.1.6 RPS Group
- 13.1.6.1. Company Overview
- 13.1.6.2. Products
- 13.1.6.3. Company Financials
- 13.1.6.4. SWOT Analysis
- 13.1.7 MSCI Inc
- 13.1.7.1. Company Overview
- 13.1.7.2. Products
- 13.1.7.3. Company Financials
- 13.1.7.4. SWOT Analysis
- 13.1.8 Crowe
- 13.1.8.1. Company Overview
- 13.1.8.2. Products
- 13.1.8.3. Company Financials
- 13.1.8.4. SWOT Analysis
- 13.1.9 RepRisk
- 13.1.9.1. Company Overview
- 13.1.9.2. Products
- 13.1.9.3. Company Financials
- 13.1.9.4. SWOT Analysis
- 13.1.10 ISS ESG
- 13.1.10.1. Company Overview
- 13.1.10.2. Products
- 13.1.10.3. Company Financials
- 13.1.10.4. SWOT Analysis
- 13.1.11 Kroll**List Not Exhaustive
- 13.1.11.1. Company Overview
- 13.1.11.2. Products
- 13.1.11.3. Company Financials
- 13.1.11.4. SWOT Analysis
- 13.1.1 PWC
- 13.2. Market Entropy
- 13.2.1 Company's Key Areas Served
- 13.2.2 Recent Developments
- 13.3. Company Market Share Analysis 2025
- 13.3.1 Top 5 Companies Market Share Analysis
- 13.3.2 Top 3 Companies Market Share Analysis
- 13.4. List of Potential Customers
- 14. Research Methodology
List of Figures
- Figure 1: Global ESG Investment Analytics Market Revenue Breakdown (Million, %) by Region 2025 & 2033
- Figure 2: Global ESG Investment Analytics Market Volume Breakdown (Billion, %) by Region 2025 & 2033
- Figure 3: North America ESG Investment Analytics Market Revenue (Million), by Type 2025 & 2033
- Figure 4: North America ESG Investment Analytics Market Volume (Billion), by Type 2025 & 2033
- Figure 5: North America ESG Investment Analytics Market Revenue Share (%), by Type 2025 & 2033
- Figure 6: North America ESG Investment Analytics Market Volume Share (%), by Type 2025 & 2033
- Figure 7: North America ESG Investment Analytics Market Revenue (Million), by Application 2025 & 2033
- Figure 8: North America ESG Investment Analytics Market Volume (Billion), by Application 2025 & 2033
- Figure 9: North America ESG Investment Analytics Market Revenue Share (%), by Application 2025 & 2033
- Figure 10: North America ESG Investment Analytics Market Volume Share (%), by Application 2025 & 2033
- Figure 11: North America ESG Investment Analytics Market Revenue (Million), by Country 2025 & 2033
- Figure 12: North America ESG Investment Analytics Market Volume (Billion), by Country 2025 & 2033
- Figure 13: North America ESG Investment Analytics Market Revenue Share (%), by Country 2025 & 2033
- Figure 14: North America ESG Investment Analytics Market Volume Share (%), by Country 2025 & 2033
- Figure 15: Europe ESG Investment Analytics Market Revenue (Million), by Type 2025 & 2033
- Figure 16: Europe ESG Investment Analytics Market Volume (Billion), by Type 2025 & 2033
- Figure 17: Europe ESG Investment Analytics Market Revenue Share (%), by Type 2025 & 2033
- Figure 18: Europe ESG Investment Analytics Market Volume Share (%), by Type 2025 & 2033
- Figure 19: Europe ESG Investment Analytics Market Revenue (Million), by Application 2025 & 2033
- Figure 20: Europe ESG Investment Analytics Market Volume (Billion), by Application 2025 & 2033
- Figure 21: Europe ESG Investment Analytics Market Revenue Share (%), by Application 2025 & 2033
- Figure 22: Europe ESG Investment Analytics Market Volume Share (%), by Application 2025 & 2033
- Figure 23: Europe ESG Investment Analytics Market Revenue (Million), by Country 2025 & 2033
- Figure 24: Europe ESG Investment Analytics Market Volume (Billion), by Country 2025 & 2033
- Figure 25: Europe ESG Investment Analytics Market Revenue Share (%), by Country 2025 & 2033
- Figure 26: Europe ESG Investment Analytics Market Volume Share (%), by Country 2025 & 2033
- Figure 27: Asia Pacific ESG Investment Analytics Market Revenue (Million), by Type 2025 & 2033
- Figure 28: Asia Pacific ESG Investment Analytics Market Volume (Billion), by Type 2025 & 2033
- Figure 29: Asia Pacific ESG Investment Analytics Market Revenue Share (%), by Type 2025 & 2033
- Figure 30: Asia Pacific ESG Investment Analytics Market Volume Share (%), by Type 2025 & 2033
- Figure 31: Asia Pacific ESG Investment Analytics Market Revenue (Million), by Application 2025 & 2033
- Figure 32: Asia Pacific ESG Investment Analytics Market Volume (Billion), by Application 2025 & 2033
- Figure 33: Asia Pacific ESG Investment Analytics Market Revenue Share (%), by Application 2025 & 2033
- Figure 34: Asia Pacific ESG Investment Analytics Market Volume Share (%), by Application 2025 & 2033
- Figure 35: Asia Pacific ESG Investment Analytics Market Revenue (Million), by Country 2025 & 2033
- Figure 36: Asia Pacific ESG Investment Analytics Market Volume (Billion), by Country 2025 & 2033
- Figure 37: Asia Pacific ESG Investment Analytics Market Revenue Share (%), by Country 2025 & 2033
- Figure 38: Asia Pacific ESG Investment Analytics Market Volume Share (%), by Country 2025 & 2033
- Figure 39: South America ESG Investment Analytics Market Revenue (Million), by Type 2025 & 2033
- Figure 40: South America ESG Investment Analytics Market Volume (Billion), by Type 2025 & 2033
- Figure 41: South America ESG Investment Analytics Market Revenue Share (%), by Type 2025 & 2033
- Figure 42: South America ESG Investment Analytics Market Volume Share (%), by Type 2025 & 2033
- Figure 43: South America ESG Investment Analytics Market Revenue (Million), by Application 2025 & 2033
- Figure 44: South America ESG Investment Analytics Market Volume (Billion), by Application 2025 & 2033
- Figure 45: South America ESG Investment Analytics Market Revenue Share (%), by Application 2025 & 2033
- Figure 46: South America ESG Investment Analytics Market Volume Share (%), by Application 2025 & 2033
- Figure 47: South America ESG Investment Analytics Market Revenue (Million), by Country 2025 & 2033
- Figure 48: South America ESG Investment Analytics Market Volume (Billion), by Country 2025 & 2033
- Figure 49: South America ESG Investment Analytics Market Revenue Share (%), by Country 2025 & 2033
- Figure 50: South America ESG Investment Analytics Market Volume Share (%), by Country 2025 & 2033
- Figure 51: Middle East ESG Investment Analytics Market Revenue (Million), by Type 2025 & 2033
- Figure 52: Middle East ESG Investment Analytics Market Volume (Billion), by Type 2025 & 2033
- Figure 53: Middle East ESG Investment Analytics Market Revenue Share (%), by Type 2025 & 2033
- Figure 54: Middle East ESG Investment Analytics Market Volume Share (%), by Type 2025 & 2033
- Figure 55: Middle East ESG Investment Analytics Market Revenue (Million), by Application 2025 & 2033
- Figure 56: Middle East ESG Investment Analytics Market Volume (Billion), by Application 2025 & 2033
- Figure 57: Middle East ESG Investment Analytics Market Revenue Share (%), by Application 2025 & 2033
- Figure 58: Middle East ESG Investment Analytics Market Volume Share (%), by Application 2025 & 2033
- Figure 59: Middle East ESG Investment Analytics Market Revenue (Million), by Country 2025 & 2033
- Figure 60: Middle East ESG Investment Analytics Market Volume (Billion), by Country 2025 & 2033
- Figure 61: Middle East ESG Investment Analytics Market Revenue Share (%), by Country 2025 & 2033
- Figure 62: Middle East ESG Investment Analytics Market Volume Share (%), by Country 2025 & 2033
- Figure 63: United Arab Emirates ESG Investment Analytics Market Revenue (Million), by Type 2025 & 2033
- Figure 64: United Arab Emirates ESG Investment Analytics Market Volume (Billion), by Type 2025 & 2033
- Figure 65: United Arab Emirates ESG Investment Analytics Market Revenue Share (%), by Type 2025 & 2033
- Figure 66: United Arab Emirates ESG Investment Analytics Market Volume Share (%), by Type 2025 & 2033
- Figure 67: United Arab Emirates ESG Investment Analytics Market Revenue (Million), by Application 2025 & 2033
- Figure 68: United Arab Emirates ESG Investment Analytics Market Volume (Billion), by Application 2025 & 2033
- Figure 69: United Arab Emirates ESG Investment Analytics Market Revenue Share (%), by Application 2025 & 2033
- Figure 70: United Arab Emirates ESG Investment Analytics Market Volume Share (%), by Application 2025 & 2033
- Figure 71: United Arab Emirates ESG Investment Analytics Market Revenue (Million), by Country 2025 & 2033
- Figure 72: United Arab Emirates ESG Investment Analytics Market Volume (Billion), by Country 2025 & 2033
- Figure 73: United Arab Emirates ESG Investment Analytics Market Revenue Share (%), by Country 2025 & 2033
- Figure 74: United Arab Emirates ESG Investment Analytics Market Volume Share (%), by Country 2025 & 2033
List of Tables
- Table 1: Global ESG Investment Analytics Market Revenue Million Forecast, by Type 2020 & 2033
- Table 2: Global ESG Investment Analytics Market Volume Billion Forecast, by Type 2020 & 2033
- Table 3: Global ESG Investment Analytics Market Revenue Million Forecast, by Application 2020 & 2033
- Table 4: Global ESG Investment Analytics Market Volume Billion Forecast, by Application 2020 & 2033
- Table 5: Global ESG Investment Analytics Market Revenue Million Forecast, by Region 2020 & 2033
- Table 6: Global ESG Investment Analytics Market Volume Billion Forecast, by Region 2020 & 2033
- Table 7: Global ESG Investment Analytics Market Revenue Million Forecast, by Type 2020 & 2033
- Table 8: Global ESG Investment Analytics Market Volume Billion Forecast, by Type 2020 & 2033
- Table 9: Global ESG Investment Analytics Market Revenue Million Forecast, by Application 2020 & 2033
- Table 10: Global ESG Investment Analytics Market Volume Billion Forecast, by Application 2020 & 2033
- Table 11: Global ESG Investment Analytics Market Revenue Million Forecast, by Country 2020 & 2033
- Table 12: Global ESG Investment Analytics Market Volume Billion Forecast, by Country 2020 & 2033
- Table 13: United States ESG Investment Analytics Market Revenue (Million) Forecast, by Application 2020 & 2033
- Table 14: United States ESG Investment Analytics Market Volume (Billion) Forecast, by Application 2020 & 2033
- Table 15: Canada ESG Investment Analytics Market Revenue (Million) Forecast, by Application 2020 & 2033
- Table 16: Canada ESG Investment Analytics Market Volume (Billion) Forecast, by Application 2020 & 2033
- Table 17: Rest of North America ESG Investment Analytics Market Revenue (Million) Forecast, by Application 2020 & 2033
- Table 18: Rest of North America ESG Investment Analytics Market Volume (Billion) Forecast, by Application 2020 & 2033
- Table 19: Global ESG Investment Analytics Market Revenue Million Forecast, by Type 2020 & 2033
- Table 20: Global ESG Investment Analytics Market Volume Billion Forecast, by Type 2020 & 2033
- Table 21: Global ESG Investment Analytics Market Revenue Million Forecast, by Application 2020 & 2033
- Table 22: Global ESG Investment Analytics Market Volume Billion Forecast, by Application 2020 & 2033
- Table 23: Global ESG Investment Analytics Market Revenue Million Forecast, by Country 2020 & 2033
- Table 24: Global ESG Investment Analytics Market Volume Billion Forecast, by Country 2020 & 2033
- Table 25: Germany ESG Investment Analytics Market Revenue (Million) Forecast, by Application 2020 & 2033
- Table 26: Germany ESG Investment Analytics Market Volume (Billion) Forecast, by Application 2020 & 2033
- Table 27: United Kingdom ESG Investment Analytics Market Revenue (Million) Forecast, by Application 2020 & 2033
- Table 28: United Kingdom ESG Investment Analytics Market Volume (Billion) Forecast, by Application 2020 & 2033
- Table 29: Russia ESG Investment Analytics Market Revenue (Million) Forecast, by Application 2020 & 2033
- Table 30: Russia ESG Investment Analytics Market Volume (Billion) Forecast, by Application 2020 & 2033
- Table 31: Rest of Europe ESG Investment Analytics Market Revenue (Million) Forecast, by Application 2020 & 2033
- Table 32: Rest of Europe ESG Investment Analytics Market Volume (Billion) Forecast, by Application 2020 & 2033
- Table 33: Global ESG Investment Analytics Market Revenue Million Forecast, by Type 2020 & 2033
- Table 34: Global ESG Investment Analytics Market Volume Billion Forecast, by Type 2020 & 2033
- Table 35: Global ESG Investment Analytics Market Revenue Million Forecast, by Application 2020 & 2033
- Table 36: Global ESG Investment Analytics Market Volume Billion Forecast, by Application 2020 & 2033
- Table 37: Global ESG Investment Analytics Market Revenue Million Forecast, by Country 2020 & 2033
- Table 38: Global ESG Investment Analytics Market Volume Billion Forecast, by Country 2020 & 2033
- Table 39: India ESG Investment Analytics Market Revenue (Million) Forecast, by Application 2020 & 2033
- Table 40: India ESG Investment Analytics Market Volume (Billion) Forecast, by Application 2020 & 2033
- Table 41: China ESG Investment Analytics Market Revenue (Million) Forecast, by Application 2020 & 2033
- Table 42: China ESG Investment Analytics Market Volume (Billion) Forecast, by Application 2020 & 2033
- Table 43: Japan ESG Investment Analytics Market Revenue (Million) Forecast, by Application 2020 & 2033
- Table 44: Japan ESG Investment Analytics Market Volume (Billion) Forecast, by Application 2020 & 2033
- Table 45: Rest of Asia Pacific ESG Investment Analytics Market Revenue (Million) Forecast, by Application 2020 & 2033
- Table 46: Rest of Asia Pacific ESG Investment Analytics Market Volume (Billion) Forecast, by Application 2020 & 2033
- Table 47: Global ESG Investment Analytics Market Revenue Million Forecast, by Type 2020 & 2033
- Table 48: Global ESG Investment Analytics Market Volume Billion Forecast, by Type 2020 & 2033
- Table 49: Global ESG Investment Analytics Market Revenue Million Forecast, by Application 2020 & 2033
- Table 50: Global ESG Investment Analytics Market Volume Billion Forecast, by Application 2020 & 2033
- Table 51: Global ESG Investment Analytics Market Revenue Million Forecast, by Country 2020 & 2033
- Table 52: Global ESG Investment Analytics Market Volume Billion Forecast, by Country 2020 & 2033
- Table 53: Brazil ESG Investment Analytics Market Revenue (Million) Forecast, by Application 2020 & 2033
- Table 54: Brazil ESG Investment Analytics Market Volume (Billion) Forecast, by Application 2020 & 2033
- Table 55: Argentina ESG Investment Analytics Market Revenue (Million) Forecast, by Application 2020 & 2033
- Table 56: Argentina ESG Investment Analytics Market Volume (Billion) Forecast, by Application 2020 & 2033
- Table 57: Rest of South America ESG Investment Analytics Market Revenue (Million) Forecast, by Application 2020 & 2033
- Table 58: Rest of South America ESG Investment Analytics Market Volume (Billion) Forecast, by Application 2020 & 2033
- Table 59: Global ESG Investment Analytics Market Revenue Million Forecast, by Type 2020 & 2033
- Table 60: Global ESG Investment Analytics Market Volume Billion Forecast, by Type 2020 & 2033
- Table 61: Global ESG Investment Analytics Market Revenue Million Forecast, by Application 2020 & 2033
- Table 62: Global ESG Investment Analytics Market Volume Billion Forecast, by Application 2020 & 2033
- Table 63: Global ESG Investment Analytics Market Revenue Million Forecast, by Country 2020 & 2033
- Table 64: Global ESG Investment Analytics Market Volume Billion Forecast, by Country 2020 & 2033
- Table 65: Global ESG Investment Analytics Market Revenue Million Forecast, by Type 2020 & 2033
- Table 66: Global ESG Investment Analytics Market Volume Billion Forecast, by Type 2020 & 2033
- Table 67: Global ESG Investment Analytics Market Revenue Million Forecast, by Application 2020 & 2033
- Table 68: Global ESG Investment Analytics Market Volume Billion Forecast, by Application 2020 & 2033
- Table 69: Global ESG Investment Analytics Market Revenue Million Forecast, by Country 2020 & 2033
- Table 70: Global ESG Investment Analytics Market Volume Billion Forecast, by Country 2020 & 2033
- Table 71: Saudi Arabia ESG Investment Analytics Market Revenue (Million) Forecast, by Application 2020 & 2033
- Table 72: Saudi Arabia ESG Investment Analytics Market Volume (Billion) Forecast, by Application 2020 & 2033
- Table 73: South Africa ESG Investment Analytics Market Revenue (Million) Forecast, by Application 2020 & 2033
- Table 74: South Africa ESG Investment Analytics Market Volume (Billion) Forecast, by Application 2020 & 2033
- Table 75: Rest of Middle East ESG Investment Analytics Market Revenue (Million) Forecast, by Application 2020 & 2033
- Table 76: Rest of Middle East ESG Investment Analytics Market Volume (Billion) Forecast, by Application 2020 & 2033
Frequently Asked Questions
1. What is the projected Compound Annual Growth Rate (CAGR) of the ESG Investment Analytics Market?
The projected CAGR is approximately 15.12%.
2. Which companies are prominent players in the ESG Investment Analytics Market?
Key companies in the market include PWC, EY, Deloitte, KPMG, RSM Global, RPS Group, MSCI Inc, Crowe, RepRisk, ISS ESG, Kroll**List Not Exhaustive.
3. What are the main segments of the ESG Investment Analytics Market?
The market segments include Type, Application.
4. Can you provide details about the market size?
The market size is estimated to be USD 1.60 Million as of 2022.
5. What are some drivers contributing to market growth?
Increased Focus on Corporate Social Responsibility.
6. What are the notable trends driving market growth?
Increasing Consumer and Retail Fueling the Market.
7. Are there any restraints impacting market growth?
Increased Focus on Corporate Social Responsibility.
8. Can you provide examples of recent developments in the market?
June 2023: ESG Book, a global leader, and Arcesium, a leading global financial technology firm, announced a new partnership to deliver market-leading sustainability data for institutional investors.
9. What pricing options are available for accessing the report?
Pricing options include single-user, multi-user, and enterprise licenses priced at USD 4750, USD 5250, and USD 8750 respectively.
10. Is the market size provided in terms of value or volume?
The market size is provided in terms of value, measured in Million and volume, measured in Billion.
11. Are there any specific market keywords associated with the report?
Yes, the market keyword associated with the report is "ESG Investment Analytics Market," which aids in identifying and referencing the specific market segment covered.
12. How do I determine which pricing option suits my needs best?
The pricing options vary based on user requirements and access needs. Individual users may opt for single-user licenses, while businesses requiring broader access may choose multi-user or enterprise licenses for cost-effective access to the report.
13. Are there any additional resources or data provided in the ESG Investment Analytics Market report?
While the report offers comprehensive insights, it's advisable to review the specific contents or supplementary materials provided to ascertain if additional resources or data are available.
14. How can I stay updated on further developments or reports in the ESG Investment Analytics Market?
To stay informed about further developments, trends, and reports in the ESG Investment Analytics Market, consider subscribing to industry newsletters, following relevant companies and organizations, or regularly checking reputable industry news sources and publications.
Methodology
Step 1 - Identification of Relevant Samples Size from Population Database


Step 2 - Approaches for Defining Global Market Size (Value, Volume* & Price*)

Note*: In applicable scenarios
Step 3 - Data Sources
Primary Research
- Web Analytics
- Survey Reports
- Research Institute
- Latest Research Reports
- Opinion Leaders
Secondary Research
- Annual Reports
- White Paper
- Latest Press Release
- Industry Association
- Paid Database
- Investor Presentations

Step 4 - Data Triangulation
Involves using different sources of information in order to increase the validity of a study
These sources are likely to be stakeholders in a program - participants, other researchers, program staff, other community members, and so on.
Then we put all data in single framework & apply various statistical tools to find out the dynamic on the market.
During the analysis stage, feedback from the stakeholder groups would be compared to determine areas of agreement as well as areas of divergence