
Key Insights
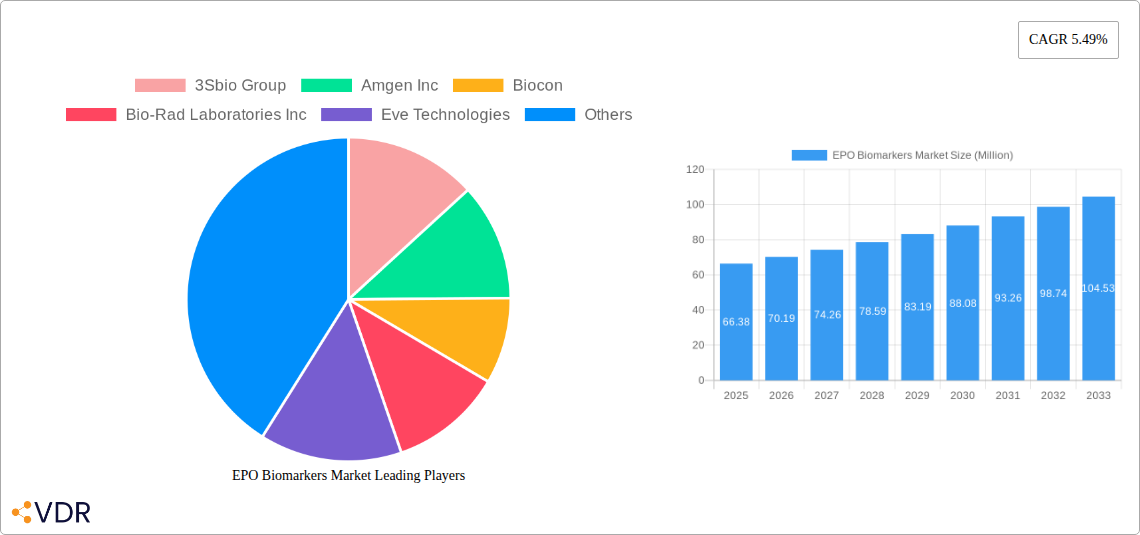
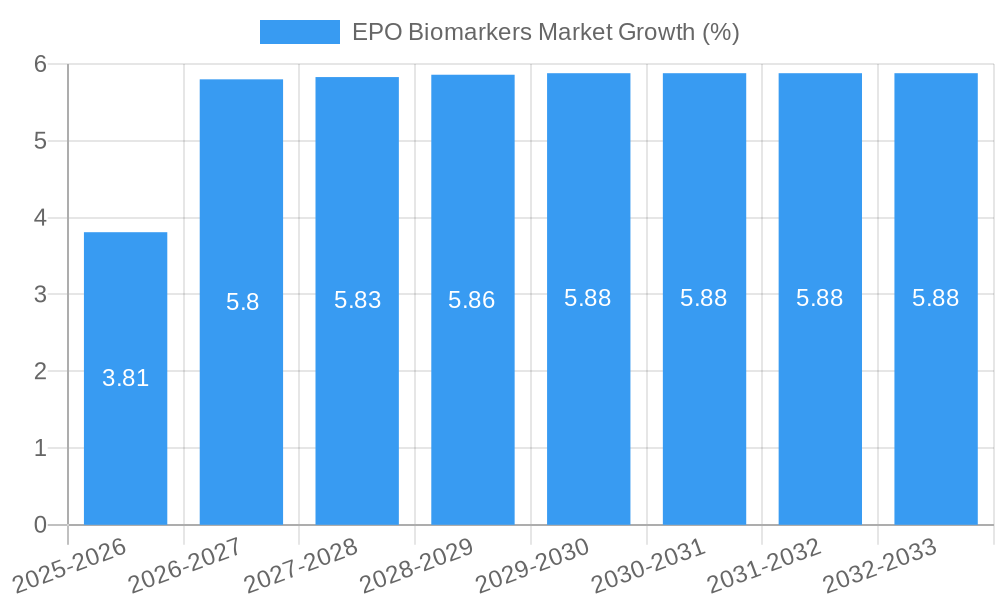
The EPO Biomarkers market, valued at $66.38 million in 2025, is projected to experience robust growth, driven by increasing prevalence of anemia and related diseases, advancements in diagnostic technologies, and rising demand for personalized medicine. The market's Compound Annual Growth Rate (CAGR) of 5.49% from 2019 to 2024 indicates a steady expansion, suggesting continued momentum through the forecast period (2025-2033). Key drivers include the growing adoption of EPO biomarkers in clinical trials for evaluating the efficacy of erythropoiesis-stimulating agents (ESAs) and the development of novel biomarkers for improved diagnosis and treatment monitoring. Furthermore, the rising investments in research and development by pharmaceutical and biotechnology companies are fueling innovation in this space. While potential regulatory hurdles and high costs associated with advanced diagnostic techniques could pose some restraints, the overall market outlook remains positive, supported by the expanding application of EPO biomarkers across various therapeutic areas, including oncology and nephrology.
The competitive landscape is characterized by a mix of large multinational corporations like Amgen, Roche, and Pfizer, alongside smaller specialized biotechnology companies like 3Sbio and Biocon. These companies are actively engaged in developing and commercializing advanced EPO biomarker assays and related diagnostic tools. Market segmentation likely includes different assay types (ELISA, etc.), applications (diagnosis, treatment monitoring), and end-users (hospitals, research institutions). Regional variations in healthcare infrastructure and disease prevalence will contribute to differing market growth rates across North America, Europe, Asia-Pacific, and other regions. The market is expected to witness consolidation through mergers and acquisitions as companies strive to enhance their product portfolios and market share in this expanding field. Future growth is closely linked to continued technological advancements, improved assay sensitivity and specificity, and the growing understanding of the role of EPO biomarkers in disease pathogenesis.
EPO Biomarkers Market: A Comprehensive Report (2019-2033)
This in-depth report provides a comprehensive analysis of the EPO Biomarkers market, encompassing market dynamics, growth trends, regional insights, product landscape, key players, and future outlook. The study period covers 2019-2033, with 2025 as the base and estimated year. The report is crucial for industry professionals, investors, and researchers seeking a nuanced understanding of this vital sector within the broader hematology diagnostics market (parent market) and the more specific anemia diagnostics market (child market). The market is projected to reach xx Million by 2033.
EPO Biomarkers Market Dynamics & Structure
The EPO Biomarkers market is characterized by a moderately concentrated landscape, with key players like Amgen Inc, F Hoffmann-La Roche Ltd, and Pfizer Inc holding significant market share. Technological advancements, particularly in high-throughput screening and advanced diagnostic assays, are key drivers. Stringent regulatory frameworks, especially concerning clinical trial approvals and product safety, significantly influence market growth. The presence of competitive substitutes, such as alternative anemia treatments, poses a challenge. The market is predominantly driven by the growing prevalence of chronic kidney disease (CKD) and associated anemia, particularly in aging populations. M&A activity has been moderate, with a xx number of deals recorded between 2019 and 2024.
- Market Concentration: Moderately concentrated, with top 5 players holding approximately xx% market share.
- Technological Innovation: Rapid advancements in ELISA, Mass Spectrometry, and other diagnostic technologies.
- Regulatory Landscape: Stringent FDA and EMA approvals impacting market entry and product lifecycle.
- Competitive Substitutes: Alternative anemia treatments influence market penetration.
- End-User Demographics: Primarily hospitals, diagnostic labs, and research institutions.
- M&A Trends: xx M&A deals in 2019-2024, indicating a moderate level of consolidation. Innovation barriers are primarily associated with the high cost of R&D and complex regulatory pathways.
EPO Biomarkers Market Growth Trends & Insights
The EPO Biomarkers market experienced steady growth between 2019 and 2024, with a CAGR of xx%. This growth is primarily attributed to the rising prevalence of CKD, an aging global population, and increasing awareness of early anemia diagnosis. Technological advancements leading to improved assay sensitivity and specificity contribute to increased adoption rates. Consumer behavior shifts towards proactive healthcare and personalized medicine are influencing market demand. Market penetration is estimated at xx% in 2025, with further growth expected in the forecast period (2025-2033), driven by expanding diagnostic capabilities and the introduction of novel biomarkers. The market is anticipated to witness a CAGR of xx% during the forecast period.
Dominant Regions, Countries, or Segments in EPO Biomarkers Market
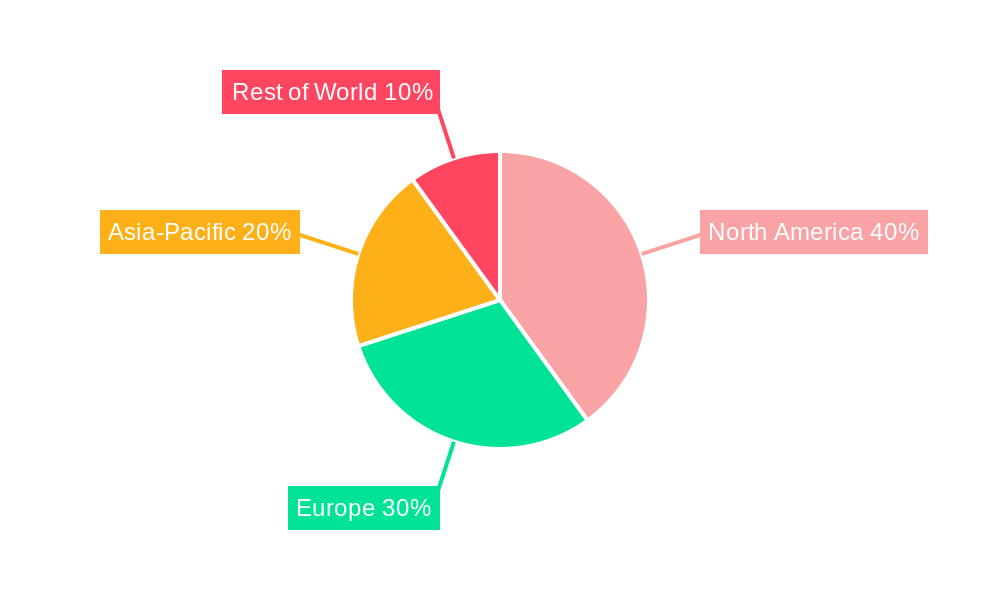
North America currently holds the largest market share, primarily due to advanced healthcare infrastructure, high healthcare expenditure, and early adoption of advanced diagnostic technologies. Europe follows closely, while Asia-Pacific is projected to witness the fastest growth during the forecast period due to rising healthcare spending, increasing prevalence of CKD, and growing awareness of diagnostic tools. Specific countries like the U.S., Germany, Japan, and China are key contributors to market growth.
- North America: High healthcare expenditure, advanced infrastructure, and early adoption of new technologies.
- Europe: Well-established healthcare systems and a sizeable aging population.
- Asia-Pacific: Rapidly growing healthcare sector, increasing prevalence of CKD, and rising disposable incomes.
- Market Share: North America (xx%), Europe (xx%), Asia-Pacific (xx%), Rest of the World (xx%) in 2025.
- Growth Potential: Asia-Pacific projected to exhibit the highest growth rate.
EPO Biomarkers Market Product Landscape
The EPO Biomarkers market offers a range of products, including ELISA kits, Mass Spectrometry-based assays, and other advanced diagnostic tools. These products provide accurate and rapid detection of various EPO biomarkers, aiding in early diagnosis and personalized treatment of anemia. Unique selling propositions include improved sensitivity, specificity, and ease of use compared to traditional methods. Recent technological advancements focus on multiplex assays for simultaneous detection of multiple biomarkers.
Key Drivers, Barriers & Challenges in EPO Biomarkers Market
Key Drivers:
- Rising prevalence of chronic kidney disease and associated anemia.
- Increasing awareness among healthcare professionals and patients.
- Technological advancements leading to improved diagnostic tools.
- Growing demand for early diagnosis and personalized medicine.
Key Challenges:
- High cost of advanced diagnostic assays.
- Stringent regulatory requirements for approval and market access.
- Competition from alternative anemia treatment modalities.
- Supply chain disruptions affecting the availability of reagents and consumables. This led to a xx% increase in prices in 2023.
Emerging Opportunities in EPO Biomarkers Market
- Untapped markets in developing countries with high CKD prevalence.
- Development of point-of-care diagnostics for rapid testing.
- Integration of EPO biomarkers with other diagnostic tools for comprehensive patient assessment.
- Application of Artificial intelligence and machine learning for improved diagnostics and treatment prediction.
Growth Accelerators in the EPO Biomarkers Market Industry
Technological advancements, strategic partnerships between diagnostic companies and pharmaceutical firms, and expansion into emerging markets are key growth accelerators. The development of novel biomarkers with improved diagnostic performance will play a crucial role in market expansion. The strategic alliances enabling wider access to diagnostic tools will increase the market penetration.
Key Players Shaping the EPO Biomarkers Market Market
- 3Sbio Group
- Amgen Inc
- Biocon
- Bio-Rad Laboratories Inc
- Eve Technologies
- F Hoffmann-La Roche Ltd
- Merck KGaA
- Pfizer Inc
- Siemens Healthineers AG
- Kyowa Kirin Co Ltd
- GenScript
- Bioagilytix Labs *List Not Exhaustive
Notable Milestones in EPO Biomarkers Market Sector
- October 2023: Genexine and KGbio received BPOM approval for Epoetin alfa for treating CKD-induced anemia in non-dialysis patients. This expands treatment options and potentially increases market demand.
- March 2024: CSL Vifor and Akebia Therapeutics received FDA approval for Vafseo (vadadustat) for treating anemia in dialysis patients. This represents a significant advancement in CKD anemia treatment, potentially impacting the landscape of biomarker testing.
In-Depth EPO Biomarkers Market Market Outlook
The EPO Biomarkers market is poised for robust growth in the coming years, driven by factors discussed above. Strategic partnerships, technological advancements, and expanding application of EPO biomarkers in personalized medicine will contribute to increased market penetration and substantial market expansion. The focus on improved diagnostics and treatment strategies offers significant opportunities for market players. The market is projected to exhibit considerable growth, presenting attractive opportunities for investment and innovation.
EPO Biomarkers Market Segmentation
-
1. Type
- 1.1. Erythropoietin Alfa
- 1.2. Erythropoietin Beta
- 1.3. Erythropoietin Zeta
- 1.4. Erythropoietin Theta
- 1.5. Other Types
-
2. Application
- 2.1. Renal Disorder
- 2.2. Cancer
- 2.3. Acquired Immunodeficiency Sydnrome (AIDSs)
- 2.4. Anemia of Chronic Inflammatory Syndromes
- 2.5. Other Applications
EPO Biomarkers Market Segmentation By Geography
-
1. North America
- 1.1. United States
- 1.2. Canada
- 1.3. Mexico
-
2. Europe
- 2.1. Germany
- 2.2. United Kingdom
- 2.3. France
- 2.4. Italy
- 2.5. Spain
- 2.6. Rest of Europe
-
3. Asia Pacific
- 3.1. China
- 3.2. Japan
- 3.3. India
- 3.4. Australia
- 3.5. South Korea
- 3.6. Rest of Asia Pacific
-
4. Middle East and Africa
- 4.1. GCC
- 4.2. South Africa
- 4.3. Rest of Middle East and Africa
-
5. South America
- 5.1. Brazil
- 5.2. Argentina
- 5.3. Rest of South America
EPO Biomarkers Market REPORT HIGHLIGHTS
| Aspects | Details |
|---|---|
| Study Period | 2019-2033 |
| Base Year | 2024 |
| Estimated Year | 2025 |
| Forecast Period | 2025-2033 |
| Historical Period | 2019-2024 |
| Growth Rate | CAGR of 5.49% from 2019-2033 |
| Segmentation |
|
Table of Contents
- 1. Introduction
- 1.1. Research Scope
- 1.2. Market Segmentation
- 1.3. Research Methodology
- 1.4. Definitions and Assumptions
- 2. Executive Summary
- 2.1. Introduction
- 3. Market Dynamics
- 3.1. Introduction
- 3.2. Market Drivers
- 3.2.1. Increasing Prevalence of Cancer and End-Stage Renal Disease (ESRD); Favorable Healthcare Regulations In Developed Economies; Increasing Research and Development in EPO Biomarker Technology
- 3.3. Market Restrains
- 3.3.1. Increasing Prevalence of Cancer and End-Stage Renal Disease (ESRD); Favorable Healthcare Regulations In Developed Economies; Increasing Research and Development in EPO Biomarker Technology
- 3.4. Market Trends
- 3.4.1. The Cancer Segment by Application is Expected Witness Significant Growth During the Forecast Period
- 4. Market Factor Analysis
- 4.1. Porters Five Forces
- 4.2. Supply/Value Chain
- 4.3. PESTEL analysis
- 4.4. Market Entropy
- 4.5. Patent/Trademark Analysis
- 5. Global EPO Biomarkers Market Analysis, Insights and Forecast, 2019-2031
- 5.1. Market Analysis, Insights and Forecast - by Type
- 5.1.1. Erythropoietin Alfa
- 5.1.2. Erythropoietin Beta
- 5.1.3. Erythropoietin Zeta
- 5.1.4. Erythropoietin Theta
- 5.1.5. Other Types
- 5.2. Market Analysis, Insights and Forecast - by Application
- 5.2.1. Renal Disorder
- 5.2.2. Cancer
- 5.2.3. Acquired Immunodeficiency Sydnrome (AIDSs)
- 5.2.4. Anemia of Chronic Inflammatory Syndromes
- 5.2.5. Other Applications
- 5.3. Market Analysis, Insights and Forecast - by Region
- 5.3.1. North America
- 5.3.2. Europe
- 5.3.3. Asia Pacific
- 5.3.4. Middle East and Africa
- 5.3.5. South America
- 5.1. Market Analysis, Insights and Forecast - by Type
- 6. North America EPO Biomarkers Market Analysis, Insights and Forecast, 2019-2031
- 6.1. Market Analysis, Insights and Forecast - by Type
- 6.1.1. Erythropoietin Alfa
- 6.1.2. Erythropoietin Beta
- 6.1.3. Erythropoietin Zeta
- 6.1.4. Erythropoietin Theta
- 6.1.5. Other Types
- 6.2. Market Analysis, Insights and Forecast - by Application
- 6.2.1. Renal Disorder
- 6.2.2. Cancer
- 6.2.3. Acquired Immunodeficiency Sydnrome (AIDSs)
- 6.2.4. Anemia of Chronic Inflammatory Syndromes
- 6.2.5. Other Applications
- 6.1. Market Analysis, Insights and Forecast - by Type
- 7. Europe EPO Biomarkers Market Analysis, Insights and Forecast, 2019-2031
- 7.1. Market Analysis, Insights and Forecast - by Type
- 7.1.1. Erythropoietin Alfa
- 7.1.2. Erythropoietin Beta
- 7.1.3. Erythropoietin Zeta
- 7.1.4. Erythropoietin Theta
- 7.1.5. Other Types
- 7.2. Market Analysis, Insights and Forecast - by Application
- 7.2.1. Renal Disorder
- 7.2.2. Cancer
- 7.2.3. Acquired Immunodeficiency Sydnrome (AIDSs)
- 7.2.4. Anemia of Chronic Inflammatory Syndromes
- 7.2.5. Other Applications
- 7.1. Market Analysis, Insights and Forecast - by Type
- 8. Asia Pacific EPO Biomarkers Market Analysis, Insights and Forecast, 2019-2031
- 8.1. Market Analysis, Insights and Forecast - by Type
- 8.1.1. Erythropoietin Alfa
- 8.1.2. Erythropoietin Beta
- 8.1.3. Erythropoietin Zeta
- 8.1.4. Erythropoietin Theta
- 8.1.5. Other Types
- 8.2. Market Analysis, Insights and Forecast - by Application
- 8.2.1. Renal Disorder
- 8.2.2. Cancer
- 8.2.3. Acquired Immunodeficiency Sydnrome (AIDSs)
- 8.2.4. Anemia of Chronic Inflammatory Syndromes
- 8.2.5. Other Applications
- 8.1. Market Analysis, Insights and Forecast - by Type
- 9. Middle East and Africa EPO Biomarkers Market Analysis, Insights and Forecast, 2019-2031
- 9.1. Market Analysis, Insights and Forecast - by Type
- 9.1.1. Erythropoietin Alfa
- 9.1.2. Erythropoietin Beta
- 9.1.3. Erythropoietin Zeta
- 9.1.4. Erythropoietin Theta
- 9.1.5. Other Types
- 9.2. Market Analysis, Insights and Forecast - by Application
- 9.2.1. Renal Disorder
- 9.2.2. Cancer
- 9.2.3. Acquired Immunodeficiency Sydnrome (AIDSs)
- 9.2.4. Anemia of Chronic Inflammatory Syndromes
- 9.2.5. Other Applications
- 9.1. Market Analysis, Insights and Forecast - by Type
- 10. South America EPO Biomarkers Market Analysis, Insights and Forecast, 2019-2031
- 10.1. Market Analysis, Insights and Forecast - by Type
- 10.1.1. Erythropoietin Alfa
- 10.1.2. Erythropoietin Beta
- 10.1.3. Erythropoietin Zeta
- 10.1.4. Erythropoietin Theta
- 10.1.5. Other Types
- 10.2. Market Analysis, Insights and Forecast - by Application
- 10.2.1. Renal Disorder
- 10.2.2. Cancer
- 10.2.3. Acquired Immunodeficiency Sydnrome (AIDSs)
- 10.2.4. Anemia of Chronic Inflammatory Syndromes
- 10.2.5. Other Applications
- 10.1. Market Analysis, Insights and Forecast - by Type
- 11. Competitive Analysis
- 11.1. Global Market Share Analysis 2024
- 11.2. Company Profiles
- 11.2.1 3Sbio Group
- 11.2.1.1. Overview
- 11.2.1.2. Products
- 11.2.1.3. SWOT Analysis
- 11.2.1.4. Recent Developments
- 11.2.1.5. Financials (Based on Availability)
- 11.2.2 Amgen Inc
- 11.2.2.1. Overview
- 11.2.2.2. Products
- 11.2.2.3. SWOT Analysis
- 11.2.2.4. Recent Developments
- 11.2.2.5. Financials (Based on Availability)
- 11.2.3 Biocon
- 11.2.3.1. Overview
- 11.2.3.2. Products
- 11.2.3.3. SWOT Analysis
- 11.2.3.4. Recent Developments
- 11.2.3.5. Financials (Based on Availability)
- 11.2.4 Bio-Rad Laboratories Inc
- 11.2.4.1. Overview
- 11.2.4.2. Products
- 11.2.4.3. SWOT Analysis
- 11.2.4.4. Recent Developments
- 11.2.4.5. Financials (Based on Availability)
- 11.2.5 Eve Technologies
- 11.2.5.1. Overview
- 11.2.5.2. Products
- 11.2.5.3. SWOT Analysis
- 11.2.5.4. Recent Developments
- 11.2.5.5. Financials (Based on Availability)
- 11.2.6 F Hoffmann-La Roche Ltd
- 11.2.6.1. Overview
- 11.2.6.2. Products
- 11.2.6.3. SWOT Analysis
- 11.2.6.4. Recent Developments
- 11.2.6.5. Financials (Based on Availability)
- 11.2.7 Merck KGaA
- 11.2.7.1. Overview
- 11.2.7.2. Products
- 11.2.7.3. SWOT Analysis
- 11.2.7.4. Recent Developments
- 11.2.7.5. Financials (Based on Availability)
- 11.2.8 Pfizer Inc
- 11.2.8.1. Overview
- 11.2.8.2. Products
- 11.2.8.3. SWOT Analysis
- 11.2.8.4. Recent Developments
- 11.2.8.5. Financials (Based on Availability)
- 11.2.9 Siemens Healthineers AG
- 11.2.9.1. Overview
- 11.2.9.2. Products
- 11.2.9.3. SWOT Analysis
- 11.2.9.4. Recent Developments
- 11.2.9.5. Financials (Based on Availability)
- 11.2.10 Kyowa Kirin Co Ltd
- 11.2.10.1. Overview
- 11.2.10.2. Products
- 11.2.10.3. SWOT Analysis
- 11.2.10.4. Recent Developments
- 11.2.10.5. Financials (Based on Availability)
- 11.2.11 GenScript
- 11.2.11.1. Overview
- 11.2.11.2. Products
- 11.2.11.3. SWOT Analysis
- 11.2.11.4. Recent Developments
- 11.2.11.5. Financials (Based on Availability)
- 11.2.12 Bioagilytix Labs*List Not Exhaustive
- 11.2.12.1. Overview
- 11.2.12.2. Products
- 11.2.12.3. SWOT Analysis
- 11.2.12.4. Recent Developments
- 11.2.12.5. Financials (Based on Availability)
- 11.2.1 3Sbio Group
List of Figures
- Figure 1: Global EPO Biomarkers Market Revenue Breakdown (Million, %) by Region 2024 & 2032
- Figure 2: Global EPO Biomarkers Market Volume Breakdown (Billion, %) by Region 2024 & 2032
- Figure 3: North America EPO Biomarkers Market Revenue (Million), by Type 2024 & 2032
- Figure 4: North America EPO Biomarkers Market Volume (Billion), by Type 2024 & 2032
- Figure 5: North America EPO Biomarkers Market Revenue Share (%), by Type 2024 & 2032
- Figure 6: North America EPO Biomarkers Market Volume Share (%), by Type 2024 & 2032
- Figure 7: North America EPO Biomarkers Market Revenue (Million), by Application 2024 & 2032
- Figure 8: North America EPO Biomarkers Market Volume (Billion), by Application 2024 & 2032
- Figure 9: North America EPO Biomarkers Market Revenue Share (%), by Application 2024 & 2032
- Figure 10: North America EPO Biomarkers Market Volume Share (%), by Application 2024 & 2032
- Figure 11: North America EPO Biomarkers Market Revenue (Million), by Country 2024 & 2032
- Figure 12: North America EPO Biomarkers Market Volume (Billion), by Country 2024 & 2032
- Figure 13: North America EPO Biomarkers Market Revenue Share (%), by Country 2024 & 2032
- Figure 14: North America EPO Biomarkers Market Volume Share (%), by Country 2024 & 2032
- Figure 15: Europe EPO Biomarkers Market Revenue (Million), by Type 2024 & 2032
- Figure 16: Europe EPO Biomarkers Market Volume (Billion), by Type 2024 & 2032
- Figure 17: Europe EPO Biomarkers Market Revenue Share (%), by Type 2024 & 2032
- Figure 18: Europe EPO Biomarkers Market Volume Share (%), by Type 2024 & 2032
- Figure 19: Europe EPO Biomarkers Market Revenue (Million), by Application 2024 & 2032
- Figure 20: Europe EPO Biomarkers Market Volume (Billion), by Application 2024 & 2032
- Figure 21: Europe EPO Biomarkers Market Revenue Share (%), by Application 2024 & 2032
- Figure 22: Europe EPO Biomarkers Market Volume Share (%), by Application 2024 & 2032
- Figure 23: Europe EPO Biomarkers Market Revenue (Million), by Country 2024 & 2032
- Figure 24: Europe EPO Biomarkers Market Volume (Billion), by Country 2024 & 2032
- Figure 25: Europe EPO Biomarkers Market Revenue Share (%), by Country 2024 & 2032
- Figure 26: Europe EPO Biomarkers Market Volume Share (%), by Country 2024 & 2032
- Figure 27: Asia Pacific EPO Biomarkers Market Revenue (Million), by Type 2024 & 2032
- Figure 28: Asia Pacific EPO Biomarkers Market Volume (Billion), by Type 2024 & 2032
- Figure 29: Asia Pacific EPO Biomarkers Market Revenue Share (%), by Type 2024 & 2032
- Figure 30: Asia Pacific EPO Biomarkers Market Volume Share (%), by Type 2024 & 2032
- Figure 31: Asia Pacific EPO Biomarkers Market Revenue (Million), by Application 2024 & 2032
- Figure 32: Asia Pacific EPO Biomarkers Market Volume (Billion), by Application 2024 & 2032
- Figure 33: Asia Pacific EPO Biomarkers Market Revenue Share (%), by Application 2024 & 2032
- Figure 34: Asia Pacific EPO Biomarkers Market Volume Share (%), by Application 2024 & 2032
- Figure 35: Asia Pacific EPO Biomarkers Market Revenue (Million), by Country 2024 & 2032
- Figure 36: Asia Pacific EPO Biomarkers Market Volume (Billion), by Country 2024 & 2032
- Figure 37: Asia Pacific EPO Biomarkers Market Revenue Share (%), by Country 2024 & 2032
- Figure 38: Asia Pacific EPO Biomarkers Market Volume Share (%), by Country 2024 & 2032
- Figure 39: Middle East and Africa EPO Biomarkers Market Revenue (Million), by Type 2024 & 2032
- Figure 40: Middle East and Africa EPO Biomarkers Market Volume (Billion), by Type 2024 & 2032
- Figure 41: Middle East and Africa EPO Biomarkers Market Revenue Share (%), by Type 2024 & 2032
- Figure 42: Middle East and Africa EPO Biomarkers Market Volume Share (%), by Type 2024 & 2032
- Figure 43: Middle East and Africa EPO Biomarkers Market Revenue (Million), by Application 2024 & 2032
- Figure 44: Middle East and Africa EPO Biomarkers Market Volume (Billion), by Application 2024 & 2032
- Figure 45: Middle East and Africa EPO Biomarkers Market Revenue Share (%), by Application 2024 & 2032
- Figure 46: Middle East and Africa EPO Biomarkers Market Volume Share (%), by Application 2024 & 2032
- Figure 47: Middle East and Africa EPO Biomarkers Market Revenue (Million), by Country 2024 & 2032
- Figure 48: Middle East and Africa EPO Biomarkers Market Volume (Billion), by Country 2024 & 2032
- Figure 49: Middle East and Africa EPO Biomarkers Market Revenue Share (%), by Country 2024 & 2032
- Figure 50: Middle East and Africa EPO Biomarkers Market Volume Share (%), by Country 2024 & 2032
- Figure 51: South America EPO Biomarkers Market Revenue (Million), by Type 2024 & 2032
- Figure 52: South America EPO Biomarkers Market Volume (Billion), by Type 2024 & 2032
- Figure 53: South America EPO Biomarkers Market Revenue Share (%), by Type 2024 & 2032
- Figure 54: South America EPO Biomarkers Market Volume Share (%), by Type 2024 & 2032
- Figure 55: South America EPO Biomarkers Market Revenue (Million), by Application 2024 & 2032
- Figure 56: South America EPO Biomarkers Market Volume (Billion), by Application 2024 & 2032
- Figure 57: South America EPO Biomarkers Market Revenue Share (%), by Application 2024 & 2032
- Figure 58: South America EPO Biomarkers Market Volume Share (%), by Application 2024 & 2032
- Figure 59: South America EPO Biomarkers Market Revenue (Million), by Country 2024 & 2032
- Figure 60: South America EPO Biomarkers Market Volume (Billion), by Country 2024 & 2032
- Figure 61: South America EPO Biomarkers Market Revenue Share (%), by Country 2024 & 2032
- Figure 62: South America EPO Biomarkers Market Volume Share (%), by Country 2024 & 2032
List of Tables
- Table 1: Global EPO Biomarkers Market Revenue Million Forecast, by Region 2019 & 2032
- Table 2: Global EPO Biomarkers Market Volume Billion Forecast, by Region 2019 & 2032
- Table 3: Global EPO Biomarkers Market Revenue Million Forecast, by Type 2019 & 2032
- Table 4: Global EPO Biomarkers Market Volume Billion Forecast, by Type 2019 & 2032
- Table 5: Global EPO Biomarkers Market Revenue Million Forecast, by Application 2019 & 2032
- Table 6: Global EPO Biomarkers Market Volume Billion Forecast, by Application 2019 & 2032
- Table 7: Global EPO Biomarkers Market Revenue Million Forecast, by Region 2019 & 2032
- Table 8: Global EPO Biomarkers Market Volume Billion Forecast, by Region 2019 & 2032
- Table 9: Global EPO Biomarkers Market Revenue Million Forecast, by Type 2019 & 2032
- Table 10: Global EPO Biomarkers Market Volume Billion Forecast, by Type 2019 & 2032
- Table 11: Global EPO Biomarkers Market Revenue Million Forecast, by Application 2019 & 2032
- Table 12: Global EPO Biomarkers Market Volume Billion Forecast, by Application 2019 & 2032
- Table 13: Global EPO Biomarkers Market Revenue Million Forecast, by Country 2019 & 2032
- Table 14: Global EPO Biomarkers Market Volume Billion Forecast, by Country 2019 & 2032
- Table 15: United States EPO Biomarkers Market Revenue (Million) Forecast, by Application 2019 & 2032
- Table 16: United States EPO Biomarkers Market Volume (Billion) Forecast, by Application 2019 & 2032
- Table 17: Canada EPO Biomarkers Market Revenue (Million) Forecast, by Application 2019 & 2032
- Table 18: Canada EPO Biomarkers Market Volume (Billion) Forecast, by Application 2019 & 2032
- Table 19: Mexico EPO Biomarkers Market Revenue (Million) Forecast, by Application 2019 & 2032
- Table 20: Mexico EPO Biomarkers Market Volume (Billion) Forecast, by Application 2019 & 2032
- Table 21: Global EPO Biomarkers Market Revenue Million Forecast, by Type 2019 & 2032
- Table 22: Global EPO Biomarkers Market Volume Billion Forecast, by Type 2019 & 2032
- Table 23: Global EPO Biomarkers Market Revenue Million Forecast, by Application 2019 & 2032
- Table 24: Global EPO Biomarkers Market Volume Billion Forecast, by Application 2019 & 2032
- Table 25: Global EPO Biomarkers Market Revenue Million Forecast, by Country 2019 & 2032
- Table 26: Global EPO Biomarkers Market Volume Billion Forecast, by Country 2019 & 2032
- Table 27: Germany EPO Biomarkers Market Revenue (Million) Forecast, by Application 2019 & 2032
- Table 28: Germany EPO Biomarkers Market Volume (Billion) Forecast, by Application 2019 & 2032
- Table 29: United Kingdom EPO Biomarkers Market Revenue (Million) Forecast, by Application 2019 & 2032
- Table 30: United Kingdom EPO Biomarkers Market Volume (Billion) Forecast, by Application 2019 & 2032
- Table 31: France EPO Biomarkers Market Revenue (Million) Forecast, by Application 2019 & 2032
- Table 32: France EPO Biomarkers Market Volume (Billion) Forecast, by Application 2019 & 2032
- Table 33: Italy EPO Biomarkers Market Revenue (Million) Forecast, by Application 2019 & 2032
- Table 34: Italy EPO Biomarkers Market Volume (Billion) Forecast, by Application 2019 & 2032
- Table 35: Spain EPO Biomarkers Market Revenue (Million) Forecast, by Application 2019 & 2032
- Table 36: Spain EPO Biomarkers Market Volume (Billion) Forecast, by Application 2019 & 2032
- Table 37: Rest of Europe EPO Biomarkers Market Revenue (Million) Forecast, by Application 2019 & 2032
- Table 38: Rest of Europe EPO Biomarkers Market Volume (Billion) Forecast, by Application 2019 & 2032
- Table 39: Global EPO Biomarkers Market Revenue Million Forecast, by Type 2019 & 2032
- Table 40: Global EPO Biomarkers Market Volume Billion Forecast, by Type 2019 & 2032
- Table 41: Global EPO Biomarkers Market Revenue Million Forecast, by Application 2019 & 2032
- Table 42: Global EPO Biomarkers Market Volume Billion Forecast, by Application 2019 & 2032
- Table 43: Global EPO Biomarkers Market Revenue Million Forecast, by Country 2019 & 2032
- Table 44: Global EPO Biomarkers Market Volume Billion Forecast, by Country 2019 & 2032
- Table 45: China EPO Biomarkers Market Revenue (Million) Forecast, by Application 2019 & 2032
- Table 46: China EPO Biomarkers Market Volume (Billion) Forecast, by Application 2019 & 2032
- Table 47: Japan EPO Biomarkers Market Revenue (Million) Forecast, by Application 2019 & 2032
- Table 48: Japan EPO Biomarkers Market Volume (Billion) Forecast, by Application 2019 & 2032
- Table 49: India EPO Biomarkers Market Revenue (Million) Forecast, by Application 2019 & 2032
- Table 50: India EPO Biomarkers Market Volume (Billion) Forecast, by Application 2019 & 2032
- Table 51: Australia EPO Biomarkers Market Revenue (Million) Forecast, by Application 2019 & 2032
- Table 52: Australia EPO Biomarkers Market Volume (Billion) Forecast, by Application 2019 & 2032
- Table 53: South Korea EPO Biomarkers Market Revenue (Million) Forecast, by Application 2019 & 2032
- Table 54: South Korea EPO Biomarkers Market Volume (Billion) Forecast, by Application 2019 & 2032
- Table 55: Rest of Asia Pacific EPO Biomarkers Market Revenue (Million) Forecast, by Application 2019 & 2032
- Table 56: Rest of Asia Pacific EPO Biomarkers Market Volume (Billion) Forecast, by Application 2019 & 2032
- Table 57: Global EPO Biomarkers Market Revenue Million Forecast, by Type 2019 & 2032
- Table 58: Global EPO Biomarkers Market Volume Billion Forecast, by Type 2019 & 2032
- Table 59: Global EPO Biomarkers Market Revenue Million Forecast, by Application 2019 & 2032
- Table 60: Global EPO Biomarkers Market Volume Billion Forecast, by Application 2019 & 2032
- Table 61: Global EPO Biomarkers Market Revenue Million Forecast, by Country 2019 & 2032
- Table 62: Global EPO Biomarkers Market Volume Billion Forecast, by Country 2019 & 2032
- Table 63: GCC EPO Biomarkers Market Revenue (Million) Forecast, by Application 2019 & 2032
- Table 64: GCC EPO Biomarkers Market Volume (Billion) Forecast, by Application 2019 & 2032
- Table 65: South Africa EPO Biomarkers Market Revenue (Million) Forecast, by Application 2019 & 2032
- Table 66: South Africa EPO Biomarkers Market Volume (Billion) Forecast, by Application 2019 & 2032
- Table 67: Rest of Middle East and Africa EPO Biomarkers Market Revenue (Million) Forecast, by Application 2019 & 2032
- Table 68: Rest of Middle East and Africa EPO Biomarkers Market Volume (Billion) Forecast, by Application 2019 & 2032
- Table 69: Global EPO Biomarkers Market Revenue Million Forecast, by Type 2019 & 2032
- Table 70: Global EPO Biomarkers Market Volume Billion Forecast, by Type 2019 & 2032
- Table 71: Global EPO Biomarkers Market Revenue Million Forecast, by Application 2019 & 2032
- Table 72: Global EPO Biomarkers Market Volume Billion Forecast, by Application 2019 & 2032
- Table 73: Global EPO Biomarkers Market Revenue Million Forecast, by Country 2019 & 2032
- Table 74: Global EPO Biomarkers Market Volume Billion Forecast, by Country 2019 & 2032
- Table 75: Brazil EPO Biomarkers Market Revenue (Million) Forecast, by Application 2019 & 2032
- Table 76: Brazil EPO Biomarkers Market Volume (Billion) Forecast, by Application 2019 & 2032
- Table 77: Argentina EPO Biomarkers Market Revenue (Million) Forecast, by Application 2019 & 2032
- Table 78: Argentina EPO Biomarkers Market Volume (Billion) Forecast, by Application 2019 & 2032
- Table 79: Rest of South America EPO Biomarkers Market Revenue (Million) Forecast, by Application 2019 & 2032
- Table 80: Rest of South America EPO Biomarkers Market Volume (Billion) Forecast, by Application 2019 & 2032
Frequently Asked Questions
1. What is the projected Compound Annual Growth Rate (CAGR) of the EPO Biomarkers Market?
The projected CAGR is approximately 5.49%.
2. Which companies are prominent players in the EPO Biomarkers Market?
Key companies in the market include 3Sbio Group, Amgen Inc, Biocon, Bio-Rad Laboratories Inc, Eve Technologies, F Hoffmann-La Roche Ltd, Merck KGaA, Pfizer Inc, Siemens Healthineers AG, Kyowa Kirin Co Ltd, GenScript, Bioagilytix Labs*List Not Exhaustive.
3. What are the main segments of the EPO Biomarkers Market?
The market segments include Type, Application.
4. Can you provide details about the market size?
The market size is estimated to be USD 66.38 Million as of 2022.
5. What are some drivers contributing to market growth?
Increasing Prevalence of Cancer and End-Stage Renal Disease (ESRD); Favorable Healthcare Regulations In Developed Economies; Increasing Research and Development in EPO Biomarker Technology.
6. What are the notable trends driving market growth?
The Cancer Segment by Application is Expected Witness Significant Growth During the Forecast Period.
7. Are there any restraints impacting market growth?
Increasing Prevalence of Cancer and End-Stage Renal Disease (ESRD); Favorable Healthcare Regulations In Developed Economies; Increasing Research and Development in EPO Biomarker Technology.
8. Can you provide examples of recent developments in the market?
March 2024: CSL Vifor, in partnership with Akebia Therapeutics Inc., received the United States Food and Drug Administration (FDA) approval for Vafseo (vadadustat), developed by Akebia. It is an oral hypoxia-inducible factor prolyl hydroxylase inhibitor indicated to treat anemia caused by chronic kidney disease in adults who receive dialysis for at least three months.
9. What pricing options are available for accessing the report?
Pricing options include single-user, multi-user, and enterprise licenses priced at USD 4750, USD 5250, and USD 8750 respectively.
10. Is the market size provided in terms of value or volume?
The market size is provided in terms of value, measured in Million and volume, measured in Billion.
11. Are there any specific market keywords associated with the report?
Yes, the market keyword associated with the report is "EPO Biomarkers Market," which aids in identifying and referencing the specific market segment covered.
12. How do I determine which pricing option suits my needs best?
The pricing options vary based on user requirements and access needs. Individual users may opt for single-user licenses, while businesses requiring broader access may choose multi-user or enterprise licenses for cost-effective access to the report.
13. Are there any additional resources or data provided in the EPO Biomarkers Market report?
While the report offers comprehensive insights, it's advisable to review the specific contents or supplementary materials provided to ascertain if additional resources or data are available.
14. How can I stay updated on further developments or reports in the EPO Biomarkers Market?
To stay informed about further developments, trends, and reports in the EPO Biomarkers Market, consider subscribing to industry newsletters, following relevant companies and organizations, or regularly checking reputable industry news sources and publications.
Methodology
Step 1 - Identification of Relevant Samples Size from Population Database


Step 2 - Approaches for Defining Global Market Size (Value, Volume* & Price*)

Note*: In applicable scenarios
Step 3 - Data Sources
Primary Research
- Web Analytics
- Survey Reports
- Research Institute
- Latest Research Reports
- Opinion Leaders
Secondary Research
- Annual Reports
- White Paper
- Latest Press Release
- Industry Association
- Paid Database
- Investor Presentations

Step 4 - Data Triangulation
Involves using different sources of information in order to increase the validity of a study
These sources are likely to be stakeholders in a program - participants, other researchers, program staff, other community members, and so on.
Then we put all data in single framework & apply various statistical tools to find out the dynamic on the market.
During the analysis stage, feedback from the stakeholder groups would be compared to determine areas of agreement as well as areas of divergence


