
Key Insights
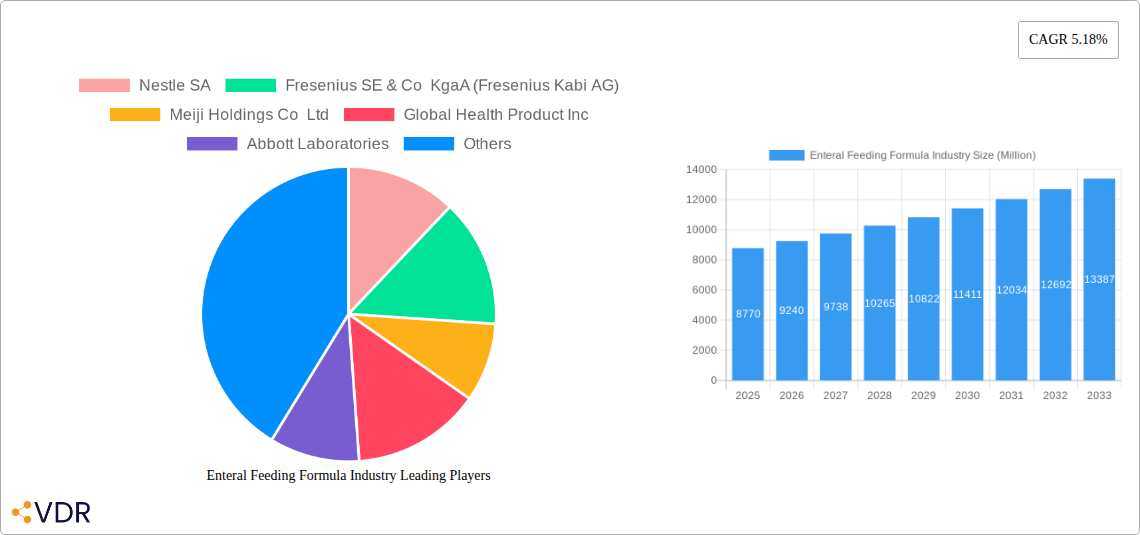
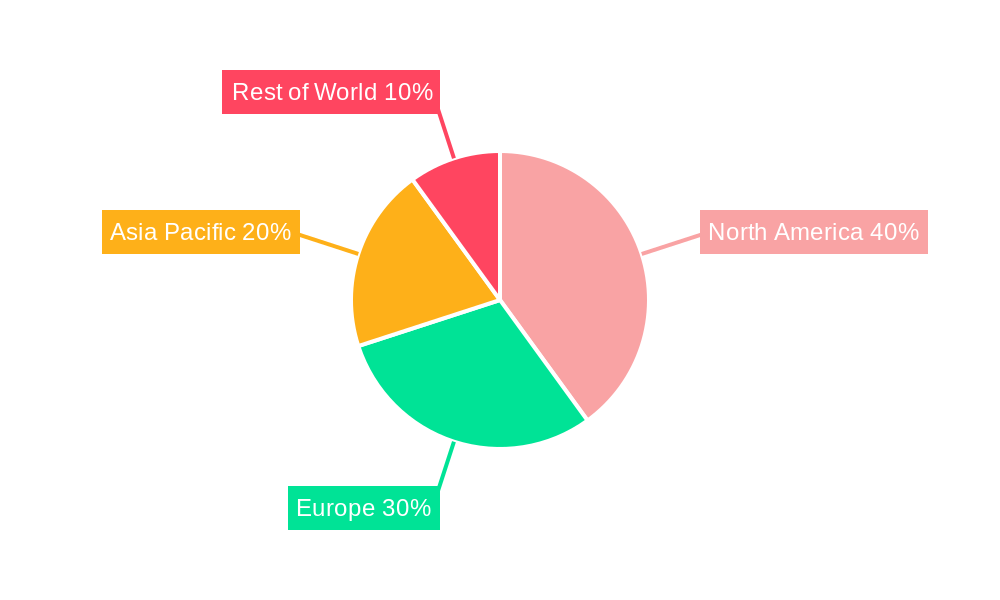
The enteral feeding formula market, valued at $8.77 billion in 2025, is projected to experience robust growth, exhibiting a Compound Annual Growth Rate (CAGR) of 5.18% from 2025 to 2033. This expansion is driven by several key factors. The aging global population, coupled with a rising prevalence of chronic diseases like diabetes, neurological disorders, and cancer, necessitates increased reliance on enteral nutrition. Technological advancements leading to improved formula formulations, enhanced delivery systems, and greater convenience are also contributing to market growth. Furthermore, a shift towards home-based healthcare settings and increased awareness regarding the benefits of enteral nutrition are bolstering demand. The market segmentation reveals a significant portion attributed to standard formulas, followed by disease-specific formulas catering to the needs of patients with specific conditions. Oncology and neurology applications represent major segments within the application-based categorization. Hospitals remain the primary end-users, although home care agencies and online pharmacies are witnessing escalating demand. Key players like Nestlé, Fresenius Kabi, Abbott, and Danone are driving innovation and market competition through product diversification and strategic partnerships. Geographic distribution shows North America and Europe holding substantial market shares, while Asia-Pacific is poised for significant growth, driven by increasing healthcare expenditure and rising healthcare awareness.
The market's growth trajectory, however, faces certain restraints. High costs associated with specialized formulas, particularly disease-specific ones, can limit accessibility. Regulatory hurdles and varying reimbursement policies across different regions might also impact market penetration. Nonetheless, the overall outlook for the enteral feeding formula market remains positive, driven by demographic shifts, technological improvements, and an increasing focus on improving patient outcomes through effective nutritional support. The market's future growth will hinge on continuous innovation, addressing affordability concerns, and expanding access to quality enteral nutrition solutions across diverse geographic regions.
Enteral Feeding Formula Industry Market Report: 2019-2033
This comprehensive report provides an in-depth analysis of the global enteral feeding formula market, encompassing market dynamics, growth trends, regional performance, product landscape, and key players. The study period covers 2019-2033, with a base year of 2025 and a forecast period of 2025-2033. The report is essential for industry professionals, investors, and stakeholders seeking a thorough understanding of this vital healthcare sector. Market values are presented in million units.
Enteral Feeding Formula Industry Market Dynamics & Structure
The enteral feeding formula market is characterized by a moderately consolidated structure, with key players like Nestle SA, Fresenius SE & Co KgaA (Fresenius Kabi AG), and Abbott Laboratories holding significant market share. Technological innovation, particularly in specialized formulas and delivery systems, is a major driver, alongside increasing prevalence of chronic diseases requiring enteral nutrition. Stringent regulatory frameworks govern product safety and efficacy, while competitive pressures from generic and specialized formulas influence pricing and market penetration. The market witnesses continuous mergers and acquisitions (M&A) activity, reflecting consolidation trends and expansion strategies.
- Market Concentration: High, with top 5 players holding approximately xx% market share in 2024.
- Technological Innovation: Focus on personalized nutrition, improved palatability, and advanced delivery systems.
- Regulatory Framework: Stringent regulations impacting product approval and labeling.
- M&A Activity: xx deals recorded between 2019 and 2024, with an average deal value of xx million.
- End-User Demographics: Aging population and rising prevalence of chronic diseases fuel market growth.
- Competitive Landscape: Intense competition based on product innovation, pricing, and distribution networks.
Enteral Feeding Formula Industry Growth Trends & Insights
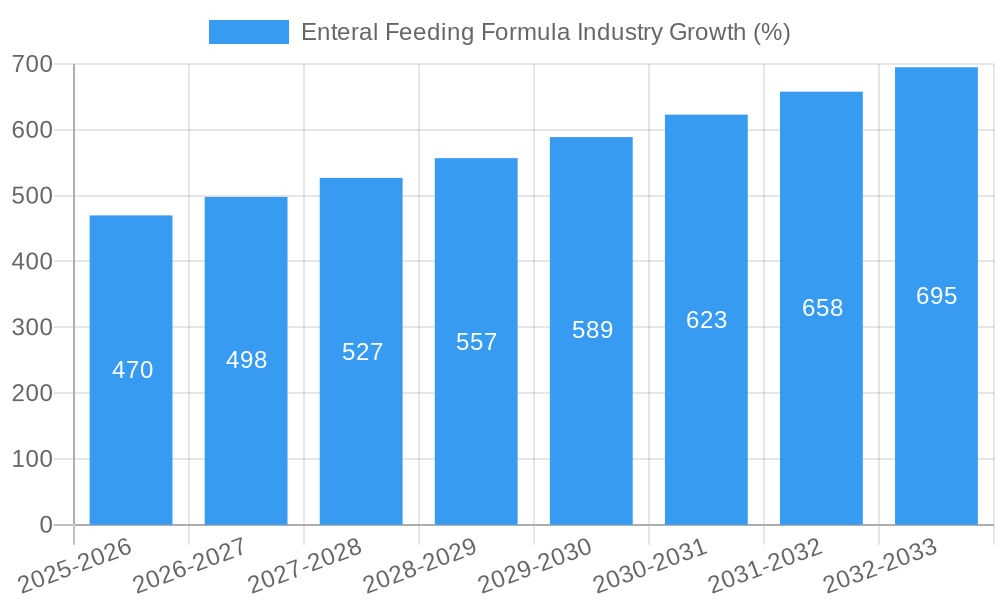
The global enteral feeding formula market experienced significant growth during the historical period (2019-2024), driven by factors such as the rising prevalence of chronic diseases (e.g., diabetes, oncology, neurological disorders), an aging population requiring specialized nutritional support, and increasing healthcare expenditure. The market is projected to maintain a robust Compound Annual Growth Rate (CAGR) of xx% during the forecast period (2025-2033), reaching a market size of xx million units by 2033. Technological advancements, such as the development of disease-specific formulas and convenient delivery systems, further contribute to market expansion. Consumer preference is shifting towards convenient, palatable, and personalized solutions. Market penetration in emerging economies is expected to increase gradually.
Dominant Regions, Countries, or Segments in Enteral Feeding Formula Industry
North America currently dominates the global enteral feeding formula market, followed by Europe. High healthcare expenditure, advanced healthcare infrastructure, and a high prevalence of chronic diseases contribute to this dominance. Within product segments, disease-specific formulas are experiencing faster growth compared to standard formulas, driven by the increasing incidence of chronic illnesses. Hospitals constitute the largest end-user segment, followed by home care agencies and hospices. The retail pharmacy channel is witnessing growing adoption.
- North America: High market share due to high healthcare expenditure and prevalence of chronic diseases.
- Europe: Significant market size driven by aging population and advanced healthcare infrastructure.
- Asia-Pacific: High growth potential driven by rising healthcare expenditure and increasing awareness of enteral nutrition.
- Disease-Specific Formulas: Fastest-growing segment due to increasing prevalence of chronic diseases.
- Hospital Segment: Largest end-user segment due to high demand in hospital settings.
Enteral Feeding Formula Industry Product Landscape
The enteral feeding formula market offers a diverse range of products, categorized into standard formulas and disease-specific formulas. Standard formulas cater to general nutritional needs, while disease-specific formulas address the unique dietary requirements of patients with specific conditions, such as diabetes, oncology, or neurological disorders. Innovations focus on enhanced palatability, improved nutrient absorption, and convenient delivery systems. Unique selling propositions often emphasize specialized nutrient profiles, tailored texture, and ease of administration.
Key Drivers, Barriers & Challenges in Enteral Feeding Formula Industry
Key Drivers:
- Rising prevalence of chronic diseases.
- Aging global population.
- Increasing healthcare expenditure.
- Technological advancements leading to improved product offerings.
Challenges:
- Stringent regulatory approvals and compliance costs.
- Price sensitivity and competition from generic products.
- Potential supply chain disruptions affecting raw material availability. This resulted in a xx% increase in raw material costs in 2022.
Emerging Opportunities in Enteral Feeding Formula Industry
- Growing demand for personalized nutrition solutions.
- Expansion into emerging markets with unmet needs.
- Development of innovative delivery systems (e.g., smart pumps).
- Increased focus on plant-based and organic formulas.
Growth Accelerators in the Enteral Feeding Formula Industry Industry
The long-term growth of the enteral feeding formula market will be fueled by continuous technological advancements resulting in superior product efficacy and convenience, strategic partnerships between manufacturers and healthcare providers expanding market reach, and expansion into underserved geographical regions driving market penetration.
Key Players Shaping the Enteral Feeding Formula Industry Market
- Nestle SA
- Fresenius SE & Co KgaA (Fresenius Kabi AG)
- Meiji Holdings Co Ltd
- Global Health Product Inc
- Abbott Laboratories
- Danone SA (Nutricia)
- Functional Formularies
- Hormel Foods Corporation
- B Braun Melsungen AG
- Victus Inc
- Reckitt Benckiser Group plc (Mead Johnson)
- Kate Farms
Notable Milestones in Enteral Feeding Formula Industry Sector
- September 2022: Kate Farms secured USD 75 million in Series C funding, boosting plant-based research and product innovation.
- September 2022: Kate Farms launched Adult Standard 1.4, a high-calorie formula, expanding its product portfolio.
In-Depth Enteral Feeding Formula Industry Market Outlook
The enteral feeding formula market holds significant future potential, driven by the long-term trends of an aging population, rising chronic disease prevalence, and continuous technological advancements. Strategic partnerships, product diversification, and expansion into emerging markets will be critical for sustained growth. The market is poised for further consolidation, with opportunities for both established players and new entrants to capitalize on emerging needs and innovative solutions.
Enteral Feeding Formula Industry Segmentation
-
1. Product
- 1.1. Standard Formulas
- 1.2. Disease-specific Formulas
-
2. Application
- 2.1. Oncology
- 2.2. Neurology
- 2.3. Critical Care
- 2.4. Diabetes
- 2.5. Gastroenterology
- 2.6. Other Applications
-
3. End User
- 3.1. Hospital
- 3.2. Home Care Agencies and Hospices
- 3.3. Other End Users
-
4. Distributuion Channel
- 4.1. Hospitals
- 4.2. Retail Pharmacies
- 4.3. Online Pharmacies
Enteral Feeding Formula Industry Segmentation By Geography
-
1. North America
- 1.1. United States
- 1.2. Canada
- 1.3. Mexico
-
2. Europe
- 2.1. Germany
- 2.2. United Kingdom
- 2.3. France
- 2.4. Italy
- 2.5. Spain
- 2.6. Rest of Europe
-
3. Asia Pacific
- 3.1. China
- 3.2. Japan
- 3.3. India
- 3.4. Australia
- 3.5. South Korea
- 3.6. Rest of Asia Pacific
-
4. Middle East and Africa
- 4.1. GCC
- 4.2. South Africa
- 4.3. Rest of Middle East and Africa
-
5. South America
- 5.1. Brazil
- 5.2. Argentina
- 5.3. Rest of South America
Enteral Feeding Formula Industry REPORT HIGHLIGHTS
| Aspects | Details |
|---|---|
| Study Period | 2019-2033 |
| Base Year | 2024 |
| Estimated Year | 2025 |
| Forecast Period | 2025-2033 |
| Historical Period | 2019-2024 |
| Growth Rate | CAGR of 5.18% from 2019-2033 |
| Segmentation |
|
Table of Contents
- 1. Introduction
- 1.1. Research Scope
- 1.2. Market Segmentation
- 1.3. Research Methodology
- 1.4. Definitions and Assumptions
- 2. Executive Summary
- 2.1. Introduction
- 3. Market Dynamics
- 3.1. Introduction
- 3.2. Market Drivers
- 3.2.1. Increasing Prevalence of Metabolic and Chronic Diseases; Increasing Spending on Patient Care; Growing Geriatric Population
- 3.3. Market Restrains
- 3.3.1. Complications Associated with Enteral Nutrition; High Cost and Low Adherence Rates in Developing Countries
- 3.4. Market Trends
- 3.4.1. Oncology Segment is Expected to Hold a Significant Market Share in the Enteral Feeding Formulas Market
- 4. Market Factor Analysis
- 4.1. Porters Five Forces
- 4.2. Supply/Value Chain
- 4.3. PESTEL analysis
- 4.4. Market Entropy
- 4.5. Patent/Trademark Analysis
- 5. Global Enteral Feeding Formula Industry Analysis, Insights and Forecast, 2019-2031
- 5.1. Market Analysis, Insights and Forecast - by Product
- 5.1.1. Standard Formulas
- 5.1.2. Disease-specific Formulas
- 5.2. Market Analysis, Insights and Forecast - by Application
- 5.2.1. Oncology
- 5.2.2. Neurology
- 5.2.3. Critical Care
- 5.2.4. Diabetes
- 5.2.5. Gastroenterology
- 5.2.6. Other Applications
- 5.3. Market Analysis, Insights and Forecast - by End User
- 5.3.1. Hospital
- 5.3.2. Home Care Agencies and Hospices
- 5.3.3. Other End Users
- 5.4. Market Analysis, Insights and Forecast - by Distributuion Channel
- 5.4.1. Hospitals
- 5.4.2. Retail Pharmacies
- 5.4.3. Online Pharmacies
- 5.5. Market Analysis, Insights and Forecast - by Region
- 5.5.1. North America
- 5.5.2. Europe
- 5.5.3. Asia Pacific
- 5.5.4. Middle East and Africa
- 5.5.5. South America
- 5.1. Market Analysis, Insights and Forecast - by Product
- 6. North America Enteral Feeding Formula Industry Analysis, Insights and Forecast, 2019-2031
- 6.1. Market Analysis, Insights and Forecast - by Product
- 6.1.1. Standard Formulas
- 6.1.2. Disease-specific Formulas
- 6.2. Market Analysis, Insights and Forecast - by Application
- 6.2.1. Oncology
- 6.2.2. Neurology
- 6.2.3. Critical Care
- 6.2.4. Diabetes
- 6.2.5. Gastroenterology
- 6.2.6. Other Applications
- 6.3. Market Analysis, Insights and Forecast - by End User
- 6.3.1. Hospital
- 6.3.2. Home Care Agencies and Hospices
- 6.3.3. Other End Users
- 6.4. Market Analysis, Insights and Forecast - by Distributuion Channel
- 6.4.1. Hospitals
- 6.4.2. Retail Pharmacies
- 6.4.3. Online Pharmacies
- 6.1. Market Analysis, Insights and Forecast - by Product
- 7. Europe Enteral Feeding Formula Industry Analysis, Insights and Forecast, 2019-2031
- 7.1. Market Analysis, Insights and Forecast - by Product
- 7.1.1. Standard Formulas
- 7.1.2. Disease-specific Formulas
- 7.2. Market Analysis, Insights and Forecast - by Application
- 7.2.1. Oncology
- 7.2.2. Neurology
- 7.2.3. Critical Care
- 7.2.4. Diabetes
- 7.2.5. Gastroenterology
- 7.2.6. Other Applications
- 7.3. Market Analysis, Insights and Forecast - by End User
- 7.3.1. Hospital
- 7.3.2. Home Care Agencies and Hospices
- 7.3.3. Other End Users
- 7.4. Market Analysis, Insights and Forecast - by Distributuion Channel
- 7.4.1. Hospitals
- 7.4.2. Retail Pharmacies
- 7.4.3. Online Pharmacies
- 7.1. Market Analysis, Insights and Forecast - by Product
- 8. Asia Pacific Enteral Feeding Formula Industry Analysis, Insights and Forecast, 2019-2031
- 8.1. Market Analysis, Insights and Forecast - by Product
- 8.1.1. Standard Formulas
- 8.1.2. Disease-specific Formulas
- 8.2. Market Analysis, Insights and Forecast - by Application
- 8.2.1. Oncology
- 8.2.2. Neurology
- 8.2.3. Critical Care
- 8.2.4. Diabetes
- 8.2.5. Gastroenterology
- 8.2.6. Other Applications
- 8.3. Market Analysis, Insights and Forecast - by End User
- 8.3.1. Hospital
- 8.3.2. Home Care Agencies and Hospices
- 8.3.3. Other End Users
- 8.4. Market Analysis, Insights and Forecast - by Distributuion Channel
- 8.4.1. Hospitals
- 8.4.2. Retail Pharmacies
- 8.4.3. Online Pharmacies
- 8.1. Market Analysis, Insights and Forecast - by Product
- 9. Middle East and Africa Enteral Feeding Formula Industry Analysis, Insights and Forecast, 2019-2031
- 9.1. Market Analysis, Insights and Forecast - by Product
- 9.1.1. Standard Formulas
- 9.1.2. Disease-specific Formulas
- 9.2. Market Analysis, Insights and Forecast - by Application
- 9.2.1. Oncology
- 9.2.2. Neurology
- 9.2.3. Critical Care
- 9.2.4. Diabetes
- 9.2.5. Gastroenterology
- 9.2.6. Other Applications
- 9.3. Market Analysis, Insights and Forecast - by End User
- 9.3.1. Hospital
- 9.3.2. Home Care Agencies and Hospices
- 9.3.3. Other End Users
- 9.4. Market Analysis, Insights and Forecast - by Distributuion Channel
- 9.4.1. Hospitals
- 9.4.2. Retail Pharmacies
- 9.4.3. Online Pharmacies
- 9.1. Market Analysis, Insights and Forecast - by Product
- 10. South America Enteral Feeding Formula Industry Analysis, Insights and Forecast, 2019-2031
- 10.1. Market Analysis, Insights and Forecast - by Product
- 10.1.1. Standard Formulas
- 10.1.2. Disease-specific Formulas
- 10.2. Market Analysis, Insights and Forecast - by Application
- 10.2.1. Oncology
- 10.2.2. Neurology
- 10.2.3. Critical Care
- 10.2.4. Diabetes
- 10.2.5. Gastroenterology
- 10.2.6. Other Applications
- 10.3. Market Analysis, Insights and Forecast - by End User
- 10.3.1. Hospital
- 10.3.2. Home Care Agencies and Hospices
- 10.3.3. Other End Users
- 10.4. Market Analysis, Insights and Forecast - by Distributuion Channel
- 10.4.1. Hospitals
- 10.4.2. Retail Pharmacies
- 10.4.3. Online Pharmacies
- 10.1. Market Analysis, Insights and Forecast - by Product
- 11. North America Enteral Feeding Formula Industry Analysis, Insights and Forecast, 2019-2031
- 11.1. Market Analysis, Insights and Forecast - By Country/Sub-region
- 11.1.1 United States
- 11.1.2 Canada
- 11.1.3 Mexico
- 12. South America Enteral Feeding Formula Industry Analysis, Insights and Forecast, 2019-2031
- 12.1. Market Analysis, Insights and Forecast - By Country/Sub-region
- 12.1.1 Brazil
- 12.1.2 Mexico
- 12.1.3 Rest of South America
- 13. Europe Enteral Feeding Formula Industry Analysis, Insights and Forecast, 2019-2031
- 13.1. Market Analysis, Insights and Forecast - By Country/Sub-region
- 13.1.1 United Kingdom
- 13.1.2 Germany
- 13.1.3 France
- 13.1.4 Italy
- 13.1.5 Spain
- 13.1.6 Russia
- 13.1.7 Rest of Europe
- 14. Asia Pacific Enteral Feeding Formula Industry Analysis, Insights and Forecast, 2019-2031
- 14.1. Market Analysis, Insights and Forecast - By Country/Sub-region
- 14.1.1 China
- 14.1.2 Japan
- 14.1.3 India
- 14.1.4 South Korea
- 14.1.5 Taiwan
- 14.1.6 Australia
- 14.1.7 Rest of Asia-Pacific
- 15. MEA Enteral Feeding Formula Industry Analysis, Insights and Forecast, 2019-2031
- 15.1. Market Analysis, Insights and Forecast - By Country/Sub-region
- 15.1.1 Middle East
- 15.1.2 Africa
- 16. Competitive Analysis
- 16.1. Global Market Share Analysis 2024
- 16.2. Company Profiles
- 16.2.1 Nestle SA
- 16.2.1.1. Overview
- 16.2.1.2. Products
- 16.2.1.3. SWOT Analysis
- 16.2.1.4. Recent Developments
- 16.2.1.5. Financials (Based on Availability)
- 16.2.2 Fresenius SE & Co KgaA (Fresenius Kabi AG)
- 16.2.2.1. Overview
- 16.2.2.2. Products
- 16.2.2.3. SWOT Analysis
- 16.2.2.4. Recent Developments
- 16.2.2.5. Financials (Based on Availability)
- 16.2.3 Meiji Holdings Co Ltd
- 16.2.3.1. Overview
- 16.2.3.2. Products
- 16.2.3.3. SWOT Analysis
- 16.2.3.4. Recent Developments
- 16.2.3.5. Financials (Based on Availability)
- 16.2.4 Global Health Product Inc
- 16.2.4.1. Overview
- 16.2.4.2. Products
- 16.2.4.3. SWOT Analysis
- 16.2.4.4. Recent Developments
- 16.2.4.5. Financials (Based on Availability)
- 16.2.5 Abbott Laboratories
- 16.2.5.1. Overview
- 16.2.5.2. Products
- 16.2.5.3. SWOT Analysis
- 16.2.5.4. Recent Developments
- 16.2.5.5. Financials (Based on Availability)
- 16.2.6 Danone SA (Nutricia)
- 16.2.6.1. Overview
- 16.2.6.2. Products
- 16.2.6.3. SWOT Analysis
- 16.2.6.4. Recent Developments
- 16.2.6.5. Financials (Based on Availability)
- 16.2.7 Functional Formularies*List Not Exhaustive
- 16.2.7.1. Overview
- 16.2.7.2. Products
- 16.2.7.3. SWOT Analysis
- 16.2.7.4. Recent Developments
- 16.2.7.5. Financials (Based on Availability)
- 16.2.8 Hormel Foods Corporation
- 16.2.8.1. Overview
- 16.2.8.2. Products
- 16.2.8.3. SWOT Analysis
- 16.2.8.4. Recent Developments
- 16.2.8.5. Financials (Based on Availability)
- 16.2.9 B Braun Melsungen AG
- 16.2.9.1. Overview
- 16.2.9.2. Products
- 16.2.9.3. SWOT Analysis
- 16.2.9.4. Recent Developments
- 16.2.9.5. Financials (Based on Availability)
- 16.2.10 Victus Inc
- 16.2.10.1. Overview
- 16.2.10.2. Products
- 16.2.10.3. SWOT Analysis
- 16.2.10.4. Recent Developments
- 16.2.10.5. Financials (Based on Availability)
- 16.2.11 Reckitt Benckiser Group plc (Mead Johnson)
- 16.2.11.1. Overview
- 16.2.11.2. Products
- 16.2.11.3. SWOT Analysis
- 16.2.11.4. Recent Developments
- 16.2.11.5. Financials (Based on Availability)
- 16.2.12 Kate Farms
- 16.2.12.1. Overview
- 16.2.12.2. Products
- 16.2.12.3. SWOT Analysis
- 16.2.12.4. Recent Developments
- 16.2.12.5. Financials (Based on Availability)
- 16.2.1 Nestle SA
List of Figures
- Figure 1: Global Enteral Feeding Formula Industry Revenue Breakdown (Million, %) by Region 2024 & 2032
- Figure 2: North America Enteral Feeding Formula Industry Revenue (Million), by Country 2024 & 2032
- Figure 3: North America Enteral Feeding Formula Industry Revenue Share (%), by Country 2024 & 2032
- Figure 4: South America Enteral Feeding Formula Industry Revenue (Million), by Country 2024 & 2032
- Figure 5: South America Enteral Feeding Formula Industry Revenue Share (%), by Country 2024 & 2032
- Figure 6: Europe Enteral Feeding Formula Industry Revenue (Million), by Country 2024 & 2032
- Figure 7: Europe Enteral Feeding Formula Industry Revenue Share (%), by Country 2024 & 2032
- Figure 8: Asia Pacific Enteral Feeding Formula Industry Revenue (Million), by Country 2024 & 2032
- Figure 9: Asia Pacific Enteral Feeding Formula Industry Revenue Share (%), by Country 2024 & 2032
- Figure 10: MEA Enteral Feeding Formula Industry Revenue (Million), by Country 2024 & 2032
- Figure 11: MEA Enteral Feeding Formula Industry Revenue Share (%), by Country 2024 & 2032
- Figure 12: North America Enteral Feeding Formula Industry Revenue (Million), by Product 2024 & 2032
- Figure 13: North America Enteral Feeding Formula Industry Revenue Share (%), by Product 2024 & 2032
- Figure 14: North America Enteral Feeding Formula Industry Revenue (Million), by Application 2024 & 2032
- Figure 15: North America Enteral Feeding Formula Industry Revenue Share (%), by Application 2024 & 2032
- Figure 16: North America Enteral Feeding Formula Industry Revenue (Million), by End User 2024 & 2032
- Figure 17: North America Enteral Feeding Formula Industry Revenue Share (%), by End User 2024 & 2032
- Figure 18: North America Enteral Feeding Formula Industry Revenue (Million), by Distributuion Channel 2024 & 2032
- Figure 19: North America Enteral Feeding Formula Industry Revenue Share (%), by Distributuion Channel 2024 & 2032
- Figure 20: North America Enteral Feeding Formula Industry Revenue (Million), by Country 2024 & 2032
- Figure 21: North America Enteral Feeding Formula Industry Revenue Share (%), by Country 2024 & 2032
- Figure 22: Europe Enteral Feeding Formula Industry Revenue (Million), by Product 2024 & 2032
- Figure 23: Europe Enteral Feeding Formula Industry Revenue Share (%), by Product 2024 & 2032
- Figure 24: Europe Enteral Feeding Formula Industry Revenue (Million), by Application 2024 & 2032
- Figure 25: Europe Enteral Feeding Formula Industry Revenue Share (%), by Application 2024 & 2032
- Figure 26: Europe Enteral Feeding Formula Industry Revenue (Million), by End User 2024 & 2032
- Figure 27: Europe Enteral Feeding Formula Industry Revenue Share (%), by End User 2024 & 2032
- Figure 28: Europe Enteral Feeding Formula Industry Revenue (Million), by Distributuion Channel 2024 & 2032
- Figure 29: Europe Enteral Feeding Formula Industry Revenue Share (%), by Distributuion Channel 2024 & 2032
- Figure 30: Europe Enteral Feeding Formula Industry Revenue (Million), by Country 2024 & 2032
- Figure 31: Europe Enteral Feeding Formula Industry Revenue Share (%), by Country 2024 & 2032
- Figure 32: Asia Pacific Enteral Feeding Formula Industry Revenue (Million), by Product 2024 & 2032
- Figure 33: Asia Pacific Enteral Feeding Formula Industry Revenue Share (%), by Product 2024 & 2032
- Figure 34: Asia Pacific Enteral Feeding Formula Industry Revenue (Million), by Application 2024 & 2032
- Figure 35: Asia Pacific Enteral Feeding Formula Industry Revenue Share (%), by Application 2024 & 2032
- Figure 36: Asia Pacific Enteral Feeding Formula Industry Revenue (Million), by End User 2024 & 2032
- Figure 37: Asia Pacific Enteral Feeding Formula Industry Revenue Share (%), by End User 2024 & 2032
- Figure 38: Asia Pacific Enteral Feeding Formula Industry Revenue (Million), by Distributuion Channel 2024 & 2032
- Figure 39: Asia Pacific Enteral Feeding Formula Industry Revenue Share (%), by Distributuion Channel 2024 & 2032
- Figure 40: Asia Pacific Enteral Feeding Formula Industry Revenue (Million), by Country 2024 & 2032
- Figure 41: Asia Pacific Enteral Feeding Formula Industry Revenue Share (%), by Country 2024 & 2032
- Figure 42: Middle East and Africa Enteral Feeding Formula Industry Revenue (Million), by Product 2024 & 2032
- Figure 43: Middle East and Africa Enteral Feeding Formula Industry Revenue Share (%), by Product 2024 & 2032
- Figure 44: Middle East and Africa Enteral Feeding Formula Industry Revenue (Million), by Application 2024 & 2032
- Figure 45: Middle East and Africa Enteral Feeding Formula Industry Revenue Share (%), by Application 2024 & 2032
- Figure 46: Middle East and Africa Enteral Feeding Formula Industry Revenue (Million), by End User 2024 & 2032
- Figure 47: Middle East and Africa Enteral Feeding Formula Industry Revenue Share (%), by End User 2024 & 2032
- Figure 48: Middle East and Africa Enteral Feeding Formula Industry Revenue (Million), by Distributuion Channel 2024 & 2032
- Figure 49: Middle East and Africa Enteral Feeding Formula Industry Revenue Share (%), by Distributuion Channel 2024 & 2032
- Figure 50: Middle East and Africa Enteral Feeding Formula Industry Revenue (Million), by Country 2024 & 2032
- Figure 51: Middle East and Africa Enteral Feeding Formula Industry Revenue Share (%), by Country 2024 & 2032
- Figure 52: South America Enteral Feeding Formula Industry Revenue (Million), by Product 2024 & 2032
- Figure 53: South America Enteral Feeding Formula Industry Revenue Share (%), by Product 2024 & 2032
- Figure 54: South America Enteral Feeding Formula Industry Revenue (Million), by Application 2024 & 2032
- Figure 55: South America Enteral Feeding Formula Industry Revenue Share (%), by Application 2024 & 2032
- Figure 56: South America Enteral Feeding Formula Industry Revenue (Million), by End User 2024 & 2032
- Figure 57: South America Enteral Feeding Formula Industry Revenue Share (%), by End User 2024 & 2032
- Figure 58: South America Enteral Feeding Formula Industry Revenue (Million), by Distributuion Channel 2024 & 2032
- Figure 59: South America Enteral Feeding Formula Industry Revenue Share (%), by Distributuion Channel 2024 & 2032
- Figure 60: South America Enteral Feeding Formula Industry Revenue (Million), by Country 2024 & 2032
- Figure 61: South America Enteral Feeding Formula Industry Revenue Share (%), by Country 2024 & 2032
List of Tables
- Table 1: Global Enteral Feeding Formula Industry Revenue Million Forecast, by Region 2019 & 2032
- Table 2: Global Enteral Feeding Formula Industry Revenue Million Forecast, by Product 2019 & 2032
- Table 3: Global Enteral Feeding Formula Industry Revenue Million Forecast, by Application 2019 & 2032
- Table 4: Global Enteral Feeding Formula Industry Revenue Million Forecast, by End User 2019 & 2032
- Table 5: Global Enteral Feeding Formula Industry Revenue Million Forecast, by Distributuion Channel 2019 & 2032
- Table 6: Global Enteral Feeding Formula Industry Revenue Million Forecast, by Region 2019 & 2032
- Table 7: Global Enteral Feeding Formula Industry Revenue Million Forecast, by Country 2019 & 2032
- Table 8: United States Enteral Feeding Formula Industry Revenue (Million) Forecast, by Application 2019 & 2032
- Table 9: Canada Enteral Feeding Formula Industry Revenue (Million) Forecast, by Application 2019 & 2032
- Table 10: Mexico Enteral Feeding Formula Industry Revenue (Million) Forecast, by Application 2019 & 2032
- Table 11: Global Enteral Feeding Formula Industry Revenue Million Forecast, by Country 2019 & 2032
- Table 12: Brazil Enteral Feeding Formula Industry Revenue (Million) Forecast, by Application 2019 & 2032
- Table 13: Mexico Enteral Feeding Formula Industry Revenue (Million) Forecast, by Application 2019 & 2032
- Table 14: Rest of South America Enteral Feeding Formula Industry Revenue (Million) Forecast, by Application 2019 & 2032
- Table 15: Global Enteral Feeding Formula Industry Revenue Million Forecast, by Country 2019 & 2032
- Table 16: United Kingdom Enteral Feeding Formula Industry Revenue (Million) Forecast, by Application 2019 & 2032
- Table 17: Germany Enteral Feeding Formula Industry Revenue (Million) Forecast, by Application 2019 & 2032
- Table 18: France Enteral Feeding Formula Industry Revenue (Million) Forecast, by Application 2019 & 2032
- Table 19: Italy Enteral Feeding Formula Industry Revenue (Million) Forecast, by Application 2019 & 2032
- Table 20: Spain Enteral Feeding Formula Industry Revenue (Million) Forecast, by Application 2019 & 2032
- Table 21: Russia Enteral Feeding Formula Industry Revenue (Million) Forecast, by Application 2019 & 2032
- Table 22: Rest of Europe Enteral Feeding Formula Industry Revenue (Million) Forecast, by Application 2019 & 2032
- Table 23: Global Enteral Feeding Formula Industry Revenue Million Forecast, by Country 2019 & 2032
- Table 24: China Enteral Feeding Formula Industry Revenue (Million) Forecast, by Application 2019 & 2032
- Table 25: Japan Enteral Feeding Formula Industry Revenue (Million) Forecast, by Application 2019 & 2032
- Table 26: India Enteral Feeding Formula Industry Revenue (Million) Forecast, by Application 2019 & 2032
- Table 27: South Korea Enteral Feeding Formula Industry Revenue (Million) Forecast, by Application 2019 & 2032
- Table 28: Taiwan Enteral Feeding Formula Industry Revenue (Million) Forecast, by Application 2019 & 2032
- Table 29: Australia Enteral Feeding Formula Industry Revenue (Million) Forecast, by Application 2019 & 2032
- Table 30: Rest of Asia-Pacific Enteral Feeding Formula Industry Revenue (Million) Forecast, by Application 2019 & 2032
- Table 31: Global Enteral Feeding Formula Industry Revenue Million Forecast, by Country 2019 & 2032
- Table 32: Middle East Enteral Feeding Formula Industry Revenue (Million) Forecast, by Application 2019 & 2032
- Table 33: Africa Enteral Feeding Formula Industry Revenue (Million) Forecast, by Application 2019 & 2032
- Table 34: Global Enteral Feeding Formula Industry Revenue Million Forecast, by Product 2019 & 2032
- Table 35: Global Enteral Feeding Formula Industry Revenue Million Forecast, by Application 2019 & 2032
- Table 36: Global Enteral Feeding Formula Industry Revenue Million Forecast, by End User 2019 & 2032
- Table 37: Global Enteral Feeding Formula Industry Revenue Million Forecast, by Distributuion Channel 2019 & 2032
- Table 38: Global Enteral Feeding Formula Industry Revenue Million Forecast, by Country 2019 & 2032
- Table 39: United States Enteral Feeding Formula Industry Revenue (Million) Forecast, by Application 2019 & 2032
- Table 40: Canada Enteral Feeding Formula Industry Revenue (Million) Forecast, by Application 2019 & 2032
- Table 41: Mexico Enteral Feeding Formula Industry Revenue (Million) Forecast, by Application 2019 & 2032
- Table 42: Global Enteral Feeding Formula Industry Revenue Million Forecast, by Product 2019 & 2032
- Table 43: Global Enteral Feeding Formula Industry Revenue Million Forecast, by Application 2019 & 2032
- Table 44: Global Enteral Feeding Formula Industry Revenue Million Forecast, by End User 2019 & 2032
- Table 45: Global Enteral Feeding Formula Industry Revenue Million Forecast, by Distributuion Channel 2019 & 2032
- Table 46: Global Enteral Feeding Formula Industry Revenue Million Forecast, by Country 2019 & 2032
- Table 47: Germany Enteral Feeding Formula Industry Revenue (Million) Forecast, by Application 2019 & 2032
- Table 48: United Kingdom Enteral Feeding Formula Industry Revenue (Million) Forecast, by Application 2019 & 2032
- Table 49: France Enteral Feeding Formula Industry Revenue (Million) Forecast, by Application 2019 & 2032
- Table 50: Italy Enteral Feeding Formula Industry Revenue (Million) Forecast, by Application 2019 & 2032
- Table 51: Spain Enteral Feeding Formula Industry Revenue (Million) Forecast, by Application 2019 & 2032
- Table 52: Rest of Europe Enteral Feeding Formula Industry Revenue (Million) Forecast, by Application 2019 & 2032
- Table 53: Global Enteral Feeding Formula Industry Revenue Million Forecast, by Product 2019 & 2032
- Table 54: Global Enteral Feeding Formula Industry Revenue Million Forecast, by Application 2019 & 2032
- Table 55: Global Enteral Feeding Formula Industry Revenue Million Forecast, by End User 2019 & 2032
- Table 56: Global Enteral Feeding Formula Industry Revenue Million Forecast, by Distributuion Channel 2019 & 2032
- Table 57: Global Enteral Feeding Formula Industry Revenue Million Forecast, by Country 2019 & 2032
- Table 58: China Enteral Feeding Formula Industry Revenue (Million) Forecast, by Application 2019 & 2032
- Table 59: Japan Enteral Feeding Formula Industry Revenue (Million) Forecast, by Application 2019 & 2032
- Table 60: India Enteral Feeding Formula Industry Revenue (Million) Forecast, by Application 2019 & 2032
- Table 61: Australia Enteral Feeding Formula Industry Revenue (Million) Forecast, by Application 2019 & 2032
- Table 62: South Korea Enteral Feeding Formula Industry Revenue (Million) Forecast, by Application 2019 & 2032
- Table 63: Rest of Asia Pacific Enteral Feeding Formula Industry Revenue (Million) Forecast, by Application 2019 & 2032
- Table 64: Global Enteral Feeding Formula Industry Revenue Million Forecast, by Product 2019 & 2032
- Table 65: Global Enteral Feeding Formula Industry Revenue Million Forecast, by Application 2019 & 2032
- Table 66: Global Enteral Feeding Formula Industry Revenue Million Forecast, by End User 2019 & 2032
- Table 67: Global Enteral Feeding Formula Industry Revenue Million Forecast, by Distributuion Channel 2019 & 2032
- Table 68: Global Enteral Feeding Formula Industry Revenue Million Forecast, by Country 2019 & 2032
- Table 69: GCC Enteral Feeding Formula Industry Revenue (Million) Forecast, by Application 2019 & 2032
- Table 70: South Africa Enteral Feeding Formula Industry Revenue (Million) Forecast, by Application 2019 & 2032
- Table 71: Rest of Middle East and Africa Enteral Feeding Formula Industry Revenue (Million) Forecast, by Application 2019 & 2032
- Table 72: Global Enteral Feeding Formula Industry Revenue Million Forecast, by Product 2019 & 2032
- Table 73: Global Enteral Feeding Formula Industry Revenue Million Forecast, by Application 2019 & 2032
- Table 74: Global Enteral Feeding Formula Industry Revenue Million Forecast, by End User 2019 & 2032
- Table 75: Global Enteral Feeding Formula Industry Revenue Million Forecast, by Distributuion Channel 2019 & 2032
- Table 76: Global Enteral Feeding Formula Industry Revenue Million Forecast, by Country 2019 & 2032
- Table 77: Brazil Enteral Feeding Formula Industry Revenue (Million) Forecast, by Application 2019 & 2032
- Table 78: Argentina Enteral Feeding Formula Industry Revenue (Million) Forecast, by Application 2019 & 2032
- Table 79: Rest of South America Enteral Feeding Formula Industry Revenue (Million) Forecast, by Application 2019 & 2032
Frequently Asked Questions
1. What is the projected Compound Annual Growth Rate (CAGR) of the Enteral Feeding Formula Industry?
The projected CAGR is approximately 5.18%.
2. Which companies are prominent players in the Enteral Feeding Formula Industry?
Key companies in the market include Nestle SA, Fresenius SE & Co KgaA (Fresenius Kabi AG), Meiji Holdings Co Ltd, Global Health Product Inc, Abbott Laboratories, Danone SA (Nutricia), Functional Formularies*List Not Exhaustive, Hormel Foods Corporation, B Braun Melsungen AG, Victus Inc, Reckitt Benckiser Group plc (Mead Johnson), Kate Farms.
3. What are the main segments of the Enteral Feeding Formula Industry?
The market segments include Product, Application, End User, Distributuion Channel.
4. Can you provide details about the market size?
The market size is estimated to be USD 8.77 Million as of 2022.
5. What are some drivers contributing to market growth?
Increasing Prevalence of Metabolic and Chronic Diseases; Increasing Spending on Patient Care; Growing Geriatric Population.
6. What are the notable trends driving market growth?
Oncology Segment is Expected to Hold a Significant Market Share in the Enteral Feeding Formulas Market.
7. Are there any restraints impacting market growth?
Complications Associated with Enteral Nutrition; High Cost and Low Adherence Rates in Developing Countries.
8. Can you provide examples of recent developments in the market?
September 2022: Kate Farms raised USD 75 million in a Series C funding round led by life-science investor Novo Holdings. With this, Kate Farms will be able to increase its efforts in developing plant-based clinical nutrition research, product innovation, and development into more channels.
9. What pricing options are available for accessing the report?
Pricing options include single-user, multi-user, and enterprise licenses priced at USD 4750, USD 5250, and USD 8750 respectively.
10. Is the market size provided in terms of value or volume?
The market size is provided in terms of value, measured in Million.
11. Are there any specific market keywords associated with the report?
Yes, the market keyword associated with the report is "Enteral Feeding Formula Industry," which aids in identifying and referencing the specific market segment covered.
12. How do I determine which pricing option suits my needs best?
The pricing options vary based on user requirements and access needs. Individual users may opt for single-user licenses, while businesses requiring broader access may choose multi-user or enterprise licenses for cost-effective access to the report.
13. Are there any additional resources or data provided in the Enteral Feeding Formula Industry report?
While the report offers comprehensive insights, it's advisable to review the specific contents or supplementary materials provided to ascertain if additional resources or data are available.
14. How can I stay updated on further developments or reports in the Enteral Feeding Formula Industry?
To stay informed about further developments, trends, and reports in the Enteral Feeding Formula Industry, consider subscribing to industry newsletters, following relevant companies and organizations, or regularly checking reputable industry news sources and publications.
Methodology
Step 1 - Identification of Relevant Samples Size from Population Database


Step 2 - Approaches for Defining Global Market Size (Value, Volume* & Price*)

Note*: In applicable scenarios
Step 3 - Data Sources
Primary Research
- Web Analytics
- Survey Reports
- Research Institute
- Latest Research Reports
- Opinion Leaders
Secondary Research
- Annual Reports
- White Paper
- Latest Press Release
- Industry Association
- Paid Database
- Investor Presentations

Step 4 - Data Triangulation
Involves using different sources of information in order to increase the validity of a study
These sources are likely to be stakeholders in a program - participants, other researchers, program staff, other community members, and so on.
Then we put all data in single framework & apply various statistical tools to find out the dynamic on the market.
During the analysis stage, feedback from the stakeholder groups would be compared to determine areas of agreement as well as areas of divergence


