

Key Insights
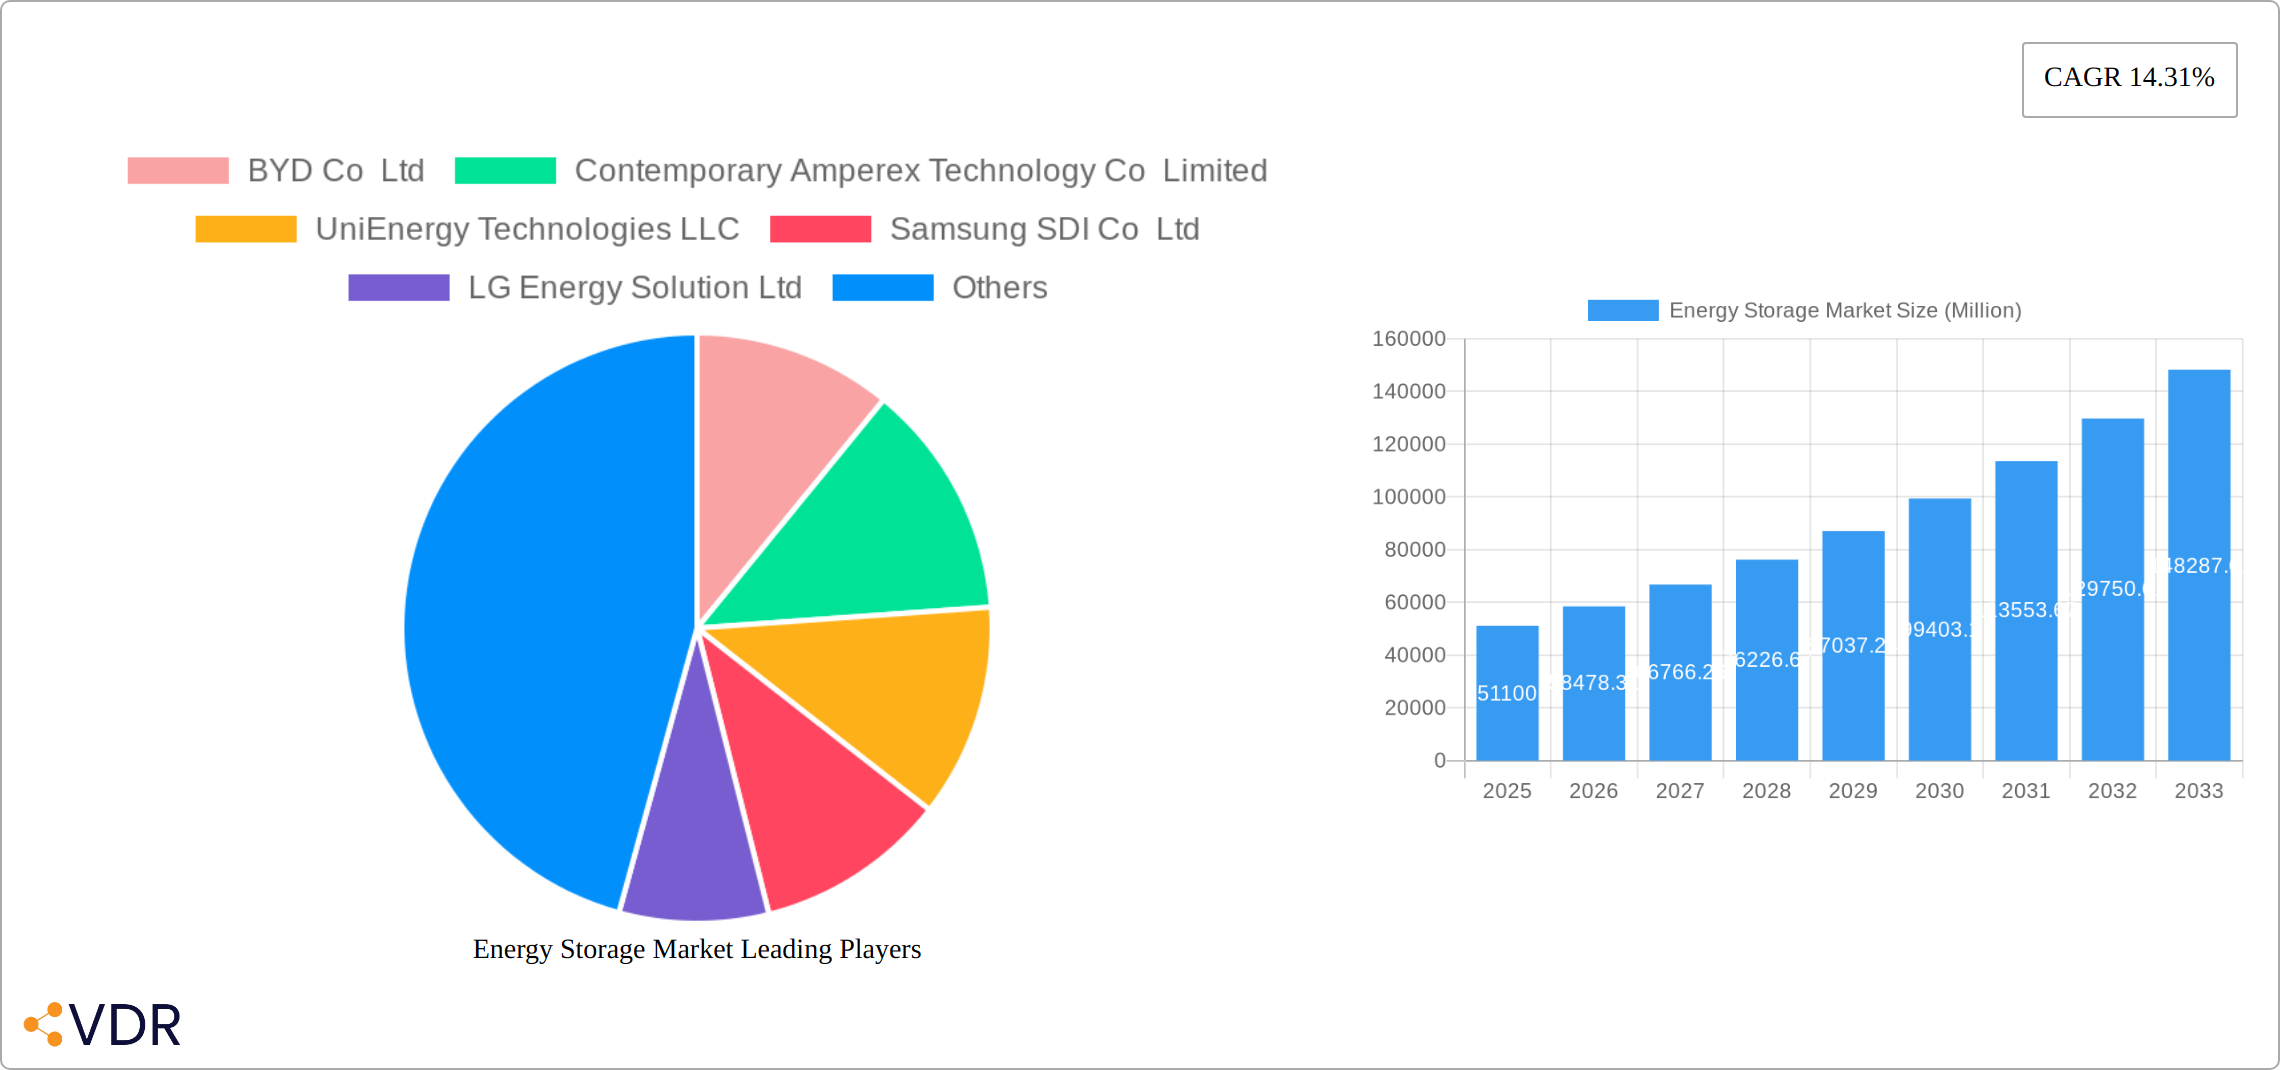
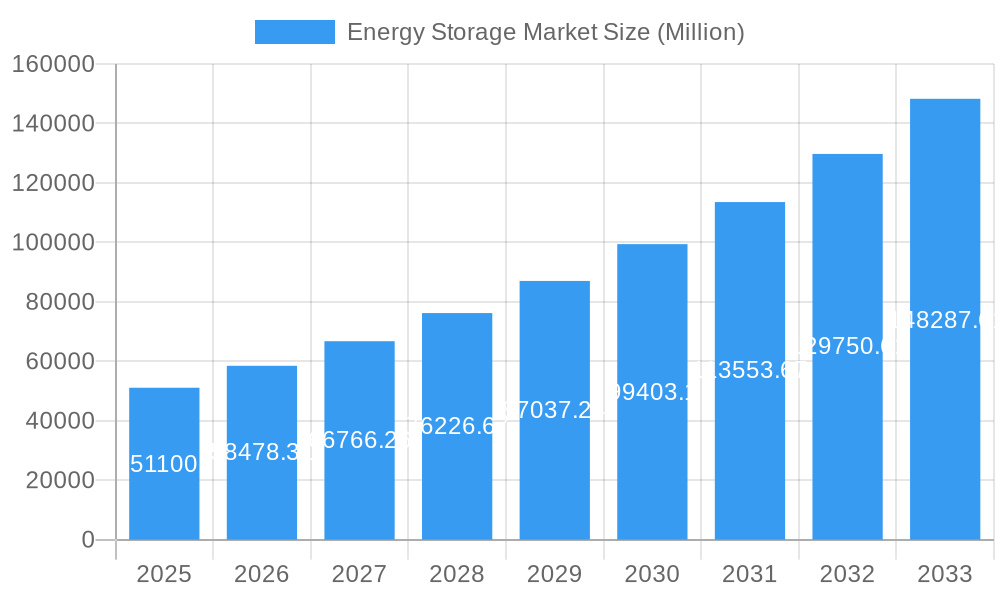
The global energy storage market, valued at $51.10 billion in 2025, is experiencing robust growth, projected to expand at a Compound Annual Growth Rate (CAGR) of 14.31% from 2025 to 2033. This surge is driven by several key factors. The increasing adoption of renewable energy sources like solar and wind power necessitates efficient energy storage solutions to address their intermittency. Furthermore, rising electricity prices and growing concerns about energy security are pushing both residential and commercial sectors towards energy storage technologies. Government incentives and policies promoting clean energy are also playing a significant role in market expansion. Technological advancements leading to improved battery efficiency, reduced costs, and enhanced lifespan are further fueling this growth trajectory. The market is segmented by storage type (batteries dominating, followed by pumped-storage hydroelectricity, thermal energy storage, flywheel energy storage, and others) and application (residential, commercial, and industrial). Batteries currently hold the largest market share due to their versatility and widespread application across diverse sectors. However, other technologies like PSH are expected to witness significant growth, particularly in large-scale energy storage projects. Geographic distribution shows strong growth across North America and Asia-Pacific, driven by significant investments in renewable energy infrastructure and supportive government policies in key regions like the United States, China, and India. Competition is fierce, with major players like BYD, CATL, Tesla, and LG Energy Solution vying for market leadership through innovation and strategic partnerships.
Energy Storage Market Market Size (In Billion)
The forecast period of 2025-2033 will likely witness continued market consolidation as larger players acquire smaller companies and expand their product portfolios. The focus will shift towards improving the cost-effectiveness and sustainability of energy storage solutions. Research and development efforts are likely to focus on improving the energy density, lifespan, and safety of various battery chemistries, particularly solid-state batteries. Moreover, the integration of energy storage systems with smart grids and advanced energy management systems will be crucial to optimize grid stability and efficiency. The increasing demand for grid-scale energy storage solutions to support the integration of renewable energy sources will drive substantial growth in the coming years. Challenges remain, including the high initial investment costs of some energy storage technologies and the need for improved recycling infrastructure to mitigate environmental concerns related to battery disposal.
Energy Storage Market Company Market Share
Energy Storage Market: A Comprehensive Report (2019-2033)
This comprehensive report provides an in-depth analysis of the global energy storage market, encompassing historical data (2019-2024), current estimates (2025), and future forecasts (2025-2033). It delves into market dynamics, growth trends, regional dominance, product landscapes, key players, and emerging opportunities across various segments, including batteries, pumped-storage hydroelectricity, and thermal energy storage. The report is essential for industry professionals, investors, and strategists seeking a granular understanding of this rapidly evolving market. The market size is projected to reach xx Million units by 2033.
Energy Storage Market Market Dynamics & Structure
This section analyzes the competitive landscape of the energy storage market, exploring market concentration, technological innovation drivers, regulatory frameworks, competitive substitutes, end-user demographics, and M&A activities. The analysis incorporates both quantitative and qualitative insights, providing a holistic view of the market's structure and dynamics.
- Market Concentration: The market exhibits a moderately concentrated structure, with key players like BYD Co Ltd, Contemporary Amperex Technology Co Limited, and Tesla Inc holding significant market share. However, a growing number of smaller players are emerging, increasing competition. We estimate the top 5 players hold approximately xx% of the market share in 2025.
- Technological Innovation: Continuous advancements in battery technology, particularly in lithium-ion batteries, are driving market growth. Innovation in other storage technologies like pumped-storage hydroelectricity (PSH) and thermal energy storage (TES) is also significant, albeit at a slower pace. Barriers to innovation include high R&D costs and the need for robust safety standards.
- Regulatory Frameworks: Government policies and incentives promoting renewable energy integration are crucial drivers. Stringent emission reduction targets and carbon pricing mechanisms are further accelerating market adoption. Variations in regulatory frameworks across different regions influence market growth differentially.
- Competitive Substitutes: Other energy sources, such as fossil fuels and nuclear power, still compete with energy storage solutions. The competitiveness of these substitutes is largely determined by factors like cost, reliability, and environmental impact.
- End-User Demographics: The residential, commercial, and industrial sectors are the primary end-users of energy storage systems, with varying adoption rates based on specific energy needs, economic factors and technological suitability. The industrial sector is expected to witness the highest growth due to its increasing energy demands.
- M&A Trends: The energy storage sector has witnessed a significant number of mergers and acquisitions in recent years, driven by the need for technological consolidation, market expansion, and securing supply chains. We estimate xx M&A deals occurred between 2019 and 2024.
Energy Storage Market Growth Trends & Insights
This section provides a detailed analysis of the energy storage market's growth trajectory, leveraging both quantitative data and qualitative insights. It examines market size evolution, adoption rates across different segments (residential, commercial & industrial), and the impact of technological advancements and consumer behavior shifts.
The global energy storage market has demonstrated substantial growth in recent years, driven by several factors including increasing electricity prices, growing demand for renewable energy sources, and supportive government policies. The market is projected to experience a CAGR of xx% during the forecast period (2025-2033), reaching a market size of xx Million units by 2033. This growth is fueled by technological advancements that continuously improve energy density and reduce costs, and by shifting consumer preferences favoring sustainable energy solutions. The adoption rate for energy storage systems, particularly batteries, is expected to increase significantly, with market penetration rates expected to reach xx% by 2033, especially within the residential segment.
Dominant Regions, Countries, or Segments in Energy Storage Market
This section identifies the leading regions, countries, and segments within the energy storage market, analyzing factors driving their growth and dominance.
- Leading Region/Country: Asia-Pacific, particularly China, is expected to remain the dominant region, driven by strong government support, significant investments in renewable energy, and a large consumer base. The European Union is also witnessing significant growth due to its ambitious renewable energy targets and supportive regulatory frameworks. The United States is also a significant market.
- Dominant Segments: The battery segment, specifically lithium-ion batteries, is currently the dominant type within the energy storage market, owing to its high energy density and relatively lower cost compared to other technologies. However, Pumped-storage Hydroelectricity (PSH) still holds a significant market share, particularly in regions with suitable geographical conditions.
Key Drivers:
- Government policies and incentives: Subsidies, tax credits, and renewable energy mandates significantly drive market adoption.
- Falling costs of renewable energy technologies: The decreasing cost of solar and wind energy makes energy storage economically viable.
- Increasing electricity prices: Higher electricity costs make energy storage a more attractive investment option.
- Grid modernization and stability: Energy storage systems are crucial for enhancing grid stability and reliability.
Dominance Factors:
- Market size: China's massive energy storage market significantly contributes to its regional dominance.
- Technological advancements: Rapid technological advancements in battery technology enhance performance and reduce costs, stimulating growth.
- Government support: Policies promoting renewable energy integration directly affect market expansion.
Energy Storage Market Product Landscape
The energy storage market showcases a diverse range of products, including lithium-ion batteries, PSH, TES, FES, and other emerging technologies. Lithium-ion batteries are currently dominant due to their high energy density and relatively low cost. Recent innovations focus on improving battery lifespan, safety, and charging efficiency. Advancements in PSH aim at optimizing system efficiency and reducing environmental impact. TES technologies are seeing progress in materials and designs, aiming for higher energy storage capacity and improved thermal efficiency. Flywheel energy storage is finding niche applications where rapid response times are critical.
Key Drivers, Barriers & Challenges in Energy Storage Market
Key Drivers:
- Growth of renewable energy sources: The intermittent nature of solar and wind power necessitates efficient and scalable energy storage solutions to ensure a consistent energy supply and maximize the utilization of renewable energy resources. This is driving significant investment in energy storage technologies.
- Enhanced Grid Stability and Reliability: Energy storage systems play a crucial role in improving grid stability and resilience. They can provide fast-responding power to balance fluctuations in renewable energy generation and meet peak demand, reducing the risk of blackouts and enhancing overall grid reliability.
- Government Regulations and Incentives: Many governments worldwide are actively promoting the adoption of energy storage through supportive policies, including subsidies, tax incentives, and renewable portfolio standards (RPS) that mandate a certain percentage of electricity generation from renewable sources. These initiatives are accelerating market growth and attracting investment.
- Decarbonization Goals: The global push towards decarbonization and reducing greenhouse gas emissions is a major driver for energy storage. Energy storage is essential for enabling a cleaner energy transition by integrating larger amounts of renewable energy into the electricity grid and reducing reliance on fossil fuels.
Key Barriers and Challenges:
- High Initial Capital Expenditures (CAPEX): The upfront costs associated with purchasing and installing energy storage systems remain a significant barrier, particularly for residential and small commercial consumers. This necessitates innovative financing models and cost-reduction strategies.
- Lifecycle Management and Sustainability Concerns: The limited lifespan of certain battery technologies and the environmental impacts associated with battery manufacturing, use, and recycling pose significant challenges. Research and development focused on extending battery lifespan, improving recycling processes, and developing sustainable battery chemistries are crucial to address these concerns.
- Intermittency of Renewable Energy Sources: The intermittent nature of solar and wind power necessitates effective energy storage to mitigate supply disruptions and ensure a continuous power supply. Technological advancements are needed to enhance the efficiency and cost-effectiveness of storage solutions tailored to this challenge. Furthermore, sophisticated grid management strategies are essential to integrate intermittent renewables effectively.
- Technological Limitations: While advancements are continuous, some energy storage technologies still face limitations in terms of energy density, efficiency, lifespan, and safety. Ongoing research and development efforts are essential to overcome these limitations and improve the performance and reliability of energy storage systems.
Emerging Opportunities in Energy Storage Market
- Microgrids: The increasing adoption of microgrids, localized energy systems that can operate independently from the main grid, presents significant opportunities for energy storage. Microgrids utilize energy storage to enhance reliability, resilience, and efficiency, particularly in remote areas or areas prone to power outages.
- Electric Vehicle (EV) Integration: The rapid growth of the electric vehicle market is driving significant demand for energy storage solutions for vehicle batteries and charging infrastructure. Vehicle-to-grid (V2G) technology, which allows EVs to feed power back into the grid, offers further opportunities.
- Grid-scale Energy Storage: Large-scale energy storage projects are essential for managing the integration of renewable energy sources, improving grid stability, and ensuring a reliable power supply. This segment is expected to experience substantial growth in the coming years.
- Energy Storage as a Service (ESaaS): The emergence of ESaaS business models offers new opportunities for both providers and consumers. ESaaS allows consumers to access energy storage capacity without the need for large upfront investments, making the technology more accessible.
Growth Accelerators in the Energy Storage Market Industry
Technological breakthroughs in battery chemistry, significantly improving energy density while simultaneously reducing costs, are key growth accelerators. Strategic partnerships between energy storage companies, renewable energy developers, and grid operators are fostering market expansion and driving innovation. Government initiatives, including supportive regulatory frameworks, financial incentives, and research funding, are crucial for stimulating long-term growth and accelerating market adoption.
Key Players Shaping the Energy Storage Market Market
- BYD Co Ltd
- Contemporary Amperex Technology Co Limited
- UniEnergy Technologies LLC
- Samsung SDI Co Ltd
- LG Energy Solution Ltd
- NGK Insulators Ltd
- Tesla Inc
- Clarios (Formerly Johnson Controls International PLC)
- GS Yuasa Corporation
- Fluence Energy
Notable Milestones in Energy Storage Market Sector
- February 2022: The partnership between FIMER and Vega Solar supplied 14 PVS-100 inverters to Albania, showcasing the growing adoption of decentralized solar systems with integrated energy storage.
- May 2022: Salient Energy's partnership with Horton World Solutions highlights the increasing interest in alternative battery technologies like zinc-ion for residential applications.
In-Depth Energy Storage Market Market Outlook
The future of the energy storage market is exceptionally promising, fueled by the convergence of technological advancements, supportive government policies, and the urgent global need for reliable and sustainable energy solutions. Strategic collaborations, market diversification into developing economies, and the increasing integration of energy storage into diverse applications, such as data centers and industrial processes, will further propel market growth. The market is poised for significant expansion across all segments, with grid-scale storage and EV integration poised for particularly rapid growth. The overall outlook strongly suggests a robust and sustained growth trajectory for the energy storage market over the next decade and beyond.
Energy Storage Market Segmentation
-
1. Type
- 1.1. Batteries
- 1.2. Pumped-storage Hydroelectricity (PSH)
- 1.3. Thermal Energy Storage (TES)
- 1.4. Flywheel Energy Storage (FES)
- 1.5. Other Types
-
2. Application
- 2.1. Residential
- 2.2. Commercial and Industrial
Energy Storage Market Segmentation By Geography
-
1. North America
- 1.1. United States
- 1.2. Canada
- 1.3. Rest of North America
-
2. Asia Pacific
- 2.1. India
- 2.2. China
- 2.3. Australia
- 2.4. Rest of Asia Pacific
-
3. Europe
- 3.1. Germany
- 3.2. United Kingdom
- 3.3. Rest of Europe
-
4. South America
- 4.1. Brazil
- 4.2. Argentina
- 4.3. Rest of South America
-
5. Middle East and Africa
- 5.1. Saudi Arabia
- 5.2. Iraq
- 5.3. Jordan
- 5.4. Rest of Middle East and Africa
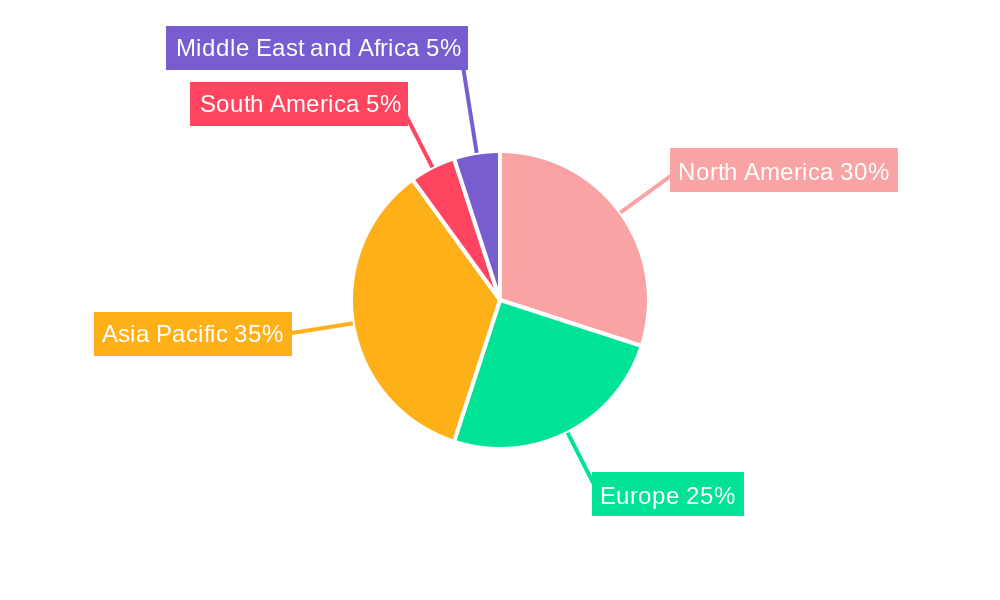
Energy Storage Market Regional Market Share
Geographic Coverage of Energy Storage Market
Energy Storage Market REPORT HIGHLIGHTS
| Aspects | Details |
|---|---|
| Study Period | 2020-2034 |
| Base Year | 2025 |
| Estimated Year | 2026 |
| Forecast Period | 2026-2034 |
| Historical Period | 2020-2025 |
| Growth Rate | CAGR of 14.31% from 2020-2034 |
| Segmentation |
|
Table of Contents
- 1. Introduction
- 1.1. Research Scope
- 1.2. Market Segmentation
- 1.3. Research Objective
- 1.4. Definitions and Assumptions
- 2. Executive Summary
- 2.1. Market Snapshot
- 3. Market Dynamics
- 3.1. Market Drivers
- 3.2. Market Restrains
- 3.3. Market Trends
- 3.4. Market Opportunities
- 4. Market Factor Analysis
- 4.1. Porters Five Forces
- 4.1.1. Bargaining Power of Suppliers
- 4.1.2. Bargaining Power of Buyers
- 4.1.3. Threat of New Entrants
- 4.1.4. Threat of Substitutes
- 4.1.5. Competitive Rivalry
- 4.2. PESTEL analysis
- 4.3. BCG Analysis
- 4.3.1. Stars (High Growth, High Market Share)
- 4.3.2. Cash Cows (Low Growth, High Market Share)
- 4.3.3. Question Mark (High Growth, Low Market Share)
- 4.3.4. Dogs (Low Growth, Low Market Share)
- 4.4. Ansoff Matrix Analysis
- 4.5. Supply Chain Analysis
- 4.6. Regulatory Landscape
- 4.7. Current Market Potential and Opportunity Assessment (TAM–SAM–SOM Framework)
- 4.8. VDR Analyst Note
- 4.1. Porters Five Forces
- 5. Market Analysis, Insights and Forecast 2021-2033
- 5.1. Market Analysis, Insights and Forecast - by Type
- 5.1.1. Batteries
- 5.1.2. Pumped-storage Hydroelectricity (PSH)
- 5.1.3. Thermal Energy Storage (TES)
- 5.1.4. Flywheel Energy Storage (FES)
- 5.1.5. Other Types
- 5.2. Market Analysis, Insights and Forecast - by Application
- 5.2.1. Residential
- 5.2.2. Commercial and Industrial
- 5.3. Market Analysis, Insights and Forecast - by Region
- 5.3.1. North America
- 5.3.2. Asia Pacific
- 5.3.3. Europe
- 5.3.4. South America
- 5.3.5. Middle East and Africa
- 5.1. Market Analysis, Insights and Forecast - by Type
- 6. Global Energy Storage Market Analysis, Insights and Forecast, 2021-2033
- 6.1. Market Analysis, Insights and Forecast - by Type
- 6.1.1. Batteries
- 6.1.2. Pumped-storage Hydroelectricity (PSH)
- 6.1.3. Thermal Energy Storage (TES)
- 6.1.4. Flywheel Energy Storage (FES)
- 6.1.5. Other Types
- 6.2. Market Analysis, Insights and Forecast - by Application
- 6.2.1. Residential
- 6.2.2. Commercial and Industrial
- 6.1. Market Analysis, Insights and Forecast - by Type
- 7. North America Energy Storage Market Analysis, Insights and Forecast, 2021-2033
- 7.1. Market Analysis, Insights and Forecast - by Type
- 7.1.1. Batteries
- 7.1.2. Pumped-storage Hydroelectricity (PSH)
- 7.1.3. Thermal Energy Storage (TES)
- 7.1.4. Flywheel Energy Storage (FES)
- 7.1.5. Other Types
- 7.2. Market Analysis, Insights and Forecast - by Application
- 7.2.1. Residential
- 7.2.2. Commercial and Industrial
- 7.1. Market Analysis, Insights and Forecast - by Type
- 8. Asia Pacific Energy Storage Market Analysis, Insights and Forecast, 2021-2033
- 8.1. Market Analysis, Insights and Forecast - by Type
- 8.1.1. Batteries
- 8.1.2. Pumped-storage Hydroelectricity (PSH)
- 8.1.3. Thermal Energy Storage (TES)
- 8.1.4. Flywheel Energy Storage (FES)
- 8.1.5. Other Types
- 8.2. Market Analysis, Insights and Forecast - by Application
- 8.2.1. Residential
- 8.2.2. Commercial and Industrial
- 8.1. Market Analysis, Insights and Forecast - by Type
- 9. Europe Energy Storage Market Analysis, Insights and Forecast, 2021-2033
- 9.1. Market Analysis, Insights and Forecast - by Type
- 9.1.1. Batteries
- 9.1.2. Pumped-storage Hydroelectricity (PSH)
- 9.1.3. Thermal Energy Storage (TES)
- 9.1.4. Flywheel Energy Storage (FES)
- 9.1.5. Other Types
- 9.2. Market Analysis, Insights and Forecast - by Application
- 9.2.1. Residential
- 9.2.2. Commercial and Industrial
- 9.1. Market Analysis, Insights and Forecast - by Type
- 10. South America Energy Storage Market Analysis, Insights and Forecast, 2021-2033
- 10.1. Market Analysis, Insights and Forecast - by Type
- 10.1.1. Batteries
- 10.1.2. Pumped-storage Hydroelectricity (PSH)
- 10.1.3. Thermal Energy Storage (TES)
- 10.1.4. Flywheel Energy Storage (FES)
- 10.1.5. Other Types
- 10.2. Market Analysis, Insights and Forecast - by Application
- 10.2.1. Residential
- 10.2.2. Commercial and Industrial
- 10.1. Market Analysis, Insights and Forecast - by Type
- 11. Middle East and Africa Energy Storage Market Analysis, Insights and Forecast, 2021-2033
- 11.1. Market Analysis, Insights and Forecast - by Type
- 11.1.1. Batteries
- 11.1.2. Pumped-storage Hydroelectricity (PSH)
- 11.1.3. Thermal Energy Storage (TES)
- 11.1.4. Flywheel Energy Storage (FES)
- 11.1.5. Other Types
- 11.2. Market Analysis, Insights and Forecast - by Application
- 11.2.1. Residential
- 11.2.2. Commercial and Industrial
- 11.1. Market Analysis, Insights and Forecast - by Type
- 12. Competitive Analysis
- 12.1. Company Profiles
- 12.1.1 BYD Co Ltd
- 12.1.1.1. Company Overview
- 12.1.1.2. Products
- 12.1.1.3. Company Financials
- 12.1.1.4. SWOT Analysis
- 12.1.2 Contemporary Amperex Technology Co Limited
- 12.1.2.1. Company Overview
- 12.1.2.2. Products
- 12.1.2.3. Company Financials
- 12.1.2.4. SWOT Analysis
- 12.1.3 UniEnergy Technologies LLC
- 12.1.3.1. Company Overview
- 12.1.3.2. Products
- 12.1.3.3. Company Financials
- 12.1.3.4. SWOT Analysis
- 12.1.4 Samsung SDI Co Ltd
- 12.1.4.1. Company Overview
- 12.1.4.2. Products
- 12.1.4.3. Company Financials
- 12.1.4.4. SWOT Analysis
- 12.1.5 LG Energy Solution Ltd
- 12.1.5.1. Company Overview
- 12.1.5.2. Products
- 12.1.5.3. Company Financials
- 12.1.5.4. SWOT Analysis
- 12.1.6 NGK Insulators Ltd
- 12.1.6.1. Company Overview
- 12.1.6.2. Products
- 12.1.6.3. Company Financials
- 12.1.6.4. SWOT Analysis
- 12.1.7 Tesla Inc *List Not Exhaustive
- 12.1.7.1. Company Overview
- 12.1.7.2. Products
- 12.1.7.3. Company Financials
- 12.1.7.4. SWOT Analysis
- 12.1.8 Clarios (Formerly Johnson Controls International PLC)
- 12.1.8.1. Company Overview
- 12.1.8.2. Products
- 12.1.8.3. Company Financials
- 12.1.8.4. SWOT Analysis
- 12.1.9 GS Yuasa Corporation
- 12.1.9.1. Company Overview
- 12.1.9.2. Products
- 12.1.9.3. Company Financials
- 12.1.9.4. SWOT Analysis
- 12.1.1 BYD Co Ltd
- 12.2. Market Entropy
- 12.2.1 Company's Key Areas Served
- 12.2.2 Recent Developments
- 12.3. Company Market Share Analysis 2025
- 12.3.1 Top 5 Companies Market Share Analysis
- 12.3.2 Top 3 Companies Market Share Analysis
- 12.4. List of Potential Customers
- 13. Research Methodology
List of Figures
- Figure 1: Global Energy Storage Market Revenue Breakdown (Million, %) by Region 2025 & 2033
- Figure 2: Global Energy Storage Market Volume Breakdown (K Unit, %) by Region 2025 & 2033
- Figure 3: North America Energy Storage Market Revenue (Million), by Type 2025 & 2033
- Figure 4: North America Energy Storage Market Volume (K Unit), by Type 2025 & 2033
- Figure 5: North America Energy Storage Market Revenue Share (%), by Type 2025 & 2033
- Figure 6: North America Energy Storage Market Volume Share (%), by Type 2025 & 2033
- Figure 7: North America Energy Storage Market Revenue (Million), by Application 2025 & 2033
- Figure 8: North America Energy Storage Market Volume (K Unit), by Application 2025 & 2033
- Figure 9: North America Energy Storage Market Revenue Share (%), by Application 2025 & 2033
- Figure 10: North America Energy Storage Market Volume Share (%), by Application 2025 & 2033
- Figure 11: North America Energy Storage Market Revenue (Million), by Country 2025 & 2033
- Figure 12: North America Energy Storage Market Volume (K Unit), by Country 2025 & 2033
- Figure 13: North America Energy Storage Market Revenue Share (%), by Country 2025 & 2033
- Figure 14: North America Energy Storage Market Volume Share (%), by Country 2025 & 2033
- Figure 15: Asia Pacific Energy Storage Market Revenue (Million), by Type 2025 & 2033
- Figure 16: Asia Pacific Energy Storage Market Volume (K Unit), by Type 2025 & 2033
- Figure 17: Asia Pacific Energy Storage Market Revenue Share (%), by Type 2025 & 2033
- Figure 18: Asia Pacific Energy Storage Market Volume Share (%), by Type 2025 & 2033
- Figure 19: Asia Pacific Energy Storage Market Revenue (Million), by Application 2025 & 2033
- Figure 20: Asia Pacific Energy Storage Market Volume (K Unit), by Application 2025 & 2033
- Figure 21: Asia Pacific Energy Storage Market Revenue Share (%), by Application 2025 & 2033
- Figure 22: Asia Pacific Energy Storage Market Volume Share (%), by Application 2025 & 2033
- Figure 23: Asia Pacific Energy Storage Market Revenue (Million), by Country 2025 & 2033
- Figure 24: Asia Pacific Energy Storage Market Volume (K Unit), by Country 2025 & 2033
- Figure 25: Asia Pacific Energy Storage Market Revenue Share (%), by Country 2025 & 2033
- Figure 26: Asia Pacific Energy Storage Market Volume Share (%), by Country 2025 & 2033
- Figure 27: Europe Energy Storage Market Revenue (Million), by Type 2025 & 2033
- Figure 28: Europe Energy Storage Market Volume (K Unit), by Type 2025 & 2033
- Figure 29: Europe Energy Storage Market Revenue Share (%), by Type 2025 & 2033
- Figure 30: Europe Energy Storage Market Volume Share (%), by Type 2025 & 2033
- Figure 31: Europe Energy Storage Market Revenue (Million), by Application 2025 & 2033
- Figure 32: Europe Energy Storage Market Volume (K Unit), by Application 2025 & 2033
- Figure 33: Europe Energy Storage Market Revenue Share (%), by Application 2025 & 2033
- Figure 34: Europe Energy Storage Market Volume Share (%), by Application 2025 & 2033
- Figure 35: Europe Energy Storage Market Revenue (Million), by Country 2025 & 2033
- Figure 36: Europe Energy Storage Market Volume (K Unit), by Country 2025 & 2033
- Figure 37: Europe Energy Storage Market Revenue Share (%), by Country 2025 & 2033
- Figure 38: Europe Energy Storage Market Volume Share (%), by Country 2025 & 2033
- Figure 39: South America Energy Storage Market Revenue (Million), by Type 2025 & 2033
- Figure 40: South America Energy Storage Market Volume (K Unit), by Type 2025 & 2033
- Figure 41: South America Energy Storage Market Revenue Share (%), by Type 2025 & 2033
- Figure 42: South America Energy Storage Market Volume Share (%), by Type 2025 & 2033
- Figure 43: South America Energy Storage Market Revenue (Million), by Application 2025 & 2033
- Figure 44: South America Energy Storage Market Volume (K Unit), by Application 2025 & 2033
- Figure 45: South America Energy Storage Market Revenue Share (%), by Application 2025 & 2033
- Figure 46: South America Energy Storage Market Volume Share (%), by Application 2025 & 2033
- Figure 47: South America Energy Storage Market Revenue (Million), by Country 2025 & 2033
- Figure 48: South America Energy Storage Market Volume (K Unit), by Country 2025 & 2033
- Figure 49: South America Energy Storage Market Revenue Share (%), by Country 2025 & 2033
- Figure 50: South America Energy Storage Market Volume Share (%), by Country 2025 & 2033
- Figure 51: Middle East and Africa Energy Storage Market Revenue (Million), by Type 2025 & 2033
- Figure 52: Middle East and Africa Energy Storage Market Volume (K Unit), by Type 2025 & 2033
- Figure 53: Middle East and Africa Energy Storage Market Revenue Share (%), by Type 2025 & 2033
- Figure 54: Middle East and Africa Energy Storage Market Volume Share (%), by Type 2025 & 2033
- Figure 55: Middle East and Africa Energy Storage Market Revenue (Million), by Application 2025 & 2033
- Figure 56: Middle East and Africa Energy Storage Market Volume (K Unit), by Application 2025 & 2033
- Figure 57: Middle East and Africa Energy Storage Market Revenue Share (%), by Application 2025 & 2033
- Figure 58: Middle East and Africa Energy Storage Market Volume Share (%), by Application 2025 & 2033
- Figure 59: Middle East and Africa Energy Storage Market Revenue (Million), by Country 2025 & 2033
- Figure 60: Middle East and Africa Energy Storage Market Volume (K Unit), by Country 2025 & 2033
- Figure 61: Middle East and Africa Energy Storage Market Revenue Share (%), by Country 2025 & 2033
- Figure 62: Middle East and Africa Energy Storage Market Volume Share (%), by Country 2025 & 2033
List of Tables
- Table 1: Global Energy Storage Market Revenue Million Forecast, by Type 2020 & 2033
- Table 2: Global Energy Storage Market Volume K Unit Forecast, by Type 2020 & 2033
- Table 3: Global Energy Storage Market Revenue Million Forecast, by Application 2020 & 2033
- Table 4: Global Energy Storage Market Volume K Unit Forecast, by Application 2020 & 2033
- Table 5: Global Energy Storage Market Revenue Million Forecast, by Region 2020 & 2033
- Table 6: Global Energy Storage Market Volume K Unit Forecast, by Region 2020 & 2033
- Table 7: Global Energy Storage Market Revenue Million Forecast, by Type 2020 & 2033
- Table 8: Global Energy Storage Market Volume K Unit Forecast, by Type 2020 & 2033
- Table 9: Global Energy Storage Market Revenue Million Forecast, by Application 2020 & 2033
- Table 10: Global Energy Storage Market Volume K Unit Forecast, by Application 2020 & 2033
- Table 11: Global Energy Storage Market Revenue Million Forecast, by Country 2020 & 2033
- Table 12: Global Energy Storage Market Volume K Unit Forecast, by Country 2020 & 2033
- Table 13: United States Energy Storage Market Revenue (Million) Forecast, by Application 2020 & 2033
- Table 14: United States Energy Storage Market Volume (K Unit) Forecast, by Application 2020 & 2033
- Table 15: Canada Energy Storage Market Revenue (Million) Forecast, by Application 2020 & 2033
- Table 16: Canada Energy Storage Market Volume (K Unit) Forecast, by Application 2020 & 2033
- Table 17: Rest of North America Energy Storage Market Revenue (Million) Forecast, by Application 2020 & 2033
- Table 18: Rest of North America Energy Storage Market Volume (K Unit) Forecast, by Application 2020 & 2033
- Table 19: Global Energy Storage Market Revenue Million Forecast, by Type 2020 & 2033
- Table 20: Global Energy Storage Market Volume K Unit Forecast, by Type 2020 & 2033
- Table 21: Global Energy Storage Market Revenue Million Forecast, by Application 2020 & 2033
- Table 22: Global Energy Storage Market Volume K Unit Forecast, by Application 2020 & 2033
- Table 23: Global Energy Storage Market Revenue Million Forecast, by Country 2020 & 2033
- Table 24: Global Energy Storage Market Volume K Unit Forecast, by Country 2020 & 2033
- Table 25: India Energy Storage Market Revenue (Million) Forecast, by Application 2020 & 2033
- Table 26: India Energy Storage Market Volume (K Unit) Forecast, by Application 2020 & 2033
- Table 27: China Energy Storage Market Revenue (Million) Forecast, by Application 2020 & 2033
- Table 28: China Energy Storage Market Volume (K Unit) Forecast, by Application 2020 & 2033
- Table 29: Australia Energy Storage Market Revenue (Million) Forecast, by Application 2020 & 2033
- Table 30: Australia Energy Storage Market Volume (K Unit) Forecast, by Application 2020 & 2033
- Table 31: Rest of Asia Pacific Energy Storage Market Revenue (Million) Forecast, by Application 2020 & 2033
- Table 32: Rest of Asia Pacific Energy Storage Market Volume (K Unit) Forecast, by Application 2020 & 2033
- Table 33: Global Energy Storage Market Revenue Million Forecast, by Type 2020 & 2033
- Table 34: Global Energy Storage Market Volume K Unit Forecast, by Type 2020 & 2033
- Table 35: Global Energy Storage Market Revenue Million Forecast, by Application 2020 & 2033
- Table 36: Global Energy Storage Market Volume K Unit Forecast, by Application 2020 & 2033
- Table 37: Global Energy Storage Market Revenue Million Forecast, by Country 2020 & 2033
- Table 38: Global Energy Storage Market Volume K Unit Forecast, by Country 2020 & 2033
- Table 39: Germany Energy Storage Market Revenue (Million) Forecast, by Application 2020 & 2033
- Table 40: Germany Energy Storage Market Volume (K Unit) Forecast, by Application 2020 & 2033
- Table 41: United Kingdom Energy Storage Market Revenue (Million) Forecast, by Application 2020 & 2033
- Table 42: United Kingdom Energy Storage Market Volume (K Unit) Forecast, by Application 2020 & 2033
- Table 43: Rest of Europe Energy Storage Market Revenue (Million) Forecast, by Application 2020 & 2033
- Table 44: Rest of Europe Energy Storage Market Volume (K Unit) Forecast, by Application 2020 & 2033
- Table 45: Global Energy Storage Market Revenue Million Forecast, by Type 2020 & 2033
- Table 46: Global Energy Storage Market Volume K Unit Forecast, by Type 2020 & 2033
- Table 47: Global Energy Storage Market Revenue Million Forecast, by Application 2020 & 2033
- Table 48: Global Energy Storage Market Volume K Unit Forecast, by Application 2020 & 2033
- Table 49: Global Energy Storage Market Revenue Million Forecast, by Country 2020 & 2033
- Table 50: Global Energy Storage Market Volume K Unit Forecast, by Country 2020 & 2033
- Table 51: Brazil Energy Storage Market Revenue (Million) Forecast, by Application 2020 & 2033
- Table 52: Brazil Energy Storage Market Volume (K Unit) Forecast, by Application 2020 & 2033
- Table 53: Argentina Energy Storage Market Revenue (Million) Forecast, by Application 2020 & 2033
- Table 54: Argentina Energy Storage Market Volume (K Unit) Forecast, by Application 2020 & 2033
- Table 55: Rest of South America Energy Storage Market Revenue (Million) Forecast, by Application 2020 & 2033
- Table 56: Rest of South America Energy Storage Market Volume (K Unit) Forecast, by Application 2020 & 2033
- Table 57: Global Energy Storage Market Revenue Million Forecast, by Type 2020 & 2033
- Table 58: Global Energy Storage Market Volume K Unit Forecast, by Type 2020 & 2033
- Table 59: Global Energy Storage Market Revenue Million Forecast, by Application 2020 & 2033
- Table 60: Global Energy Storage Market Volume K Unit Forecast, by Application 2020 & 2033
- Table 61: Global Energy Storage Market Revenue Million Forecast, by Country 2020 & 2033
- Table 62: Global Energy Storage Market Volume K Unit Forecast, by Country 2020 & 2033
- Table 63: Saudi Arabia Energy Storage Market Revenue (Million) Forecast, by Application 2020 & 2033
- Table 64: Saudi Arabia Energy Storage Market Volume (K Unit) Forecast, by Application 2020 & 2033
- Table 65: Iraq Energy Storage Market Revenue (Million) Forecast, by Application 2020 & 2033
- Table 66: Iraq Energy Storage Market Volume (K Unit) Forecast, by Application 2020 & 2033
- Table 67: Jordan Energy Storage Market Revenue (Million) Forecast, by Application 2020 & 2033
- Table 68: Jordan Energy Storage Market Volume (K Unit) Forecast, by Application 2020 & 2033
- Table 69: Rest of Middle East and Africa Energy Storage Market Revenue (Million) Forecast, by Application 2020 & 2033
- Table 70: Rest of Middle East and Africa Energy Storage Market Volume (K Unit) Forecast, by Application 2020 & 2033
Frequently Asked Questions
1. What is the projected Compound Annual Growth Rate (CAGR) of the Energy Storage Market?
The projected CAGR is approximately 14.31%.
2. Which companies are prominent players in the Energy Storage Market?
Key companies in the market include BYD Co Ltd, Contemporary Amperex Technology Co Limited, UniEnergy Technologies LLC, Samsung SDI Co Ltd, LG Energy Solution Ltd, NGK Insulators Ltd, Tesla Inc *List Not Exhaustive, Clarios (Formerly Johnson Controls International PLC), GS Yuasa Corporation.
3. What are the main segments of the Energy Storage Market?
The market segments include Type, Application.
4. Can you provide details about the market size?
The market size is estimated to be USD 51.10 Million as of 2022.
5. What are some drivers contributing to market growth?
Rising Supporting Government Policies for Solar Energy in South Africa4.; Increasing Investment in Renewable Energy Such as Solar. Wind. and Others.
6. What are the notable trends driving market growth?
Batteries Segment to Dominate the Market.
7. Are there any restraints impacting market growth?
Increasing Adoption of Alternate Renewable Technologies Such as Wind.
8. Can you provide examples of recent developments in the market?
February 2022: The partnership between FIMER and Vega Solar supplied 14 PVS-100 inverters, a three-phase string solution, to Albania. The PVS-100/120-TL is a cloud-connected three-phase string inverter by FIMER designed for cost-effective decentralized solar systems on both ground and rooftops.
9. What pricing options are available for accessing the report?
Pricing options include single-user, multi-user, and enterprise licenses priced at USD 4750, USD 5250, and USD 8750 respectively.
10. Is the market size provided in terms of value or volume?
The market size is provided in terms of value, measured in Million and volume, measured in K Unit.
11. Are there any specific market keywords associated with the report?
Yes, the market keyword associated with the report is "Energy Storage Market," which aids in identifying and referencing the specific market segment covered.
12. How do I determine which pricing option suits my needs best?
The pricing options vary based on user requirements and access needs. Individual users may opt for single-user licenses, while businesses requiring broader access may choose multi-user or enterprise licenses for cost-effective access to the report.
13. Are there any additional resources or data provided in the Energy Storage Market report?
While the report offers comprehensive insights, it's advisable to review the specific contents or supplementary materials provided to ascertain if additional resources or data are available.
14. How can I stay updated on further developments or reports in the Energy Storage Market?
To stay informed about further developments, trends, and reports in the Energy Storage Market, consider subscribing to industry newsletters, following relevant companies and organizations, or regularly checking reputable industry news sources and publications.
Methodology
Step 1 - Identification of Relevant Samples Size from Population Database


Step 2 - Approaches for Defining Global Market Size (Value, Volume* & Price*)

Note*: In applicable scenarios
Step 3 - Data Sources
Primary Research
- Web Analytics
- Survey Reports
- Research Institute
- Latest Research Reports
- Opinion Leaders
Secondary Research
- Annual Reports
- White Paper
- Latest Press Release
- Industry Association
- Paid Database
- Investor Presentations

Step 4 - Data Triangulation
Involves using different sources of information in order to increase the validity of a study
These sources are likely to be stakeholders in a program - participants, other researchers, program staff, other community members, and so on.
Then we put all data in single framework & apply various statistical tools to find out the dynamic on the market.
During the analysis stage, feedback from the stakeholder groups would be compared to determine areas of agreement as well as areas of divergence