
Key Insights
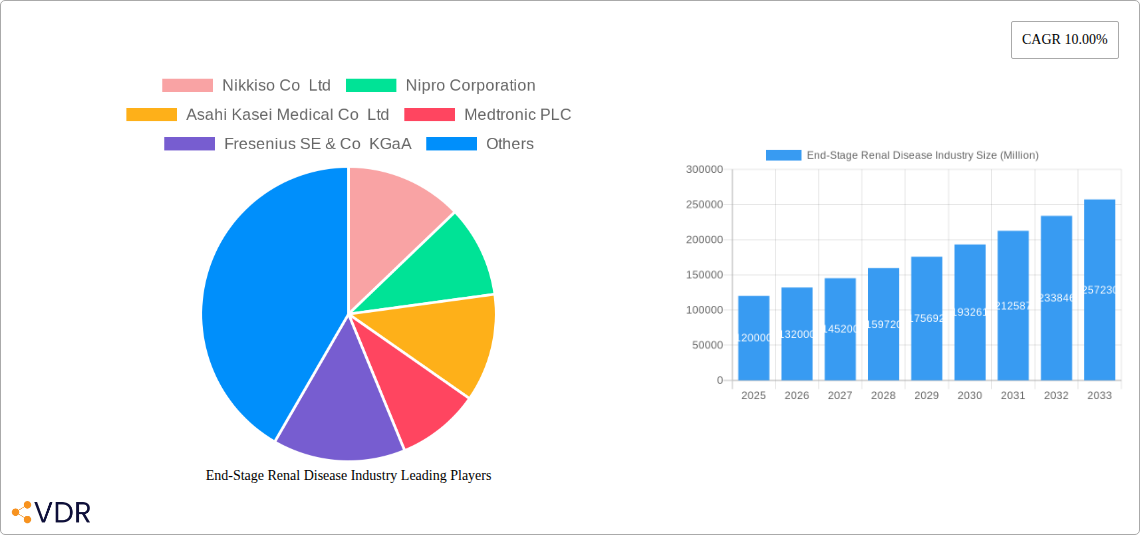
The global End-Stage Renal Disease (ESRD) market, valued at approximately $120 billion in 2025, is projected to experience robust growth, driven by an aging global population, increasing prevalence of chronic kidney diseases like diabetes and hypertension, and rising healthcare expenditure. A Compound Annual Growth Rate (CAGR) of 10% is anticipated from 2025 to 2033, leading to a market size exceeding $300 billion by 2033. This growth is fueled by advancements in dialysis technologies, including home dialysis options that offer greater patient convenience and improved quality of life. Furthermore, increased adoption of early detection strategies through blood and urine tests, along with improved imaging techniques, contributes to earlier diagnosis and intervention, impacting market expansion. However, the high cost of treatment, particularly kidney transplantation and long-term dialysis, remains a significant restraint, particularly in low- and middle-income countries. The market is segmented by treatment (kidney transplantation, dialysis) and diagnosis (blood tests, urine tests, imaging tests, other diagnoses). Dialysis currently dominates the treatment segment, reflecting the limited availability of suitable organ donors for transplantation. Geographically, North America and Europe currently hold substantial market share due to advanced healthcare infrastructure and higher prevalence of ESRD. However, rapidly developing economies in Asia-Pacific are poised for significant growth, driven by increasing awareness and improving access to healthcare. The competitive landscape is shaped by key players like Fresenius, Baxter, and DaVita, continually innovating to offer advanced treatment options and improve patient outcomes.
The ESRD market's future trajectory is intricately linked to effective disease management strategies, including preventative measures targeting underlying risk factors like diabetes and hypertension. The expansion of accessible and affordable dialysis services in underserved regions is crucial for equitable access to treatment. Furthermore, breakthroughs in regenerative medicine and advancements in organ transplantation techniques have the potential to significantly alter the market landscape in the coming years. The focus on personalized medicine and improved patient monitoring technologies will continue to drive innovation and enhance the overall efficacy and accessibility of ESRD treatment. The market’s sustained growth hinges on a multi-pronged approach encompassing improved preventative care, technological advancements, and equitable access to quality healthcare across all socioeconomic strata.
End-Stage Renal Disease (ESRD) Industry Market Report: 2019-2033
This comprehensive report provides a detailed analysis of the End-Stage Renal Disease (ESRD) industry, encompassing market dynamics, growth trends, competitive landscape, and future outlook. The study period covers 2019-2033, with 2025 as the base and estimated year. The report offers invaluable insights for industry professionals, investors, and strategic decision-makers seeking to understand and capitalize on opportunities within this vital healthcare sector. The parent market is the healthcare industry, and the child market is the dialysis and kidney transplantation market.
End-Stage Renal Disease Industry Market Dynamics & Structure
The ESRD industry is characterized by a moderately concentrated market structure, with key players like Fresenius SE & Co KGaA, Baxter International Inc, and DaVita holding significant market share. Technological innovation, particularly in dialysis equipment and treatment modalities, is a key driver. Stringent regulatory frameworks, varying by region, influence market access and product approvals. The industry faces competition from emerging technologies and alternative treatment approaches. The aging global population and rising prevalence of chronic kidney disease are major factors increasing demand. M&A activity has been significant, with larger players acquiring smaller companies to expand their product portfolios and geographical reach. The market size in 2025 is estimated at xx Million.
- Market Concentration: Moderately concentrated, with top players holding approximately xx% market share in 2025.
- Technological Innovation: Focus on miniaturization, portability, and improved efficiency of dialysis machines.
- Regulatory Frameworks: Varying approvals and reimbursement policies across different geographies create complexities.
- Competitive Substitutes: Emerging technologies like regenerative medicine pose potential long-term challenges.
- End-User Demographics: Aging population and rising prevalence of chronic kidney disease fuel market growth.
- M&A Trends: Consolidation expected to continue, driven by strategic expansion and technological integration. XX M&A deals were recorded between 2019 and 2024.
End-Stage Renal Disease Industry Growth Trends & Insights
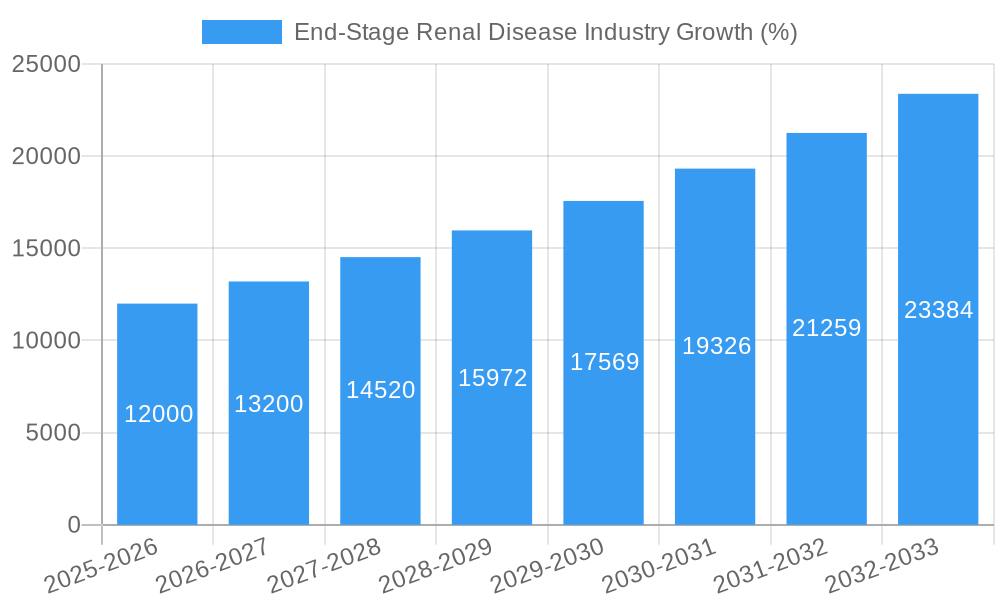
The ESRD market exhibits robust growth driven by increasing prevalence of chronic kidney disease, an aging global population, and advancements in dialysis technology. The market size experienced a CAGR of xx% during the historical period (2019-2024) and is projected to grow at a CAGR of xx% during the forecast period (2025-2033), reaching xx Million by 2033. Market penetration of advanced dialysis techniques, like home hemodialysis, is gradually increasing, influenced by improved patient convenience and cost-effectiveness. Technological advancements, such as the development of portable and automated peritoneal dialysis systems, are reshaping consumer preferences towards home-based treatments. This shift in consumer behavior, along with supportive government policies and initiatives, significantly accelerates market expansion.
Dominant Regions, Countries, or Segments in End-Stage Renal Disease Industry
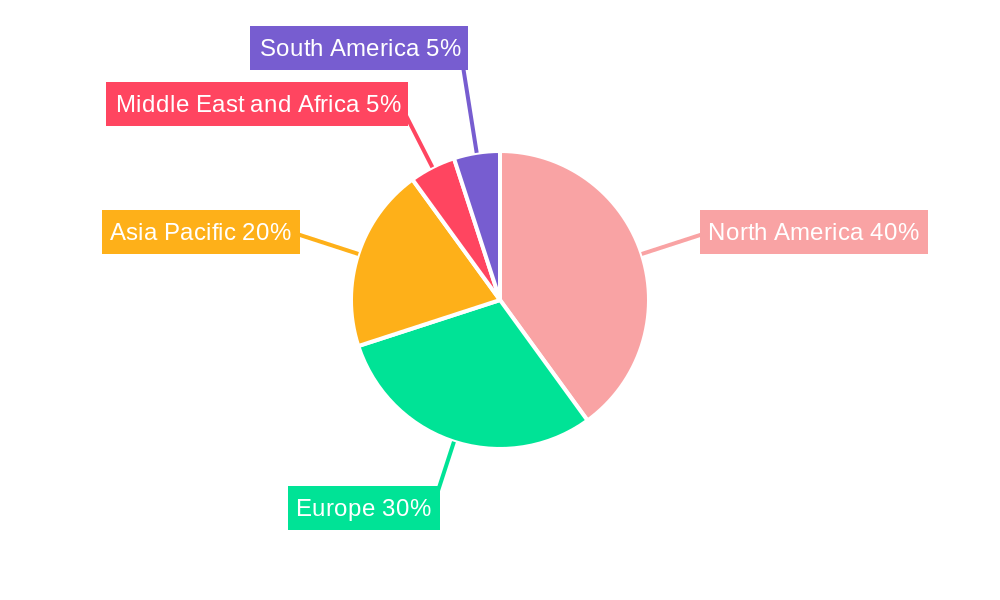
North America and Europe currently dominate the ESRD market due to high prevalence rates of chronic kidney disease, well-established healthcare infrastructure, and higher per capita healthcare expenditure. However, Asia-Pacific is witnessing rapid growth fueled by increasing awareness, rising disposable incomes, and expanding healthcare access. Within treatment segments, dialysis accounts for the largest share, driven by its established efficacy and widespread availability. Among diagnostic segments, blood tests dominate due to their routine use in monitoring kidney function.
Key Drivers:
- North America & Europe: High prevalence rates, advanced healthcare infrastructure, and robust reimbursement policies.
- Asia-Pacific: Increasing awareness, rising disposable incomes, and expanding healthcare access.
- Dialysis Segment: Established efficacy, widespread availability, and technological advancements.
- Blood Tests Segment: Routine use in kidney function monitoring and early detection.
Dominance Factors: Market share, growth potential, and presence of established players in specific regions.
End-Stage Renal Disease Industry Product Landscape
The ESRD product landscape comprises dialysis machines (hemodialysis and peritoneal dialysis), related disposables (dialyzers, catheters, fluids), and diagnostic tools (blood and urine testing kits, imaging equipment). Recent innovations focus on portability, automation, and improved biocompatibility. Products are differentiated by features such as ease of use, treatment efficiency, and cost-effectiveness. Technological advancements include the development of next-generation dialysis membranes, improved blood purification techniques, and the integration of smart technology for remote monitoring.
Key Drivers, Barriers & Challenges in End-Stage Renal Disease Industry
Key Drivers: Rising prevalence of chronic kidney disease, technological advancements, aging population, supportive government initiatives (e.g., the Mauritius hemodialysis unit launch), and increasing awareness.
Challenges: High treatment costs, limited access to quality healthcare in low- and middle-income countries, shortage of skilled professionals, and stringent regulatory hurdles in certain markets. Supply chain disruptions, particularly regarding disposables, have resulted in xx% increase in costs in 2024.
Emerging Opportunities in End-Stage Renal Disease Industry
Untapped markets in developing economies, demand for home-based dialysis solutions, increasing focus on early diagnosis and prevention of kidney disease, and the exploration of innovative therapies such as regenerative medicine represent significant opportunities.
Growth Accelerators in the End-Stage Renal Disease Industry
Technological breakthroughs in dialysis equipment, strategic partnerships between healthcare providers and technology companies, and expansion into emerging markets will significantly accelerate growth. Government investments in healthcare infrastructure and initiatives to improve access to care will further drive market expansion.
Key Players Shaping the End-Stage Renal Disease Industry Market
- Nikkiso Co Ltd
- Nipro Corporation
- Asahi Kasei Medical Co Ltd
- Medtronic PLC
- Fresenius SE & Co KGaA
- Becton Dickinson and Company
- Cantel Medical (STERIS)
- Baxter International Inc
- B Braun SE
Notable Milestones in End-Stage Renal Disease Industry Sector
- March 2022: Launch of a new hemodialysis unit in Mauritius, expanding access to treatment.
- April 2022: FDA approval of Fresenius Medical Care's Versi PD Cycler System, advancing portable dialysis technology.
In-Depth End-Stage Renal Disease Industry Market Outlook
The ESRD market is poised for continued growth, driven by factors such as technological advancements, increasing prevalence of chronic kidney disease, and expanding healthcare access globally. Strategic partnerships, investments in research and development, and expansion into underserved markets will be crucial for companies to capitalize on this long-term growth potential. The market is expected to remain dynamic with ongoing innovation and consolidation.
End-Stage Renal Disease Industry Segmentation
-
1. Treatment
- 1.1. Kidney Transplantation
- 1.2. Dialysis
- 1.3. Diagnosis
End-Stage Renal Disease Industry Segmentation By Geography
-
1. North America
- 1.1. United States
- 1.2. Canada
- 1.3. Mexico
-
2. Europe
- 2.1. Germany
- 2.2. United Kingdom
- 2.3. France
- 2.4. Italy
- 2.5. Spain
- 2.6. Rest of Europe
-
3. Asia Pacific
- 3.1. China
- 3.2. Japan
- 3.3. India
- 3.4. Australia
- 3.5. South Korea
- 3.6. Rest of Asia Pacific
-
4. Middle East and Africa
- 4.1. GCC
- 4.2. South Africa
- 4.3. Rest of Middle East and Africa
-
5. South America
- 5.1. Brazil
- 5.2. Argentina
- 5.3. Rest of South America
End-Stage Renal Disease Industry REPORT HIGHLIGHTS
| Aspects | Details |
|---|---|
| Study Period | 2019-2033 |
| Base Year | 2024 |
| Estimated Year | 2025 |
| Forecast Period | 2025-2033 |
| Historical Period | 2019-2024 |
| Growth Rate | CAGR of 10.00% from 2019-2033 |
| Segmentation |
|
Table of Contents
- 1. Introduction
- 1.1. Research Scope
- 1.2. Market Segmentation
- 1.3. Research Methodology
- 1.4. Definitions and Assumptions
- 2. Executive Summary
- 2.1. Introduction
- 3. Market Dynamics
- 3.1. Introduction
- 3.2. Market Drivers
- 3.2.1. Increase in Number of Patient Suffering from Chronic Kidney Disease; Introduction of Technologically Advanced Products; Rising Prevalence of Diabetes and Hypertension
- 3.3. Market Restrains
- 3.3.1. Delay in Diagnosis of the Chronic Kidney Disease
- 3.4. Market Trends
- 3.4.1. Dialysis Segment by Treatment is Expected to Witness a Significant Growth over the Forecast Period
- 4. Market Factor Analysis
- 4.1. Porters Five Forces
- 4.2. Supply/Value Chain
- 4.3. PESTEL analysis
- 4.4. Market Entropy
- 4.5. Patent/Trademark Analysis
- 5. Global End-Stage Renal Disease Industry Analysis, Insights and Forecast, 2019-2031
- 5.1. Market Analysis, Insights and Forecast - by Treatment
- 5.1.1. Kidney Transplantation
- 5.1.2. Dialysis
- 5.1.3. Diagnosis
- 5.2. Market Analysis, Insights and Forecast - by Region
- 5.2.1. North America
- 5.2.2. Europe
- 5.2.3. Asia Pacific
- 5.2.4. Middle East and Africa
- 5.2.5. South America
- 5.1. Market Analysis, Insights and Forecast - by Treatment
- 6. North America End-Stage Renal Disease Industry Analysis, Insights and Forecast, 2019-2031
- 6.1. Market Analysis, Insights and Forecast - by Treatment
- 6.1.1. Kidney Transplantation
- 6.1.2. Dialysis
- 6.1.3. Diagnosis
- 6.1. Market Analysis, Insights and Forecast - by Treatment
- 7. Europe End-Stage Renal Disease Industry Analysis, Insights and Forecast, 2019-2031
- 7.1. Market Analysis, Insights and Forecast - by Treatment
- 7.1.1. Kidney Transplantation
- 7.1.2. Dialysis
- 7.1.3. Diagnosis
- 7.1. Market Analysis, Insights and Forecast - by Treatment
- 8. Asia Pacific End-Stage Renal Disease Industry Analysis, Insights and Forecast, 2019-2031
- 8.1. Market Analysis, Insights and Forecast - by Treatment
- 8.1.1. Kidney Transplantation
- 8.1.2. Dialysis
- 8.1.3. Diagnosis
- 8.1. Market Analysis, Insights and Forecast - by Treatment
- 9. Middle East and Africa End-Stage Renal Disease Industry Analysis, Insights and Forecast, 2019-2031
- 9.1. Market Analysis, Insights and Forecast - by Treatment
- 9.1.1. Kidney Transplantation
- 9.1.2. Dialysis
- 9.1.3. Diagnosis
- 9.1. Market Analysis, Insights and Forecast - by Treatment
- 10. South America End-Stage Renal Disease Industry Analysis, Insights and Forecast, 2019-2031
- 10.1. Market Analysis, Insights and Forecast - by Treatment
- 10.1.1. Kidney Transplantation
- 10.1.2. Dialysis
- 10.1.3. Diagnosis
- 10.1. Market Analysis, Insights and Forecast - by Treatment
- 11. North America End-Stage Renal Disease Industry Analysis, Insights and Forecast, 2019-2031
- 11.1. Market Analysis, Insights and Forecast - By Country/Sub-region
- 11.1.1 United States
- 11.1.2 Canada
- 11.1.3 Mexico
- 12. Europe End-Stage Renal Disease Industry Analysis, Insights and Forecast, 2019-2031
- 12.1. Market Analysis, Insights and Forecast - By Country/Sub-region
- 12.1.1 Germany
- 12.1.2 United Kingdom
- 12.1.3 France
- 12.1.4 Italy
- 12.1.5 Spain
- 12.1.6 Rest of Europe
- 13. Asia Pacific End-Stage Renal Disease Industry Analysis, Insights and Forecast, 2019-2031
- 13.1. Market Analysis, Insights and Forecast - By Country/Sub-region
- 13.1.1 China
- 13.1.2 Japan
- 13.1.3 India
- 13.1.4 Australia
- 13.1.5 South Korea
- 13.1.6 Rest of Asia Pacific
- 14. Middle East and Africa End-Stage Renal Disease Industry Analysis, Insights and Forecast, 2019-2031
- 14.1. Market Analysis, Insights and Forecast - By Country/Sub-region
- 14.1.1 GCC
- 14.1.2 South Africa
- 14.1.3 Rest of Middle East and Africa
- 15. South America End-Stage Renal Disease Industry Analysis, Insights and Forecast, 2019-2031
- 15.1. Market Analysis, Insights and Forecast - By Country/Sub-region
- 15.1.1 Brazil
- 15.1.2 Argentina
- 15.1.3 Rest of South America
- 16. Competitive Analysis
- 16.1. Global Market Share Analysis 2024
- 16.2. Company Profiles
- 16.2.1 Nikkiso Co Ltd
- 16.2.1.1. Overview
- 16.2.1.2. Products
- 16.2.1.3. SWOT Analysis
- 16.2.1.4. Recent Developments
- 16.2.1.5. Financials (Based on Availability)
- 16.2.2 Nipro Corporation
- 16.2.2.1. Overview
- 16.2.2.2. Products
- 16.2.2.3. SWOT Analysis
- 16.2.2.4. Recent Developments
- 16.2.2.5. Financials (Based on Availability)
- 16.2.3 Asahi Kasei Medical Co Ltd
- 16.2.3.1. Overview
- 16.2.3.2. Products
- 16.2.3.3. SWOT Analysis
- 16.2.3.4. Recent Developments
- 16.2.3.5. Financials (Based on Availability)
- 16.2.4 Medtronic PLC
- 16.2.4.1. Overview
- 16.2.4.2. Products
- 16.2.4.3. SWOT Analysis
- 16.2.4.4. Recent Developments
- 16.2.4.5. Financials (Based on Availability)
- 16.2.5 Fresenius SE & Co KGaA
- 16.2.5.1. Overview
- 16.2.5.2. Products
- 16.2.5.3. SWOT Analysis
- 16.2.5.4. Recent Developments
- 16.2.5.5. Financials (Based on Availability)
- 16.2.6 Becton Dickinson and Company
- 16.2.6.1. Overview
- 16.2.6.2. Products
- 16.2.6.3. SWOT Analysis
- 16.2.6.4. Recent Developments
- 16.2.6.5. Financials (Based on Availability)
- 16.2.7 Cantel Medical (STERIS)
- 16.2.7.1. Overview
- 16.2.7.2. Products
- 16.2.7.3. SWOT Analysis
- 16.2.7.4. Recent Developments
- 16.2.7.5. Financials (Based on Availability)
- 16.2.8 Baxter International Inc
- 16.2.8.1. Overview
- 16.2.8.2. Products
- 16.2.8.3. SWOT Analysis
- 16.2.8.4. Recent Developments
- 16.2.8.5. Financials (Based on Availability)
- 16.2.9 B Braun SE
- 16.2.9.1. Overview
- 16.2.9.2. Products
- 16.2.9.3. SWOT Analysis
- 16.2.9.4. Recent Developments
- 16.2.9.5. Financials (Based on Availability)
- 16.2.1 Nikkiso Co Ltd
List of Figures
- Figure 1: Global End-Stage Renal Disease Industry Revenue Breakdown (Million, %) by Region 2024 & 2032
- Figure 2: Global End-Stage Renal Disease Industry Volume Breakdown (K Unit, %) by Region 2024 & 2032
- Figure 3: North America End-Stage Renal Disease Industry Revenue (Million), by Country 2024 & 2032
- Figure 4: North America End-Stage Renal Disease Industry Volume (K Unit), by Country 2024 & 2032
- Figure 5: North America End-Stage Renal Disease Industry Revenue Share (%), by Country 2024 & 2032
- Figure 6: North America End-Stage Renal Disease Industry Volume Share (%), by Country 2024 & 2032
- Figure 7: Europe End-Stage Renal Disease Industry Revenue (Million), by Country 2024 & 2032
- Figure 8: Europe End-Stage Renal Disease Industry Volume (K Unit), by Country 2024 & 2032
- Figure 9: Europe End-Stage Renal Disease Industry Revenue Share (%), by Country 2024 & 2032
- Figure 10: Europe End-Stage Renal Disease Industry Volume Share (%), by Country 2024 & 2032
- Figure 11: Asia Pacific End-Stage Renal Disease Industry Revenue (Million), by Country 2024 & 2032
- Figure 12: Asia Pacific End-Stage Renal Disease Industry Volume (K Unit), by Country 2024 & 2032
- Figure 13: Asia Pacific End-Stage Renal Disease Industry Revenue Share (%), by Country 2024 & 2032
- Figure 14: Asia Pacific End-Stage Renal Disease Industry Volume Share (%), by Country 2024 & 2032
- Figure 15: Middle East and Africa End-Stage Renal Disease Industry Revenue (Million), by Country 2024 & 2032
- Figure 16: Middle East and Africa End-Stage Renal Disease Industry Volume (K Unit), by Country 2024 & 2032
- Figure 17: Middle East and Africa End-Stage Renal Disease Industry Revenue Share (%), by Country 2024 & 2032
- Figure 18: Middle East and Africa End-Stage Renal Disease Industry Volume Share (%), by Country 2024 & 2032
- Figure 19: South America End-Stage Renal Disease Industry Revenue (Million), by Country 2024 & 2032
- Figure 20: South America End-Stage Renal Disease Industry Volume (K Unit), by Country 2024 & 2032
- Figure 21: South America End-Stage Renal Disease Industry Revenue Share (%), by Country 2024 & 2032
- Figure 22: South America End-Stage Renal Disease Industry Volume Share (%), by Country 2024 & 2032
- Figure 23: North America End-Stage Renal Disease Industry Revenue (Million), by Treatment 2024 & 2032
- Figure 24: North America End-Stage Renal Disease Industry Volume (K Unit), by Treatment 2024 & 2032
- Figure 25: North America End-Stage Renal Disease Industry Revenue Share (%), by Treatment 2024 & 2032
- Figure 26: North America End-Stage Renal Disease Industry Volume Share (%), by Treatment 2024 & 2032
- Figure 27: North America End-Stage Renal Disease Industry Revenue (Million), by Country 2024 & 2032
- Figure 28: North America End-Stage Renal Disease Industry Volume (K Unit), by Country 2024 & 2032
- Figure 29: North America End-Stage Renal Disease Industry Revenue Share (%), by Country 2024 & 2032
- Figure 30: North America End-Stage Renal Disease Industry Volume Share (%), by Country 2024 & 2032
- Figure 31: Europe End-Stage Renal Disease Industry Revenue (Million), by Treatment 2024 & 2032
- Figure 32: Europe End-Stage Renal Disease Industry Volume (K Unit), by Treatment 2024 & 2032
- Figure 33: Europe End-Stage Renal Disease Industry Revenue Share (%), by Treatment 2024 & 2032
- Figure 34: Europe End-Stage Renal Disease Industry Volume Share (%), by Treatment 2024 & 2032
- Figure 35: Europe End-Stage Renal Disease Industry Revenue (Million), by Country 2024 & 2032
- Figure 36: Europe End-Stage Renal Disease Industry Volume (K Unit), by Country 2024 & 2032
- Figure 37: Europe End-Stage Renal Disease Industry Revenue Share (%), by Country 2024 & 2032
- Figure 38: Europe End-Stage Renal Disease Industry Volume Share (%), by Country 2024 & 2032
- Figure 39: Asia Pacific End-Stage Renal Disease Industry Revenue (Million), by Treatment 2024 & 2032
- Figure 40: Asia Pacific End-Stage Renal Disease Industry Volume (K Unit), by Treatment 2024 & 2032
- Figure 41: Asia Pacific End-Stage Renal Disease Industry Revenue Share (%), by Treatment 2024 & 2032
- Figure 42: Asia Pacific End-Stage Renal Disease Industry Volume Share (%), by Treatment 2024 & 2032
- Figure 43: Asia Pacific End-Stage Renal Disease Industry Revenue (Million), by Country 2024 & 2032
- Figure 44: Asia Pacific End-Stage Renal Disease Industry Volume (K Unit), by Country 2024 & 2032
- Figure 45: Asia Pacific End-Stage Renal Disease Industry Revenue Share (%), by Country 2024 & 2032
- Figure 46: Asia Pacific End-Stage Renal Disease Industry Volume Share (%), by Country 2024 & 2032
- Figure 47: Middle East and Africa End-Stage Renal Disease Industry Revenue (Million), by Treatment 2024 & 2032
- Figure 48: Middle East and Africa End-Stage Renal Disease Industry Volume (K Unit), by Treatment 2024 & 2032
- Figure 49: Middle East and Africa End-Stage Renal Disease Industry Revenue Share (%), by Treatment 2024 & 2032
- Figure 50: Middle East and Africa End-Stage Renal Disease Industry Volume Share (%), by Treatment 2024 & 2032
- Figure 51: Middle East and Africa End-Stage Renal Disease Industry Revenue (Million), by Country 2024 & 2032
- Figure 52: Middle East and Africa End-Stage Renal Disease Industry Volume (K Unit), by Country 2024 & 2032
- Figure 53: Middle East and Africa End-Stage Renal Disease Industry Revenue Share (%), by Country 2024 & 2032
- Figure 54: Middle East and Africa End-Stage Renal Disease Industry Volume Share (%), by Country 2024 & 2032
- Figure 55: South America End-Stage Renal Disease Industry Revenue (Million), by Treatment 2024 & 2032
- Figure 56: South America End-Stage Renal Disease Industry Volume (K Unit), by Treatment 2024 & 2032
- Figure 57: South America End-Stage Renal Disease Industry Revenue Share (%), by Treatment 2024 & 2032
- Figure 58: South America End-Stage Renal Disease Industry Volume Share (%), by Treatment 2024 & 2032
- Figure 59: South America End-Stage Renal Disease Industry Revenue (Million), by Country 2024 & 2032
- Figure 60: South America End-Stage Renal Disease Industry Volume (K Unit), by Country 2024 & 2032
- Figure 61: South America End-Stage Renal Disease Industry Revenue Share (%), by Country 2024 & 2032
- Figure 62: South America End-Stage Renal Disease Industry Volume Share (%), by Country 2024 & 2032
List of Tables
- Table 1: Global End-Stage Renal Disease Industry Revenue Million Forecast, by Region 2019 & 2032
- Table 2: Global End-Stage Renal Disease Industry Volume K Unit Forecast, by Region 2019 & 2032
- Table 3: Global End-Stage Renal Disease Industry Revenue Million Forecast, by Treatment 2019 & 2032
- Table 4: Global End-Stage Renal Disease Industry Volume K Unit Forecast, by Treatment 2019 & 2032
- Table 5: Global End-Stage Renal Disease Industry Revenue Million Forecast, by Region 2019 & 2032
- Table 6: Global End-Stage Renal Disease Industry Volume K Unit Forecast, by Region 2019 & 2032
- Table 7: Global End-Stage Renal Disease Industry Revenue Million Forecast, by Country 2019 & 2032
- Table 8: Global End-Stage Renal Disease Industry Volume K Unit Forecast, by Country 2019 & 2032
- Table 9: United States End-Stage Renal Disease Industry Revenue (Million) Forecast, by Application 2019 & 2032
- Table 10: United States End-Stage Renal Disease Industry Volume (K Unit) Forecast, by Application 2019 & 2032
- Table 11: Canada End-Stage Renal Disease Industry Revenue (Million) Forecast, by Application 2019 & 2032
- Table 12: Canada End-Stage Renal Disease Industry Volume (K Unit) Forecast, by Application 2019 & 2032
- Table 13: Mexico End-Stage Renal Disease Industry Revenue (Million) Forecast, by Application 2019 & 2032
- Table 14: Mexico End-Stage Renal Disease Industry Volume (K Unit) Forecast, by Application 2019 & 2032
- Table 15: Global End-Stage Renal Disease Industry Revenue Million Forecast, by Country 2019 & 2032
- Table 16: Global End-Stage Renal Disease Industry Volume K Unit Forecast, by Country 2019 & 2032
- Table 17: Germany End-Stage Renal Disease Industry Revenue (Million) Forecast, by Application 2019 & 2032
- Table 18: Germany End-Stage Renal Disease Industry Volume (K Unit) Forecast, by Application 2019 & 2032
- Table 19: United Kingdom End-Stage Renal Disease Industry Revenue (Million) Forecast, by Application 2019 & 2032
- Table 20: United Kingdom End-Stage Renal Disease Industry Volume (K Unit) Forecast, by Application 2019 & 2032
- Table 21: France End-Stage Renal Disease Industry Revenue (Million) Forecast, by Application 2019 & 2032
- Table 22: France End-Stage Renal Disease Industry Volume (K Unit) Forecast, by Application 2019 & 2032
- Table 23: Italy End-Stage Renal Disease Industry Revenue (Million) Forecast, by Application 2019 & 2032
- Table 24: Italy End-Stage Renal Disease Industry Volume (K Unit) Forecast, by Application 2019 & 2032
- Table 25: Spain End-Stage Renal Disease Industry Revenue (Million) Forecast, by Application 2019 & 2032
- Table 26: Spain End-Stage Renal Disease Industry Volume (K Unit) Forecast, by Application 2019 & 2032
- Table 27: Rest of Europe End-Stage Renal Disease Industry Revenue (Million) Forecast, by Application 2019 & 2032
- Table 28: Rest of Europe End-Stage Renal Disease Industry Volume (K Unit) Forecast, by Application 2019 & 2032
- Table 29: Global End-Stage Renal Disease Industry Revenue Million Forecast, by Country 2019 & 2032
- Table 30: Global End-Stage Renal Disease Industry Volume K Unit Forecast, by Country 2019 & 2032
- Table 31: China End-Stage Renal Disease Industry Revenue (Million) Forecast, by Application 2019 & 2032
- Table 32: China End-Stage Renal Disease Industry Volume (K Unit) Forecast, by Application 2019 & 2032
- Table 33: Japan End-Stage Renal Disease Industry Revenue (Million) Forecast, by Application 2019 & 2032
- Table 34: Japan End-Stage Renal Disease Industry Volume (K Unit) Forecast, by Application 2019 & 2032
- Table 35: India End-Stage Renal Disease Industry Revenue (Million) Forecast, by Application 2019 & 2032
- Table 36: India End-Stage Renal Disease Industry Volume (K Unit) Forecast, by Application 2019 & 2032
- Table 37: Australia End-Stage Renal Disease Industry Revenue (Million) Forecast, by Application 2019 & 2032
- Table 38: Australia End-Stage Renal Disease Industry Volume (K Unit) Forecast, by Application 2019 & 2032
- Table 39: South Korea End-Stage Renal Disease Industry Revenue (Million) Forecast, by Application 2019 & 2032
- Table 40: South Korea End-Stage Renal Disease Industry Volume (K Unit) Forecast, by Application 2019 & 2032
- Table 41: Rest of Asia Pacific End-Stage Renal Disease Industry Revenue (Million) Forecast, by Application 2019 & 2032
- Table 42: Rest of Asia Pacific End-Stage Renal Disease Industry Volume (K Unit) Forecast, by Application 2019 & 2032
- Table 43: Global End-Stage Renal Disease Industry Revenue Million Forecast, by Country 2019 & 2032
- Table 44: Global End-Stage Renal Disease Industry Volume K Unit Forecast, by Country 2019 & 2032
- Table 45: GCC End-Stage Renal Disease Industry Revenue (Million) Forecast, by Application 2019 & 2032
- Table 46: GCC End-Stage Renal Disease Industry Volume (K Unit) Forecast, by Application 2019 & 2032
- Table 47: South Africa End-Stage Renal Disease Industry Revenue (Million) Forecast, by Application 2019 & 2032
- Table 48: South Africa End-Stage Renal Disease Industry Volume (K Unit) Forecast, by Application 2019 & 2032
- Table 49: Rest of Middle East and Africa End-Stage Renal Disease Industry Revenue (Million) Forecast, by Application 2019 & 2032
- Table 50: Rest of Middle East and Africa End-Stage Renal Disease Industry Volume (K Unit) Forecast, by Application 2019 & 2032
- Table 51: Global End-Stage Renal Disease Industry Revenue Million Forecast, by Country 2019 & 2032
- Table 52: Global End-Stage Renal Disease Industry Volume K Unit Forecast, by Country 2019 & 2032
- Table 53: Brazil End-Stage Renal Disease Industry Revenue (Million) Forecast, by Application 2019 & 2032
- Table 54: Brazil End-Stage Renal Disease Industry Volume (K Unit) Forecast, by Application 2019 & 2032
- Table 55: Argentina End-Stage Renal Disease Industry Revenue (Million) Forecast, by Application 2019 & 2032
- Table 56: Argentina End-Stage Renal Disease Industry Volume (K Unit) Forecast, by Application 2019 & 2032
- Table 57: Rest of South America End-Stage Renal Disease Industry Revenue (Million) Forecast, by Application 2019 & 2032
- Table 58: Rest of South America End-Stage Renal Disease Industry Volume (K Unit) Forecast, by Application 2019 & 2032
- Table 59: Global End-Stage Renal Disease Industry Revenue Million Forecast, by Treatment 2019 & 2032
- Table 60: Global End-Stage Renal Disease Industry Volume K Unit Forecast, by Treatment 2019 & 2032
- Table 61: Global End-Stage Renal Disease Industry Revenue Million Forecast, by Country 2019 & 2032
- Table 62: Global End-Stage Renal Disease Industry Volume K Unit Forecast, by Country 2019 & 2032
- Table 63: United States End-Stage Renal Disease Industry Revenue (Million) Forecast, by Application 2019 & 2032
- Table 64: United States End-Stage Renal Disease Industry Volume (K Unit) Forecast, by Application 2019 & 2032
- Table 65: Canada End-Stage Renal Disease Industry Revenue (Million) Forecast, by Application 2019 & 2032
- Table 66: Canada End-Stage Renal Disease Industry Volume (K Unit) Forecast, by Application 2019 & 2032
- Table 67: Mexico End-Stage Renal Disease Industry Revenue (Million) Forecast, by Application 2019 & 2032
- Table 68: Mexico End-Stage Renal Disease Industry Volume (K Unit) Forecast, by Application 2019 & 2032
- Table 69: Global End-Stage Renal Disease Industry Revenue Million Forecast, by Treatment 2019 & 2032
- Table 70: Global End-Stage Renal Disease Industry Volume K Unit Forecast, by Treatment 2019 & 2032
- Table 71: Global End-Stage Renal Disease Industry Revenue Million Forecast, by Country 2019 & 2032
- Table 72: Global End-Stage Renal Disease Industry Volume K Unit Forecast, by Country 2019 & 2032
- Table 73: Germany End-Stage Renal Disease Industry Revenue (Million) Forecast, by Application 2019 & 2032
- Table 74: Germany End-Stage Renal Disease Industry Volume (K Unit) Forecast, by Application 2019 & 2032
- Table 75: United Kingdom End-Stage Renal Disease Industry Revenue (Million) Forecast, by Application 2019 & 2032
- Table 76: United Kingdom End-Stage Renal Disease Industry Volume (K Unit) Forecast, by Application 2019 & 2032
- Table 77: France End-Stage Renal Disease Industry Revenue (Million) Forecast, by Application 2019 & 2032
- Table 78: France End-Stage Renal Disease Industry Volume (K Unit) Forecast, by Application 2019 & 2032
- Table 79: Italy End-Stage Renal Disease Industry Revenue (Million) Forecast, by Application 2019 & 2032
- Table 80: Italy End-Stage Renal Disease Industry Volume (K Unit) Forecast, by Application 2019 & 2032
- Table 81: Spain End-Stage Renal Disease Industry Revenue (Million) Forecast, by Application 2019 & 2032
- Table 82: Spain End-Stage Renal Disease Industry Volume (K Unit) Forecast, by Application 2019 & 2032
- Table 83: Rest of Europe End-Stage Renal Disease Industry Revenue (Million) Forecast, by Application 2019 & 2032
- Table 84: Rest of Europe End-Stage Renal Disease Industry Volume (K Unit) Forecast, by Application 2019 & 2032
- Table 85: Global End-Stage Renal Disease Industry Revenue Million Forecast, by Treatment 2019 & 2032
- Table 86: Global End-Stage Renal Disease Industry Volume K Unit Forecast, by Treatment 2019 & 2032
- Table 87: Global End-Stage Renal Disease Industry Revenue Million Forecast, by Country 2019 & 2032
- Table 88: Global End-Stage Renal Disease Industry Volume K Unit Forecast, by Country 2019 & 2032
- Table 89: China End-Stage Renal Disease Industry Revenue (Million) Forecast, by Application 2019 & 2032
- Table 90: China End-Stage Renal Disease Industry Volume (K Unit) Forecast, by Application 2019 & 2032
- Table 91: Japan End-Stage Renal Disease Industry Revenue (Million) Forecast, by Application 2019 & 2032
- Table 92: Japan End-Stage Renal Disease Industry Volume (K Unit) Forecast, by Application 2019 & 2032
- Table 93: India End-Stage Renal Disease Industry Revenue (Million) Forecast, by Application 2019 & 2032
- Table 94: India End-Stage Renal Disease Industry Volume (K Unit) Forecast, by Application 2019 & 2032
- Table 95: Australia End-Stage Renal Disease Industry Revenue (Million) Forecast, by Application 2019 & 2032
- Table 96: Australia End-Stage Renal Disease Industry Volume (K Unit) Forecast, by Application 2019 & 2032
- Table 97: South Korea End-Stage Renal Disease Industry Revenue (Million) Forecast, by Application 2019 & 2032
- Table 98: South Korea End-Stage Renal Disease Industry Volume (K Unit) Forecast, by Application 2019 & 2032
- Table 99: Rest of Asia Pacific End-Stage Renal Disease Industry Revenue (Million) Forecast, by Application 2019 & 2032
- Table 100: Rest of Asia Pacific End-Stage Renal Disease Industry Volume (K Unit) Forecast, by Application 2019 & 2032
- Table 101: Global End-Stage Renal Disease Industry Revenue Million Forecast, by Treatment 2019 & 2032
- Table 102: Global End-Stage Renal Disease Industry Volume K Unit Forecast, by Treatment 2019 & 2032
- Table 103: Global End-Stage Renal Disease Industry Revenue Million Forecast, by Country 2019 & 2032
- Table 104: Global End-Stage Renal Disease Industry Volume K Unit Forecast, by Country 2019 & 2032
- Table 105: GCC End-Stage Renal Disease Industry Revenue (Million) Forecast, by Application 2019 & 2032
- Table 106: GCC End-Stage Renal Disease Industry Volume (K Unit) Forecast, by Application 2019 & 2032
- Table 107: South Africa End-Stage Renal Disease Industry Revenue (Million) Forecast, by Application 2019 & 2032
- Table 108: South Africa End-Stage Renal Disease Industry Volume (K Unit) Forecast, by Application 2019 & 2032
- Table 109: Rest of Middle East and Africa End-Stage Renal Disease Industry Revenue (Million) Forecast, by Application 2019 & 2032
- Table 110: Rest of Middle East and Africa End-Stage Renal Disease Industry Volume (K Unit) Forecast, by Application 2019 & 2032
- Table 111: Global End-Stage Renal Disease Industry Revenue Million Forecast, by Treatment 2019 & 2032
- Table 112: Global End-Stage Renal Disease Industry Volume K Unit Forecast, by Treatment 2019 & 2032
- Table 113: Global End-Stage Renal Disease Industry Revenue Million Forecast, by Country 2019 & 2032
- Table 114: Global End-Stage Renal Disease Industry Volume K Unit Forecast, by Country 2019 & 2032
- Table 115: Brazil End-Stage Renal Disease Industry Revenue (Million) Forecast, by Application 2019 & 2032
- Table 116: Brazil End-Stage Renal Disease Industry Volume (K Unit) Forecast, by Application 2019 & 2032
- Table 117: Argentina End-Stage Renal Disease Industry Revenue (Million) Forecast, by Application 2019 & 2032
- Table 118: Argentina End-Stage Renal Disease Industry Volume (K Unit) Forecast, by Application 2019 & 2032
- Table 119: Rest of South America End-Stage Renal Disease Industry Revenue (Million) Forecast, by Application 2019 & 2032
- Table 120: Rest of South America End-Stage Renal Disease Industry Volume (K Unit) Forecast, by Application 2019 & 2032
Frequently Asked Questions
1. What is the projected Compound Annual Growth Rate (CAGR) of the End-Stage Renal Disease Industry?
The projected CAGR is approximately 10.00%.
2. Which companies are prominent players in the End-Stage Renal Disease Industry?
Key companies in the market include Nikkiso Co Ltd, Nipro Corporation, Asahi Kasei Medical Co Ltd, Medtronic PLC, Fresenius SE & Co KGaA, Becton Dickinson and Company, Cantel Medical (STERIS), Baxter International Inc, B Braun SE.
3. What are the main segments of the End-Stage Renal Disease Industry?
The market segments include Treatment.
4. Can you provide details about the market size?
The market size is estimated to be USD XX Million as of 2022.
5. What are some drivers contributing to market growth?
Increase in Number of Patient Suffering from Chronic Kidney Disease; Introduction of Technologically Advanced Products; Rising Prevalence of Diabetes and Hypertension.
6. What are the notable trends driving market growth?
Dialysis Segment by Treatment is Expected to Witness a Significant Growth over the Forecast Period.
7. Are there any restraints impacting market growth?
Delay in Diagnosis of the Chronic Kidney Disease.
8. Can you provide examples of recent developments in the market?
April 2022- Fresenius Medical Care announced that the United States FDA approved the Versi PD Cycler System. It is a next-generation portable automated peritoneal dialysis system approved in North America.
9. What pricing options are available for accessing the report?
Pricing options include single-user, multi-user, and enterprise licenses priced at USD 4750, USD 5250, and USD 8750 respectively.
10. Is the market size provided in terms of value or volume?
The market size is provided in terms of value, measured in Million and volume, measured in K Unit.
11. Are there any specific market keywords associated with the report?
Yes, the market keyword associated with the report is "End-Stage Renal Disease Industry," which aids in identifying and referencing the specific market segment covered.
12. How do I determine which pricing option suits my needs best?
The pricing options vary based on user requirements and access needs. Individual users may opt for single-user licenses, while businesses requiring broader access may choose multi-user or enterprise licenses for cost-effective access to the report.
13. Are there any additional resources or data provided in the End-Stage Renal Disease Industry report?
While the report offers comprehensive insights, it's advisable to review the specific contents or supplementary materials provided to ascertain if additional resources or data are available.
14. How can I stay updated on further developments or reports in the End-Stage Renal Disease Industry?
To stay informed about further developments, trends, and reports in the End-Stage Renal Disease Industry, consider subscribing to industry newsletters, following relevant companies and organizations, or regularly checking reputable industry news sources and publications.
Methodology
Step 1 - Identification of Relevant Samples Size from Population Database


Step 2 - Approaches for Defining Global Market Size (Value, Volume* & Price*)

Note*: In applicable scenarios
Step 3 - Data Sources
Primary Research
- Web Analytics
- Survey Reports
- Research Institute
- Latest Research Reports
- Opinion Leaders
Secondary Research
- Annual Reports
- White Paper
- Latest Press Release
- Industry Association
- Paid Database
- Investor Presentations

Step 4 - Data Triangulation
Involves using different sources of information in order to increase the validity of a study
These sources are likely to be stakeholders in a program - participants, other researchers, program staff, other community members, and so on.
Then we put all data in single framework & apply various statistical tools to find out the dynamic on the market.
During the analysis stage, feedback from the stakeholder groups would be compared to determine areas of agreement as well as areas of divergence


