

Key Insights
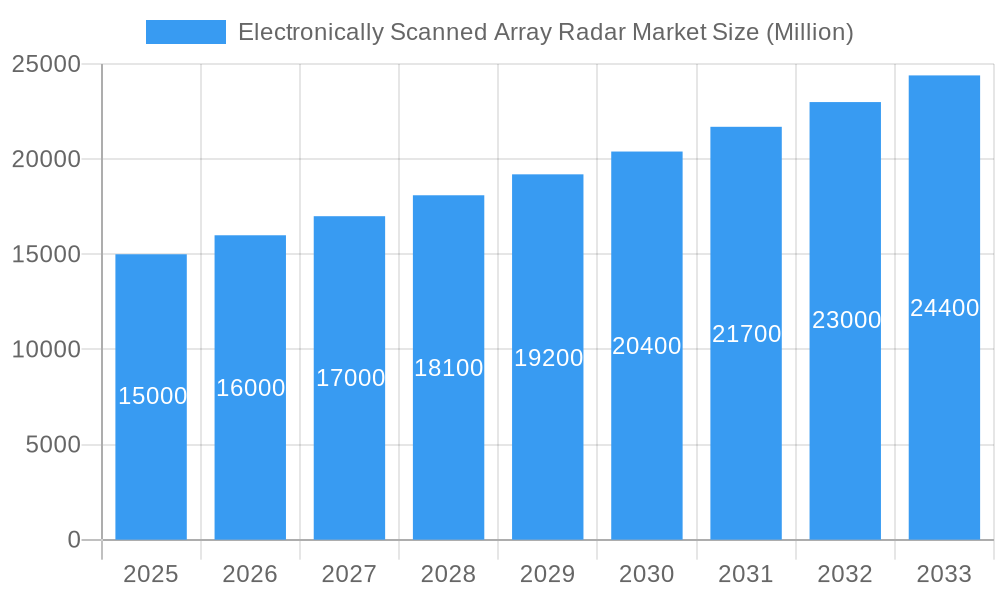
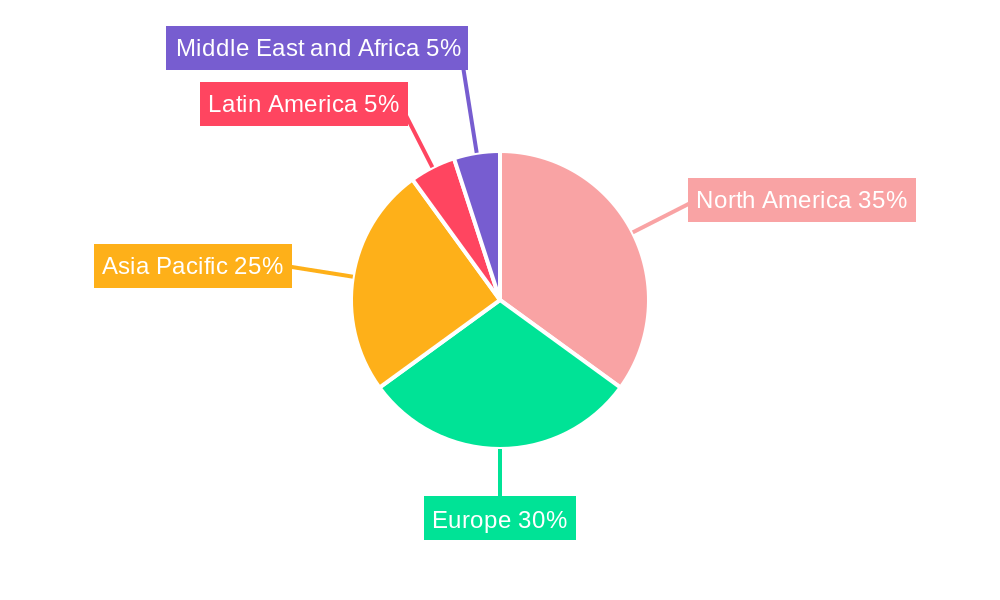
The Electronically Scanned Array (ESA) radar market is poised for substantial expansion, driven by escalating global defense expenditures and the burgeoning demand for sophisticated radar solutions across land, air, and maritime platforms. Projected to grow at a Compound Annual Growth Rate (CAGR) of 9.7%, the market is anticipated to reach a valuation of $12.35 billion by 2025. This growth trajectory is underpinned by several pivotal factors. Firstly, continuous technological advancements in ESA radar, including enhanced signal processing and miniaturization, are yielding superior performance and cost efficiencies. Secondly, the increasing imperative for advanced situational awareness and target detection in both military and civilian sectors is spurring widespread adoption. While active ESA systems currently lead due to their performance advantages, passive ESA systems are gaining traction for their cost-effectiveness and covert operational capabilities. The line-fit segment currently commands a larger market share, reflecting the integration of ESA radars into new platform manufacturing. Geographically, North America and Europe remain dominant, though the Asia-Pacific region is projected for significant growth, fueled by substantial investments in defense modernization and technological innovation.
Electronically Scanned Array Radar Market Market Size (In Billion)
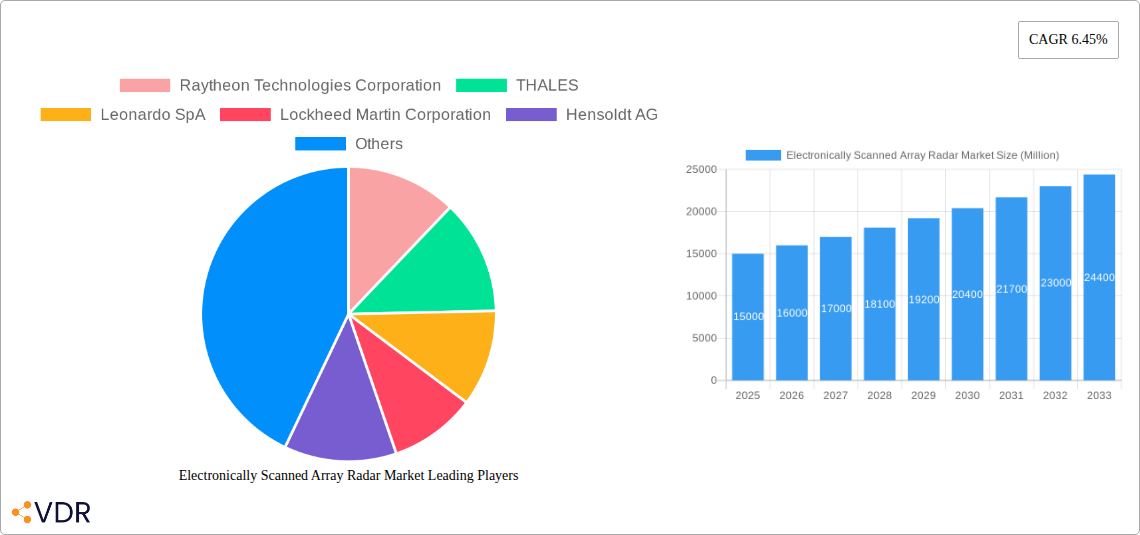
The competitive arena features established defense contractors alongside specialized radar manufacturers. Leading entities such as Raytheon Technologies, Thales, Leonardo SpA, and Lockheed Martin are reinforcing their market positions through technological prowess and robust supply chains. Emerging players are also making notable contributions, particularly in developing niche solutions. Strategic collaborations and mergers are actively shaping the market, fostering technological consolidation and expanded reach. Future market expansion will be significantly influenced by the integration of Artificial Intelligence (AI) and machine learning into ESA radar systems, enabling advanced features like automated target recognition and improved threat identification. Persistent global demand for enhanced surveillance and air defense capabilities will continue to propel market growth throughout the forecast period.
Electronically Scanned Array Radar Market Company Market Share
Electronically Scanned Array Radar Market: A Comprehensive Report (2019-2033)
This comprehensive report provides an in-depth analysis of the Electronically Scanned Array (ESA) Radar market, encompassing its parent market (Defense Electronics) and child markets (Airborne Radar, Naval Radar, Ground-Based Radar). The report covers the period from 2019 to 2033, with a focus on the forecast period of 2025-2033 and a base year of 2025. The market size is valued in million units. Key players like Raytheon Technologies Corporation, Thales, and Lockheed Martin are profiled, highlighting their contributions to market growth and innovation.
Electronically Scanned Array Radar Market Dynamics & Structure
The Electronically Scanned Array Radar market exhibits a moderately concentrated structure, with a few major players holding significant market share. Technological innovation, particularly in areas like GaN technology and advanced signal processing, is a key driver. Stringent regulatory frameworks governing defense procurement impact market dynamics. Competitive product substitutes, such as mechanically scanned radars, exert pressure on ESA radar adoption. End-user demographics, primarily governments and military organizations, heavily influence demand. M&A activities, though not frequent, reshape the competitive landscape.
- Market Concentration: Top 5 players hold approximately xx% of the market share in 2025.
- Technological Innovation: Advancements in GaN technology are driving higher power output and efficiency.
- Regulatory Frameworks: Stringent defense procurement regulations influence contract awards and timelines.
- Competitive Substitutes: Mechanically scanned radars remain a cost-effective alternative in certain applications.
- End-User Demographics: Military forces (Air Force, Navy, Army) constitute the primary end-users.
- M&A Trends: An average of xx M&A deals per year were observed in the historical period.
Electronically Scanned Array Radar Market Growth Trends & Insights
The ESA radar market demonstrates robust growth, driven by increasing defense budgets, modernization of existing radar systems, and technological advancements. The market experienced a CAGR of xx% during the historical period (2019-2024) and is projected to witness a CAGR of xx% during the forecast period (2025-2033), reaching a market size of xx million units by 2033. Adoption rates are highest in developed nations with advanced military capabilities. Technological disruptions, such as the integration of AI and machine learning, are enhancing radar performance and capabilities. Shifting consumer behavior towards more sophisticated and versatile radar systems further accelerates market growth. Market penetration is high in developed regions and is progressively increasing in developing economies.
Dominant Regions, Countries, or Segments in Electronically Scanned Array Radar Market
North America currently dominates the ESA radar market, driven by robust defense spending and technological advancements. However, the Asia-Pacific region is projected to exhibit the highest growth rate during the forecast period due to increased military expenditure and modernization efforts. The Active Electronically Scanned Array (AESA) segment holds the largest market share, owing to its superior performance and versatility compared to passive arrays. Airborne platforms dominate market applications, while the retrofit segment is gaining traction as nations upgrade their existing fleets.
- North America: High defense spending and technological leadership drive market dominance.
- Asia-Pacific: Rapid growth due to increased military modernization and economic growth.
- AESA Segment: Superior performance and versatility drive high market share.
- Airborne Platform: Largest application segment due to high demand from air forces.
- Retrofit Segment: Growing market due to upgrades of existing radar systems.
Electronically Scanned Array Radar Market Product Landscape
ESA radars are characterized by their advanced signal processing capabilities, high resolution, and improved target detection. Product innovations focus on miniaturization, enhanced frequency agility, and improved anti-jamming capabilities. Applications span diverse sectors, including air defense, surveillance, and navigation. Key performance metrics include range, accuracy, and update rate. Unique selling propositions include improved situational awareness and multi-target tracking abilities. Technological advancements are centered on the integration of AI/ML and improved material sciences.
Key Drivers, Barriers & Challenges in Electronically Scanned Array Radar Market
Key Drivers:
- Increasing defense budgets globally.
- Growing need for advanced surveillance and air defense systems.
- Technological advancements in areas like GaN and digital beamforming.
- Rising demand for improved situational awareness.
Key Challenges:
- High initial cost of AESA radars.
- Complex integration with existing systems.
- Supply chain disruptions affecting component availability.
- Intense competition among established and emerging players.
Emerging Opportunities in Electronically Scanned Array Radar Market
- Expanding into emerging markets with growing defense budgets.
- Development of specialized ESA radars for specific applications (e.g., counter-drone).
- Integration with other sensor systems to enhance situational awareness.
- Exploring new materials and manufacturing processes to reduce costs.
Growth Accelerators in the Electronically Scanned Array Radar Market Industry
Technological breakthroughs, particularly in GaN technology and AI/ML integration, are key growth accelerators. Strategic partnerships between defense contractors and technology companies are fostering innovation and enhancing product capabilities. Market expansion strategies focusing on emerging markets and new applications will drive further growth.
Key Players Shaping the Electronically Scanned Array Radar Market Market
Notable Milestones in Electronically Scanned Array Radar Market Sector
- March 2023: Indian MoD signs USD 448.44 million contract with Bharat Electronics Limited for radar and warning receivers.
- September 2022: Raytheon secures a USD 19.4 million contract for APG-79 AESA radar system support.
In-Depth Electronically Scanned Array Radar Market Market Outlook
The Electronically Scanned Array Radar market is poised for continued growth, driven by technological advancements and increasing defense modernization efforts. Strategic partnerships and investments in R&D will shape the competitive landscape. The market presents significant opportunities for companies specializing in advanced radar technologies, particularly in areas like AI/ML integration and GaN technology. Emerging markets offer substantial untapped potential for market expansion.
Electronically Scanned Array Radar Market Segmentation
- 1. Production Analysis
- 2. Consumption Analysis
- 3. Import Market Analysis (Value & Volume)
- 4. Export Market Analysis (Value & Volume)
- 5. Price Trend Analysis
Electronically Scanned Array Radar Market Segmentation By Geography
-
1. North America
- 1.1. United States
- 1.2. Canada
- 1.3. Mexico
-
2. South America
- 2.1. Brazil
- 2.2. Argentina
- 2.3. Rest of South America
-
3. Europe
- 3.1. United Kingdom
- 3.2. Germany
- 3.3. France
- 3.4. Italy
- 3.5. Spain
- 3.6. Russia
- 3.7. Benelux
- 3.8. Nordics
- 3.9. Rest of Europe
-
4. Middle East & Africa
- 4.1. Turkey
- 4.2. Israel
- 4.3. GCC
- 4.4. North Africa
- 4.5. South Africa
- 4.6. Rest of Middle East & Africa
-
5. Asia Pacific
- 5.1. China
- 5.2. India
- 5.3. Japan
- 5.4. South Korea
- 5.5. ASEAN
- 5.6. Oceania
- 5.7. Rest of Asia Pacific
Electronically Scanned Array Radar Market Regional Market Share
Geographic Coverage of Electronically Scanned Array Radar Market
Electronically Scanned Array Radar Market REPORT HIGHLIGHTS
| Aspects | Details |
|---|---|
| Study Period | 2020-2034 |
| Base Year | 2025 |
| Estimated Year | 2026 |
| Forecast Period | 2026-2034 |
| Historical Period | 2020-2025 |
| Growth Rate | CAGR of 9.7% from 2020-2034 |
| Segmentation |
|
Table of Contents
- 1. Introduction
- 1.1. Research Scope
- 1.2. Market Segmentation
- 1.3. Research Objective
- 1.4. Definitions and Assumptions
- 2. Executive Summary
- 2.1. Market Snapshot
- 3. Market Dynamics
- 3.1. Market Drivers
- 3.2. Market Restrains
- 3.3. Market Trends
- 3.4. Market Opportunities
- 4. Market Factor Analysis
- 4.1. Porters Five Forces
- 4.1.1. Bargaining Power of Suppliers
- 4.1.2. Bargaining Power of Buyers
- 4.1.3. Threat of New Entrants
- 4.1.4. Threat of Substitutes
- 4.1.5. Competitive Rivalry
- 4.2. PESTEL analysis
- 4.3. BCG Analysis
- 4.3.1. Stars (High Growth, High Market Share)
- 4.3.2. Cash Cows (Low Growth, High Market Share)
- 4.3.3. Question Mark (High Growth, Low Market Share)
- 4.3.4. Dogs (Low Growth, Low Market Share)
- 4.4. Ansoff Matrix Analysis
- 4.5. Supply Chain Analysis
- 4.6. Regulatory Landscape
- 4.7. Current Market Potential and Opportunity Assessment (TAM–SAM–SOM Framework)
- 4.8. VDR Analyst Note
- 4.1. Porters Five Forces
- 5. Market Analysis, Insights and Forecast 2021-2033
- 5.1. Market Analysis, Insights and Forecast - by Production Analysis
- 5.2. Market Analysis, Insights and Forecast - by Consumption Analysis
- 5.3. Market Analysis, Insights and Forecast - by Import Market Analysis (Value & Volume)
- 5.4. Market Analysis, Insights and Forecast - by Export Market Analysis (Value & Volume)
- 5.5. Market Analysis, Insights and Forecast - by Price Trend Analysis
- 5.6. Market Analysis, Insights and Forecast - by Region
- 5.6.1. North America
- 5.6.2. South America
- 5.6.3. Europe
- 5.6.4. Middle East & Africa
- 5.6.5. Asia Pacific
- 6. Global Electronically Scanned Array Radar Market Analysis, Insights and Forecast, 2021-2033
- 6.1. Market Analysis, Insights and Forecast - by Production Analysis
- 6.2. Market Analysis, Insights and Forecast - by Consumption Analysis
- 6.3. Market Analysis, Insights and Forecast - by Import Market Analysis (Value & Volume)
- 6.4. Market Analysis, Insights and Forecast - by Export Market Analysis (Value & Volume)
- 6.5. Market Analysis, Insights and Forecast - by Price Trend Analysis
- 7. North America Electronically Scanned Array Radar Market Analysis, Insights and Forecast, 2021-2033
- 7.1. Market Analysis, Insights and Forecast - by Production Analysis
- 7.2. Market Analysis, Insights and Forecast - by Consumption Analysis
- 7.3. Market Analysis, Insights and Forecast - by Import Market Analysis (Value & Volume)
- 7.4. Market Analysis, Insights and Forecast - by Export Market Analysis (Value & Volume)
- 7.5. Market Analysis, Insights and Forecast - by Price Trend Analysis
- 8. South America Electronically Scanned Array Radar Market Analysis, Insights and Forecast, 2021-2033
- 8.1. Market Analysis, Insights and Forecast - by Production Analysis
- 8.2. Market Analysis, Insights and Forecast - by Consumption Analysis
- 8.3. Market Analysis, Insights and Forecast - by Import Market Analysis (Value & Volume)
- 8.4. Market Analysis, Insights and Forecast - by Export Market Analysis (Value & Volume)
- 8.5. Market Analysis, Insights and Forecast - by Price Trend Analysis
- 9. Europe Electronically Scanned Array Radar Market Analysis, Insights and Forecast, 2021-2033
- 9.1. Market Analysis, Insights and Forecast - by Production Analysis
- 9.2. Market Analysis, Insights and Forecast - by Consumption Analysis
- 9.3. Market Analysis, Insights and Forecast - by Import Market Analysis (Value & Volume)
- 9.4. Market Analysis, Insights and Forecast - by Export Market Analysis (Value & Volume)
- 9.5. Market Analysis, Insights and Forecast - by Price Trend Analysis
- 10. Middle East & Africa Electronically Scanned Array Radar Market Analysis, Insights and Forecast, 2021-2033
- 10.1. Market Analysis, Insights and Forecast - by Production Analysis
- 10.2. Market Analysis, Insights and Forecast - by Consumption Analysis
- 10.3. Market Analysis, Insights and Forecast - by Import Market Analysis (Value & Volume)
- 10.4. Market Analysis, Insights and Forecast - by Export Market Analysis (Value & Volume)
- 10.5. Market Analysis, Insights and Forecast - by Price Trend Analysis
- 11. Asia Pacific Electronically Scanned Array Radar Market Analysis, Insights and Forecast, 2021-2033
- 11.1. Market Analysis, Insights and Forecast - by Production Analysis
- 11.2. Market Analysis, Insights and Forecast - by Consumption Analysis
- 11.3. Market Analysis, Insights and Forecast - by Import Market Analysis (Value & Volume)
- 11.4. Market Analysis, Insights and Forecast - by Export Market Analysis (Value & Volume)
- 11.5. Market Analysis, Insights and Forecast - by Price Trend Analysis
- 12. Competitive Analysis
- 12.1. Company Profiles
- 12.1.1 Raytheon Technologies Corporation
- 12.1.1.1. Company Overview
- 12.1.1.2. Products
- 12.1.1.3. Company Financials
- 12.1.1.4. SWOT Analysis
- 12.1.2 THALES
- 12.1.2.1. Company Overview
- 12.1.2.2. Products
- 12.1.2.3. Company Financials
- 12.1.2.4. SWOT Analysis
- 12.1.3 Leonardo SpA
- 12.1.3.1. Company Overview
- 12.1.3.2. Products
- 12.1.3.3. Company Financials
- 12.1.3.4. SWOT Analysis
- 12.1.4 Lockheed Martin Corporation
- 12.1.4.1. Company Overview
- 12.1.4.2. Products
- 12.1.4.3. Company Financials
- 12.1.4.4. SWOT Analysis
- 12.1.5 Hensoldt AG
- 12.1.5.1. Company Overview
- 12.1.5.2. Products
- 12.1.5.3. Company Financials
- 12.1.5.4. SWOT Analysis
- 12.1.6 RADA Electronic Industries Ltd
- 12.1.6.1. Company Overview
- 12.1.6.2. Products
- 12.1.6.3. Company Financials
- 12.1.6.4. SWOT Analysis
- 12.1.7 Mitsubishi Electric Corporation
- 12.1.7.1. Company Overview
- 12.1.7.2. Products
- 12.1.7.3. Company Financials
- 12.1.7.4. SWOT Analysis
- 12.1.8 Israel Aerospace Industries
- 12.1.8.1. Company Overview
- 12.1.8.2. Products
- 12.1.8.3. Company Financials
- 12.1.8.4. SWOT Analysis
- 12.1.9 ASELSAN A
- 12.1.9.1. Company Overview
- 12.1.9.2. Products
- 12.1.9.3. Company Financials
- 12.1.9.4. SWOT Analysis
- 12.1.10 CEA Technologies
- 12.1.10.1. Company Overview
- 12.1.10.2. Products
- 12.1.10.3. Company Financials
- 12.1.10.4. SWOT Analysis
- 12.1.11 Northrop Grumman Corporation
- 12.1.11.1. Company Overview
- 12.1.11.2. Products
- 12.1.11.3. Company Financials
- 12.1.11.4. SWOT Analysis
- 12.1.12 Saab AB
- 12.1.12.1. Company Overview
- 12.1.12.2. Products
- 12.1.12.3. Company Financials
- 12.1.12.4. SWOT Analysis
- 12.1.1 Raytheon Technologies Corporation
- 12.2. Market Entropy
- 12.2.1 Company's Key Areas Served
- 12.2.2 Recent Developments
- 12.3. Company Market Share Analysis 2025
- 12.3.1 Top 5 Companies Market Share Analysis
- 12.3.2 Top 3 Companies Market Share Analysis
- 12.4. List of Potential Customers
- 13. Research Methodology
List of Figures
- Figure 1: Global Electronically Scanned Array Radar Market Revenue Breakdown (billion, %) by Region 2025 & 2033
- Figure 2: North America Electronically Scanned Array Radar Market Revenue (billion), by Production Analysis 2025 & 2033
- Figure 3: North America Electronically Scanned Array Radar Market Revenue Share (%), by Production Analysis 2025 & 2033
- Figure 4: North America Electronically Scanned Array Radar Market Revenue (billion), by Consumption Analysis 2025 & 2033
- Figure 5: North America Electronically Scanned Array Radar Market Revenue Share (%), by Consumption Analysis 2025 & 2033
- Figure 6: North America Electronically Scanned Array Radar Market Revenue (billion), by Import Market Analysis (Value & Volume) 2025 & 2033
- Figure 7: North America Electronically Scanned Array Radar Market Revenue Share (%), by Import Market Analysis (Value & Volume) 2025 & 2033
- Figure 8: North America Electronically Scanned Array Radar Market Revenue (billion), by Export Market Analysis (Value & Volume) 2025 & 2033
- Figure 9: North America Electronically Scanned Array Radar Market Revenue Share (%), by Export Market Analysis (Value & Volume) 2025 & 2033
- Figure 10: North America Electronically Scanned Array Radar Market Revenue (billion), by Price Trend Analysis 2025 & 2033
- Figure 11: North America Electronically Scanned Array Radar Market Revenue Share (%), by Price Trend Analysis 2025 & 2033
- Figure 12: North America Electronically Scanned Array Radar Market Revenue (billion), by Country 2025 & 2033
- Figure 13: North America Electronically Scanned Array Radar Market Revenue Share (%), by Country 2025 & 2033
- Figure 14: South America Electronically Scanned Array Radar Market Revenue (billion), by Production Analysis 2025 & 2033
- Figure 15: South America Electronically Scanned Array Radar Market Revenue Share (%), by Production Analysis 2025 & 2033
- Figure 16: South America Electronically Scanned Array Radar Market Revenue (billion), by Consumption Analysis 2025 & 2033
- Figure 17: South America Electronically Scanned Array Radar Market Revenue Share (%), by Consumption Analysis 2025 & 2033
- Figure 18: South America Electronically Scanned Array Radar Market Revenue (billion), by Import Market Analysis (Value & Volume) 2025 & 2033
- Figure 19: South America Electronically Scanned Array Radar Market Revenue Share (%), by Import Market Analysis (Value & Volume) 2025 & 2033
- Figure 20: South America Electronically Scanned Array Radar Market Revenue (billion), by Export Market Analysis (Value & Volume) 2025 & 2033
- Figure 21: South America Electronically Scanned Array Radar Market Revenue Share (%), by Export Market Analysis (Value & Volume) 2025 & 2033
- Figure 22: South America Electronically Scanned Array Radar Market Revenue (billion), by Price Trend Analysis 2025 & 2033
- Figure 23: South America Electronically Scanned Array Radar Market Revenue Share (%), by Price Trend Analysis 2025 & 2033
- Figure 24: South America Electronically Scanned Array Radar Market Revenue (billion), by Country 2025 & 2033
- Figure 25: South America Electronically Scanned Array Radar Market Revenue Share (%), by Country 2025 & 2033
- Figure 26: Europe Electronically Scanned Array Radar Market Revenue (billion), by Production Analysis 2025 & 2033
- Figure 27: Europe Electronically Scanned Array Radar Market Revenue Share (%), by Production Analysis 2025 & 2033
- Figure 28: Europe Electronically Scanned Array Radar Market Revenue (billion), by Consumption Analysis 2025 & 2033
- Figure 29: Europe Electronically Scanned Array Radar Market Revenue Share (%), by Consumption Analysis 2025 & 2033
- Figure 30: Europe Electronically Scanned Array Radar Market Revenue (billion), by Import Market Analysis (Value & Volume) 2025 & 2033
- Figure 31: Europe Electronically Scanned Array Radar Market Revenue Share (%), by Import Market Analysis (Value & Volume) 2025 & 2033
- Figure 32: Europe Electronically Scanned Array Radar Market Revenue (billion), by Export Market Analysis (Value & Volume) 2025 & 2033
- Figure 33: Europe Electronically Scanned Array Radar Market Revenue Share (%), by Export Market Analysis (Value & Volume) 2025 & 2033
- Figure 34: Europe Electronically Scanned Array Radar Market Revenue (billion), by Price Trend Analysis 2025 & 2033
- Figure 35: Europe Electronically Scanned Array Radar Market Revenue Share (%), by Price Trend Analysis 2025 & 2033
- Figure 36: Europe Electronically Scanned Array Radar Market Revenue (billion), by Country 2025 & 2033
- Figure 37: Europe Electronically Scanned Array Radar Market Revenue Share (%), by Country 2025 & 2033
- Figure 38: Middle East & Africa Electronically Scanned Array Radar Market Revenue (billion), by Production Analysis 2025 & 2033
- Figure 39: Middle East & Africa Electronically Scanned Array Radar Market Revenue Share (%), by Production Analysis 2025 & 2033
- Figure 40: Middle East & Africa Electronically Scanned Array Radar Market Revenue (billion), by Consumption Analysis 2025 & 2033
- Figure 41: Middle East & Africa Electronically Scanned Array Radar Market Revenue Share (%), by Consumption Analysis 2025 & 2033
- Figure 42: Middle East & Africa Electronically Scanned Array Radar Market Revenue (billion), by Import Market Analysis (Value & Volume) 2025 & 2033
- Figure 43: Middle East & Africa Electronically Scanned Array Radar Market Revenue Share (%), by Import Market Analysis (Value & Volume) 2025 & 2033
- Figure 44: Middle East & Africa Electronically Scanned Array Radar Market Revenue (billion), by Export Market Analysis (Value & Volume) 2025 & 2033
- Figure 45: Middle East & Africa Electronically Scanned Array Radar Market Revenue Share (%), by Export Market Analysis (Value & Volume) 2025 & 2033
- Figure 46: Middle East & Africa Electronically Scanned Array Radar Market Revenue (billion), by Price Trend Analysis 2025 & 2033
- Figure 47: Middle East & Africa Electronically Scanned Array Radar Market Revenue Share (%), by Price Trend Analysis 2025 & 2033
- Figure 48: Middle East & Africa Electronically Scanned Array Radar Market Revenue (billion), by Country 2025 & 2033
- Figure 49: Middle East & Africa Electronically Scanned Array Radar Market Revenue Share (%), by Country 2025 & 2033
- Figure 50: Asia Pacific Electronically Scanned Array Radar Market Revenue (billion), by Production Analysis 2025 & 2033
- Figure 51: Asia Pacific Electronically Scanned Array Radar Market Revenue Share (%), by Production Analysis 2025 & 2033
- Figure 52: Asia Pacific Electronically Scanned Array Radar Market Revenue (billion), by Consumption Analysis 2025 & 2033
- Figure 53: Asia Pacific Electronically Scanned Array Radar Market Revenue Share (%), by Consumption Analysis 2025 & 2033
- Figure 54: Asia Pacific Electronically Scanned Array Radar Market Revenue (billion), by Import Market Analysis (Value & Volume) 2025 & 2033
- Figure 55: Asia Pacific Electronically Scanned Array Radar Market Revenue Share (%), by Import Market Analysis (Value & Volume) 2025 & 2033
- Figure 56: Asia Pacific Electronically Scanned Array Radar Market Revenue (billion), by Export Market Analysis (Value & Volume) 2025 & 2033
- Figure 57: Asia Pacific Electronically Scanned Array Radar Market Revenue Share (%), by Export Market Analysis (Value & Volume) 2025 & 2033
- Figure 58: Asia Pacific Electronically Scanned Array Radar Market Revenue (billion), by Price Trend Analysis 2025 & 2033
- Figure 59: Asia Pacific Electronically Scanned Array Radar Market Revenue Share (%), by Price Trend Analysis 2025 & 2033
- Figure 60: Asia Pacific Electronically Scanned Array Radar Market Revenue (billion), by Country 2025 & 2033
- Figure 61: Asia Pacific Electronically Scanned Array Radar Market Revenue Share (%), by Country 2025 & 2033
List of Tables
- Table 1: Global Electronically Scanned Array Radar Market Revenue billion Forecast, by Production Analysis 2020 & 2033
- Table 2: Global Electronically Scanned Array Radar Market Revenue billion Forecast, by Consumption Analysis 2020 & 2033
- Table 3: Global Electronically Scanned Array Radar Market Revenue billion Forecast, by Import Market Analysis (Value & Volume) 2020 & 2033
- Table 4: Global Electronically Scanned Array Radar Market Revenue billion Forecast, by Export Market Analysis (Value & Volume) 2020 & 2033
- Table 5: Global Electronically Scanned Array Radar Market Revenue billion Forecast, by Price Trend Analysis 2020 & 2033
- Table 6: Global Electronically Scanned Array Radar Market Revenue billion Forecast, by Region 2020 & 2033
- Table 7: Global Electronically Scanned Array Radar Market Revenue billion Forecast, by Production Analysis 2020 & 2033
- Table 8: Global Electronically Scanned Array Radar Market Revenue billion Forecast, by Consumption Analysis 2020 & 2033
- Table 9: Global Electronically Scanned Array Radar Market Revenue billion Forecast, by Import Market Analysis (Value & Volume) 2020 & 2033
- Table 10: Global Electronically Scanned Array Radar Market Revenue billion Forecast, by Export Market Analysis (Value & Volume) 2020 & 2033
- Table 11: Global Electronically Scanned Array Radar Market Revenue billion Forecast, by Price Trend Analysis 2020 & 2033
- Table 12: Global Electronically Scanned Array Radar Market Revenue billion Forecast, by Country 2020 & 2033
- Table 13: United States Electronically Scanned Array Radar Market Revenue (billion) Forecast, by Application 2020 & 2033
- Table 14: Canada Electronically Scanned Array Radar Market Revenue (billion) Forecast, by Application 2020 & 2033
- Table 15: Mexico Electronically Scanned Array Radar Market Revenue (billion) Forecast, by Application 2020 & 2033
- Table 16: Global Electronically Scanned Array Radar Market Revenue billion Forecast, by Production Analysis 2020 & 2033
- Table 17: Global Electronically Scanned Array Radar Market Revenue billion Forecast, by Consumption Analysis 2020 & 2033
- Table 18: Global Electronically Scanned Array Radar Market Revenue billion Forecast, by Import Market Analysis (Value & Volume) 2020 & 2033
- Table 19: Global Electronically Scanned Array Radar Market Revenue billion Forecast, by Export Market Analysis (Value & Volume) 2020 & 2033
- Table 20: Global Electronically Scanned Array Radar Market Revenue billion Forecast, by Price Trend Analysis 2020 & 2033
- Table 21: Global Electronically Scanned Array Radar Market Revenue billion Forecast, by Country 2020 & 2033
- Table 22: Brazil Electronically Scanned Array Radar Market Revenue (billion) Forecast, by Application 2020 & 2033
- Table 23: Argentina Electronically Scanned Array Radar Market Revenue (billion) Forecast, by Application 2020 & 2033
- Table 24: Rest of South America Electronically Scanned Array Radar Market Revenue (billion) Forecast, by Application 2020 & 2033
- Table 25: Global Electronically Scanned Array Radar Market Revenue billion Forecast, by Production Analysis 2020 & 2033
- Table 26: Global Electronically Scanned Array Radar Market Revenue billion Forecast, by Consumption Analysis 2020 & 2033
- Table 27: Global Electronically Scanned Array Radar Market Revenue billion Forecast, by Import Market Analysis (Value & Volume) 2020 & 2033
- Table 28: Global Electronically Scanned Array Radar Market Revenue billion Forecast, by Export Market Analysis (Value & Volume) 2020 & 2033
- Table 29: Global Electronically Scanned Array Radar Market Revenue billion Forecast, by Price Trend Analysis 2020 & 2033
- Table 30: Global Electronically Scanned Array Radar Market Revenue billion Forecast, by Country 2020 & 2033
- Table 31: United Kingdom Electronically Scanned Array Radar Market Revenue (billion) Forecast, by Application 2020 & 2033
- Table 32: Germany Electronically Scanned Array Radar Market Revenue (billion) Forecast, by Application 2020 & 2033
- Table 33: France Electronically Scanned Array Radar Market Revenue (billion) Forecast, by Application 2020 & 2033
- Table 34: Italy Electronically Scanned Array Radar Market Revenue (billion) Forecast, by Application 2020 & 2033
- Table 35: Spain Electronically Scanned Array Radar Market Revenue (billion) Forecast, by Application 2020 & 2033
- Table 36: Russia Electronically Scanned Array Radar Market Revenue (billion) Forecast, by Application 2020 & 2033
- Table 37: Benelux Electronically Scanned Array Radar Market Revenue (billion) Forecast, by Application 2020 & 2033
- Table 38: Nordics Electronically Scanned Array Radar Market Revenue (billion) Forecast, by Application 2020 & 2033
- Table 39: Rest of Europe Electronically Scanned Array Radar Market Revenue (billion) Forecast, by Application 2020 & 2033
- Table 40: Global Electronically Scanned Array Radar Market Revenue billion Forecast, by Production Analysis 2020 & 2033
- Table 41: Global Electronically Scanned Array Radar Market Revenue billion Forecast, by Consumption Analysis 2020 & 2033
- Table 42: Global Electronically Scanned Array Radar Market Revenue billion Forecast, by Import Market Analysis (Value & Volume) 2020 & 2033
- Table 43: Global Electronically Scanned Array Radar Market Revenue billion Forecast, by Export Market Analysis (Value & Volume) 2020 & 2033
- Table 44: Global Electronically Scanned Array Radar Market Revenue billion Forecast, by Price Trend Analysis 2020 & 2033
- Table 45: Global Electronically Scanned Array Radar Market Revenue billion Forecast, by Country 2020 & 2033
- Table 46: Turkey Electronically Scanned Array Radar Market Revenue (billion) Forecast, by Application 2020 & 2033
- Table 47: Israel Electronically Scanned Array Radar Market Revenue (billion) Forecast, by Application 2020 & 2033
- Table 48: GCC Electronically Scanned Array Radar Market Revenue (billion) Forecast, by Application 2020 & 2033
- Table 49: North Africa Electronically Scanned Array Radar Market Revenue (billion) Forecast, by Application 2020 & 2033
- Table 50: South Africa Electronically Scanned Array Radar Market Revenue (billion) Forecast, by Application 2020 & 2033
- Table 51: Rest of Middle East & Africa Electronically Scanned Array Radar Market Revenue (billion) Forecast, by Application 2020 & 2033
- Table 52: Global Electronically Scanned Array Radar Market Revenue billion Forecast, by Production Analysis 2020 & 2033
- Table 53: Global Electronically Scanned Array Radar Market Revenue billion Forecast, by Consumption Analysis 2020 & 2033
- Table 54: Global Electronically Scanned Array Radar Market Revenue billion Forecast, by Import Market Analysis (Value & Volume) 2020 & 2033
- Table 55: Global Electronically Scanned Array Radar Market Revenue billion Forecast, by Export Market Analysis (Value & Volume) 2020 & 2033
- Table 56: Global Electronically Scanned Array Radar Market Revenue billion Forecast, by Price Trend Analysis 2020 & 2033
- Table 57: Global Electronically Scanned Array Radar Market Revenue billion Forecast, by Country 2020 & 2033
- Table 58: China Electronically Scanned Array Radar Market Revenue (billion) Forecast, by Application 2020 & 2033
- Table 59: India Electronically Scanned Array Radar Market Revenue (billion) Forecast, by Application 2020 & 2033
- Table 60: Japan Electronically Scanned Array Radar Market Revenue (billion) Forecast, by Application 2020 & 2033
- Table 61: South Korea Electronically Scanned Array Radar Market Revenue (billion) Forecast, by Application 2020 & 2033
- Table 62: ASEAN Electronically Scanned Array Radar Market Revenue (billion) Forecast, by Application 2020 & 2033
- Table 63: Oceania Electronically Scanned Array Radar Market Revenue (billion) Forecast, by Application 2020 & 2033
- Table 64: Rest of Asia Pacific Electronically Scanned Array Radar Market Revenue (billion) Forecast, by Application 2020 & 2033
Frequently Asked Questions
1. What is the projected Compound Annual Growth Rate (CAGR) of the Electronically Scanned Array Radar Market?
The projected CAGR is approximately 9.7%.
2. Which companies are prominent players in the Electronically Scanned Array Radar Market?
Key companies in the market include Raytheon Technologies Corporation, THALES, Leonardo SpA, Lockheed Martin Corporation, Hensoldt AG, RADA Electronic Industries Ltd, Mitsubishi Electric Corporation, Israel Aerospace Industries, ASELSAN A, CEA Technologies, Northrop Grumman Corporation, Saab AB.
3. What are the main segments of the Electronically Scanned Array Radar Market?
The market segments include Production Analysis, Consumption Analysis, Import Market Analysis (Value & Volume), Export Market Analysis (Value & Volume), Price Trend Analysis.
4. Can you provide details about the market size?
The market size is estimated to be USD 12.35 billion as of 2022.
5. What are some drivers contributing to market growth?
; Increasing Number Of Air Passengers; Use Of Portable Electronic Devices.
6. What are the notable trends driving market growth?
Active Electronically Scanned Array Segment to Dominate the Market During the Forecast Period.
7. Are there any restraints impacting market growth?
; High Cost Of Connectivity Equipments.
8. Can you provide examples of recent developments in the market?
In March 2023, The Indian Ministry of Defence (MoD) signed two contracts worth USD448.44m with the government-owned aerospace and defense electronics company Bharat Electronics Limited (BEL) to provide radar and warning receivers for Indian Air Force.
9. What pricing options are available for accessing the report?
Pricing options include single-user, multi-user, and enterprise licenses priced at USD 4750, USD 5250, and USD 8750 respectively.
10. Is the market size provided in terms of value or volume?
The market size is provided in terms of value, measured in billion.
11. Are there any specific market keywords associated with the report?
Yes, the market keyword associated with the report is "Electronically Scanned Array Radar Market," which aids in identifying and referencing the specific market segment covered.
12. How do I determine which pricing option suits my needs best?
The pricing options vary based on user requirements and access needs. Individual users may opt for single-user licenses, while businesses requiring broader access may choose multi-user or enterprise licenses for cost-effective access to the report.
13. Are there any additional resources or data provided in the Electronically Scanned Array Radar Market report?
While the report offers comprehensive insights, it's advisable to review the specific contents or supplementary materials provided to ascertain if additional resources or data are available.
14. How can I stay updated on further developments or reports in the Electronically Scanned Array Radar Market?
To stay informed about further developments, trends, and reports in the Electronically Scanned Array Radar Market, consider subscribing to industry newsletters, following relevant companies and organizations, or regularly checking reputable industry news sources and publications.
Methodology
Step 1 - Identification of Relevant Samples Size from Population Database


Step 2 - Approaches for Defining Global Market Size (Value, Volume* & Price*)

Note*: In applicable scenarios
Step 3 - Data Sources
Primary Research
- Web Analytics
- Survey Reports
- Research Institute
- Latest Research Reports
- Opinion Leaders
Secondary Research
- Annual Reports
- White Paper
- Latest Press Release
- Industry Association
- Paid Database
- Investor Presentations

Step 4 - Data Triangulation
Involves using different sources of information in order to increase the validity of a study
These sources are likely to be stakeholders in a program - participants, other researchers, program staff, other community members, and so on.
Then we put all data in single framework & apply various statistical tools to find out the dynamic on the market.
During the analysis stage, feedback from the stakeholder groups would be compared to determine areas of agreement as well as areas of divergence