

Key Insights
The global electronic watch market is poised for substantial expansion, driven by increasing consumer adoption of smartwatches and fitness trackers. The market is projected to reach $77.48 billion by 2024, with a Compound Annual Growth Rate (CAGR) of 5.06% from the base year 2024. Key growth catalysts include the rising prevalence of wearable technology, enhanced health and fitness tracking capabilities, growing disposable incomes, and a preference for sophisticated timepieces. Market segmentation highlights smartwatches and sports watches as leading product categories, with online retail channels demonstrating rapid growth. The market serves Men, Women, and Unisex segments, with the mass market segment holding significant volume, complemented by a rising demand for luxury electronic watches. North America and Asia Pacific are key geographical markets, fueled by high adoption rates in the United States, China, and Japan. However, market growth is moderated by the initial cost of premium smartwatches and the rapid pace of technological evolution leading to shorter product lifecycles. The competitive environment is intense, featuring established brands such as Apple, Samsung, Fitbit, and Garmin, alongside emerging players, fostering continuous innovation and price competition.
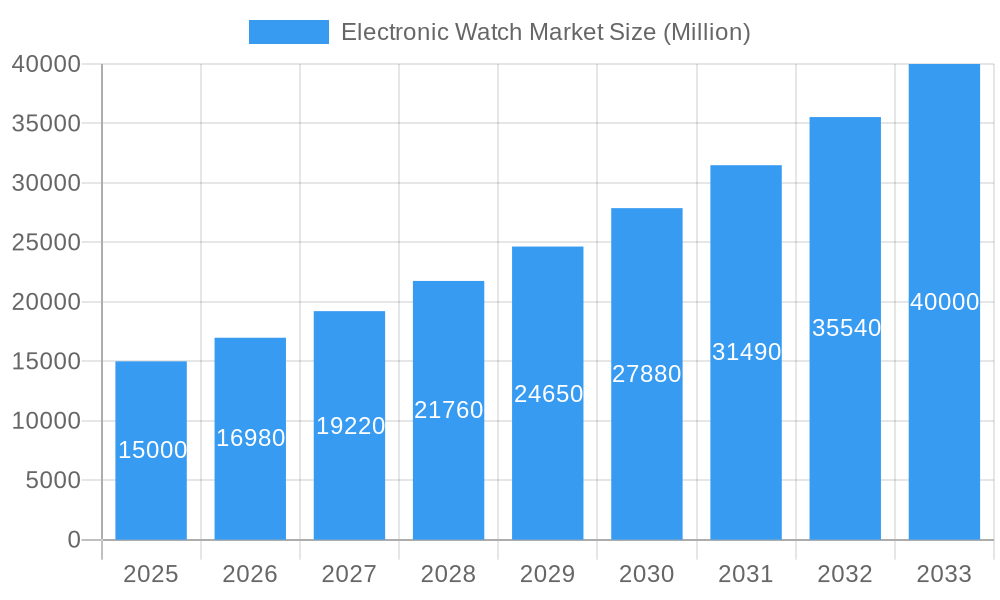
Electronic Watch Market Market Size (In Billion)
Sustained growth in the electronic watch sector relies on ongoing innovation in battery life, advanced health monitoring features (including sleep tracking, ECG, and blood oxygen monitoring), and seamless smartphone integration. Brands must prioritize personalized user experiences and diversified product offerings across various lifestyles and price points. Expansion into emerging markets, strategic collaborations, and marketing campaigns emphasizing health and wellness benefits will be crucial for continued expansion. The burgeoning popularity of hybrid smartwatches, which blend traditional watch aesthetics with smart functionality, is expected to drive further market development. Addressing consumer concerns regarding data privacy and security is paramount for maintaining market trust. The electronic watch market presents significant opportunities for established and new entrants alike.
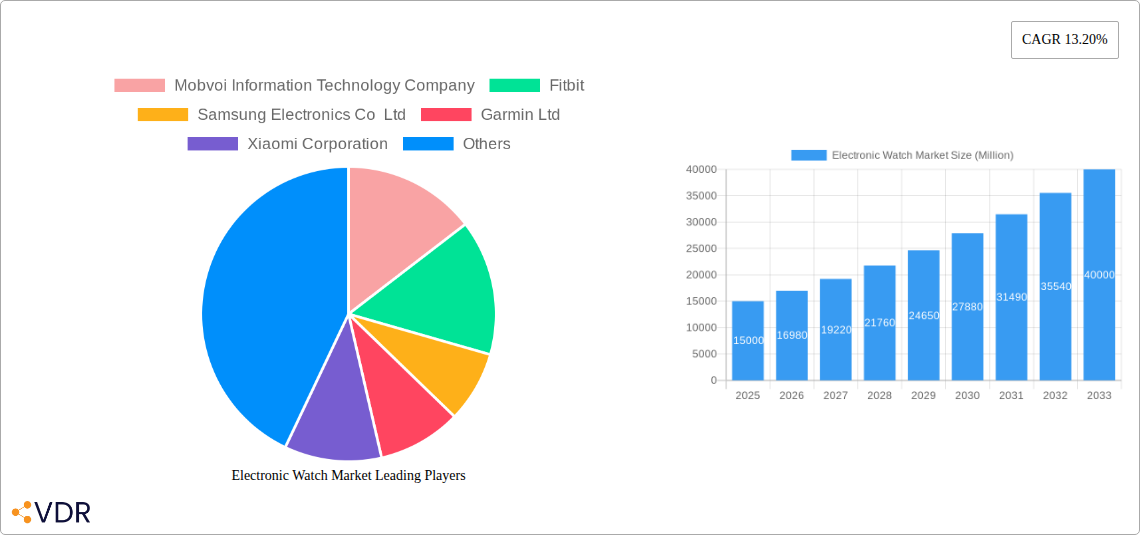
Electronic Watch Market Company Market Share
Electronic Watch Market: A Comprehensive Market Report (2019-2033)
This in-depth report provides a comprehensive analysis of the global electronic watch market, encompassing market dynamics, growth trends, regional analysis, product landscape, key players, and future outlook. The study period covers 2019-2033, with 2025 as the base year and forecast period spanning 2025-2033. This report is invaluable for industry professionals, investors, and strategic decision-makers seeking to understand and capitalize on opportunities within this dynamic market. The parent market is the wearable technology market, while the child market is specifically electronic watches. The market size is projected to reach xx million units by 2033.
Electronic Watch Market Dynamics & Structure
The electronic watch market is characterized by intense competition, rapid technological advancements, and evolving consumer preferences. Market concentration is moderate, with a few key players holding significant market share, but a large number of smaller players also contributing. Technological innovation, particularly in areas like health tracking, smart features, and design, is a key driver of growth. Regulatory frameworks concerning data privacy and safety standards impact market dynamics. Competitive substitutes include fitness trackers and smartphones, posing challenges to market growth. End-user demographics are shifting, with increasing adoption across various age groups and genders. M&A activity in the sector remains relatively active, with xx deals recorded in the last five years, contributing to market consolidation.
- Market Concentration: Moderate, with top 5 players holding approximately xx% market share in 2024.
- Technological Innovation: Focus on improved battery life, enhanced health monitoring capabilities, and integration with smartphones.
- Regulatory Frameworks: Compliance with data privacy regulations and safety standards crucial for market players.
- Competitive Substitutes: Fitness trackers and smartphones are competing for consumer attention and market share.
- End-User Demographics: Increasing adoption across all demographics, with specific growth in the young adult segment.
- M&A Trends: Consolidation through acquisitions and mergers, resulting in increased market share for major players.
Electronic Watch Market Growth Trends & Insights
The global electronic watch market has witnessed robust growth over the historical period (2019-2024), driven by increasing demand for smartwatches and fitness trackers. The market size reached xx million units in 2024, exhibiting a CAGR of xx% during this period. Adoption rates are particularly high in developed economies, with increasing penetration in emerging markets. Technological disruptions, such as the introduction of advanced sensors and improved connectivity, have fueled market expansion. Consumer behavior shifts towards health and wellness consciousness and increased usage of wearable devices further contribute to market growth. The forecast period (2025-2033) is expected to witness sustained growth, with a projected CAGR of xx%, driven by continuous innovation and expanding consumer base. Market penetration is anticipated to increase significantly in emerging economies. Specific adoption rate increases in various segments further support this trend.
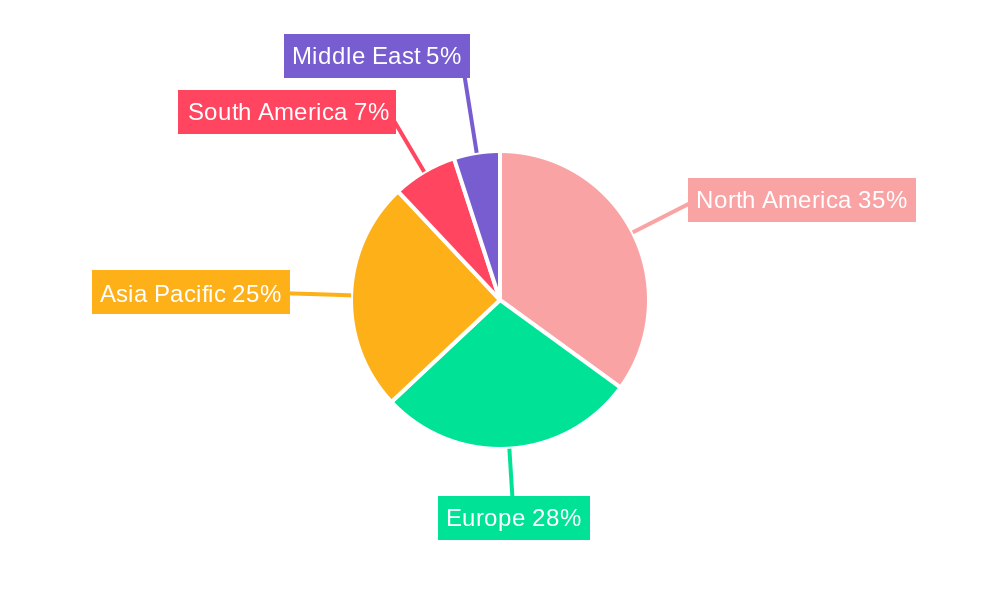
Dominant Regions, Countries, or Segments in Electronic Watch Market
North America and Asia-Pacific currently dominate the electronic watch market, accounting for approximately xx% and xx% of global sales, respectively. Within product types, smartwatches are the fastest-growing segment, driven by features like health monitoring, notifications, and mobile payments. The men's segment holds the largest market share by end user, followed by unisex and women’s categories. In terms of categories, the mass market segment significantly outweighs luxury, although the luxury segment demonstrates higher average revenue. Online retail stores are gaining traction as a major distribution channel, supplementing the traditional offline retail stores market.
- Key Drivers for North America: High disposable incomes, early adoption of technology, and established distribution networks.
- Key Drivers for Asia-Pacific: Rapid urbanization, increasing smartphone penetration, and a burgeoning middle class.
- Smartwatch Dominance: Driven by advanced features, seamless connectivity, and increasing consumer demand for smart technology.
- Men's Segment Leadership: Larger market share due to higher purchase frequency, influenced by lifestyle factors.
- Online Retail Growth: Convenience, competitive pricing, and wider product selection propel online sales.
Electronic Watch Market Product Landscape
The electronic watch market offers a diverse range of products, from basic analog watches to sophisticated smartwatches with advanced features. Innovations focus on improved battery life, enhanced health tracking capabilities (heart rate monitoring, sleep tracking, blood oxygen level monitoring), better water resistance, and seamless integration with smartphones and other smart devices. Unique selling propositions often involve specific features (e.g., built-in GPS, contactless payments, advanced fitness metrics), aesthetically pleasing designs, durable materials, and robust mobile applications. Technological advancements encompass miniaturization of components, improved sensor technology, and the incorporation of artificial intelligence capabilities.
Key Drivers, Barriers & Challenges in Electronic Watch Market
Key Drivers:
- Growing demand for wearable fitness and health tracking devices.
- Technological advancements leading to more sophisticated features and better user experience.
- Increasing smartphone penetration and their seamless integration with smartwatches.
- Rising disposable incomes in emerging economies, fueling demand for electronic watches.
Key Challenges:
- Intense competition among major players leading to price wars and margin pressures. The impact is estimated to be a reduction in average profit margins by xx% over the next five years.
- Supply chain disruptions can lead to production delays and increased component costs.
- Stringent regulatory requirements concerning data privacy and safety standards increase compliance costs.
Emerging Opportunities in Electronic Watch Market
- Expansion into untapped markets, particularly in developing countries with rising middle class.
- Development of niche products catering to specific end-user needs, e.g., specialized sports watches, children's smartwatches, and senior-friendly models.
- Integration of new technologies, like augmented reality and virtual reality, creating immersive user experiences.
- Focus on sustainable materials and eco-friendly manufacturing processes.
Growth Accelerators in the Electronic Watch Market Industry
The long-term growth of the electronic watch market will be propelled by continuous innovation in sensor technology, advancements in battery technology allowing longer battery life, and strategic partnerships between technology companies and fashion brands, enhancing product design and brand appeal. Market expansion into new geographical regions, particularly those with high smartphone penetration and increasing disposable incomes, represents another growth catalyst.
Key Players Shaping the Electronic Watch Market Market
Notable Milestones in Electronic Watch Market Sector
- June 2021: Huawei Consumer Business Group launched the Huawei Watch 3 Series, featuring HarmonyOS 2.
- October 2021: Apple launched Apple Watch Series 7, with a larger, advanced display.
- April 2022: Gizmore launched its first 'Made in India' smartwatch.
In-Depth Electronic Watch Market Market Outlook
The electronic watch market is poised for sustained growth, driven by the factors detailed above. The continued miniaturization of components, advancements in health monitoring technologies, and the growing demand for smart and connected devices provide significant opportunities for market expansion. Strategic partnerships, focused product innovation, and targeted marketing strategies will be key to success for companies operating within this competitive landscape. The market shows immense potential for growth across diverse segments and regions.
Electronic Watch Market Segmentation
-
1. Product type
- 1.1. Smart Watch
- 1.2. Sports Watch
-
2. End user
- 2.1. Men
- 2.2. Women
- 2.3. Unisex
-
3. Category
- 3.1. Mass
- 3.2. Luxury
-
4. Distribution Channel
- 4.1. Offline Retail Stores
- 4.2. Online Retail Stores
Electronic Watch Market Segmentation By Geography
-
1. North America
- 1.1. United States
- 1.2. Canada
- 1.3. Mexico
- 1.4. Rest of North America
-
2. Europe
- 2.1. United Kingdom
- 2.2. Germany
- 2.3. Spain
- 2.4. France
- 2.5. Italy
- 2.6. Russia
- 2.7. Rest of Europe
-
3. Asia Pacific
- 3.1. China
- 3.2. Japan
- 3.3. India
- 3.4. Australia
- 3.5. Rest of Asia Pacific
-
4. South America
- 4.1. Brazil
- 4.2. Argentina
- 4.3. Rest of South America
- 5. Middle East
-
6. United Arab Emirates
- 6.1. South Africa
- 6.2. Rest of Middle East
Electronic Watch Market Regional Market Share
Geographic Coverage of Electronic Watch Market
Electronic Watch Market REPORT HIGHLIGHTS
| Aspects | Details |
|---|---|
| Study Period | 2020-2034 |
| Base Year | 2025 |
| Estimated Year | 2026 |
| Forecast Period | 2026-2034 |
| Historical Period | 2020-2025 |
| Growth Rate | CAGR of 5.06% from 2020-2034 |
| Segmentation |
|
Table of Contents
- 1. Introduction
- 1.1. Research Scope
- 1.2. Market Segmentation
- 1.3. Research Objective
- 1.4. Definitions and Assumptions
- 2. Executive Summary
- 2.1. Market Snapshot
- 3. Market Dynamics
- 3.1. Market Drivers
- 3.2. Market Restrains
- 3.3. Market Trends
- 3.4. Market Opportunities
- 4. Market Factor Analysis
- 4.1. Porters Five Forces
- 4.1.1. Bargaining Power of Suppliers
- 4.1.2. Bargaining Power of Buyers
- 4.1.3. Threat of New Entrants
- 4.1.4. Threat of Substitutes
- 4.1.5. Competitive Rivalry
- 4.2. PESTEL analysis
- 4.3. BCG Analysis
- 4.3.1. Stars (High Growth, High Market Share)
- 4.3.2. Cash Cows (Low Growth, High Market Share)
- 4.3.3. Question Mark (High Growth, Low Market Share)
- 4.3.4. Dogs (Low Growth, Low Market Share)
- 4.4. Ansoff Matrix Analysis
- 4.5. Supply Chain Analysis
- 4.6. Regulatory Landscape
- 4.7. Current Market Potential and Opportunity Assessment (TAM–SAM–SOM Framework)
- 4.8. VDR Analyst Note
- 4.1. Porters Five Forces
- 5. Market Analysis, Insights and Forecast 2021-2033
- 5.1. Market Analysis, Insights and Forecast - by Product type
- 5.1.1. Smart Watch
- 5.1.2. Sports Watch
- 5.2. Market Analysis, Insights and Forecast - by End user
- 5.2.1. Men
- 5.2.2. Women
- 5.2.3. Unisex
- 5.3. Market Analysis, Insights and Forecast - by Category
- 5.3.1. Mass
- 5.3.2. Luxury
- 5.4. Market Analysis, Insights and Forecast - by Distribution Channel
- 5.4.1. Offline Retail Stores
- 5.4.2. Online Retail Stores
- 5.5. Market Analysis, Insights and Forecast - by Region
- 5.5.1. North America
- 5.5.2. Europe
- 5.5.3. Asia Pacific
- 5.5.4. South America
- 5.5.5. Middle East
- 5.5.6. United Arab Emirates
- 5.1. Market Analysis, Insights and Forecast - by Product type
- 6. Global Electronic Watch Market Analysis, Insights and Forecast, 2021-2033
- 6.1. Market Analysis, Insights and Forecast - by Product type
- 6.1.1. Smart Watch
- 6.1.2. Sports Watch
- 6.2. Market Analysis, Insights and Forecast - by End user
- 6.2.1. Men
- 6.2.2. Women
- 6.2.3. Unisex
- 6.3. Market Analysis, Insights and Forecast - by Category
- 6.3.1. Mass
- 6.3.2. Luxury
- 6.4. Market Analysis, Insights and Forecast - by Distribution Channel
- 6.4.1. Offline Retail Stores
- 6.4.2. Online Retail Stores
- 6.1. Market Analysis, Insights and Forecast - by Product type
- 7. North America Electronic Watch Market Analysis, Insights and Forecast, 2021-2033
- 7.1. Market Analysis, Insights and Forecast - by Product type
- 7.1.1. Smart Watch
- 7.1.2. Sports Watch
- 7.2. Market Analysis, Insights and Forecast - by End user
- 7.2.1. Men
- 7.2.2. Women
- 7.2.3. Unisex
- 7.3. Market Analysis, Insights and Forecast - by Category
- 7.3.1. Mass
- 7.3.2. Luxury
- 7.4. Market Analysis, Insights and Forecast - by Distribution Channel
- 7.4.1. Offline Retail Stores
- 7.4.2. Online Retail Stores
- 7.1. Market Analysis, Insights and Forecast - by Product type
- 8. Europe Electronic Watch Market Analysis, Insights and Forecast, 2021-2033
- 8.1. Market Analysis, Insights and Forecast - by Product type
- 8.1.1. Smart Watch
- 8.1.2. Sports Watch
- 8.2. Market Analysis, Insights and Forecast - by End user
- 8.2.1. Men
- 8.2.2. Women
- 8.2.3. Unisex
- 8.3. Market Analysis, Insights and Forecast - by Category
- 8.3.1. Mass
- 8.3.2. Luxury
- 8.4. Market Analysis, Insights and Forecast - by Distribution Channel
- 8.4.1. Offline Retail Stores
- 8.4.2. Online Retail Stores
- 8.1. Market Analysis, Insights and Forecast - by Product type
- 9. Asia Pacific Electronic Watch Market Analysis, Insights and Forecast, 2021-2033
- 9.1. Market Analysis, Insights and Forecast - by Product type
- 9.1.1. Smart Watch
- 9.1.2. Sports Watch
- 9.2. Market Analysis, Insights and Forecast - by End user
- 9.2.1. Men
- 9.2.2. Women
- 9.2.3. Unisex
- 9.3. Market Analysis, Insights and Forecast - by Category
- 9.3.1. Mass
- 9.3.2. Luxury
- 9.4. Market Analysis, Insights and Forecast - by Distribution Channel
- 9.4.1. Offline Retail Stores
- 9.4.2. Online Retail Stores
- 9.1. Market Analysis, Insights and Forecast - by Product type
- 10. South America Electronic Watch Market Analysis, Insights and Forecast, 2021-2033
- 10.1. Market Analysis, Insights and Forecast - by Product type
- 10.1.1. Smart Watch
- 10.1.2. Sports Watch
- 10.2. Market Analysis, Insights and Forecast - by End user
- 10.2.1. Men
- 10.2.2. Women
- 10.2.3. Unisex
- 10.3. Market Analysis, Insights and Forecast - by Category
- 10.3.1. Mass
- 10.3.2. Luxury
- 10.4. Market Analysis, Insights and Forecast - by Distribution Channel
- 10.4.1. Offline Retail Stores
- 10.4.2. Online Retail Stores
- 10.1. Market Analysis, Insights and Forecast - by Product type
- 11. Middle East Electronic Watch Market Analysis, Insights and Forecast, 2021-2033
- 11.1. Market Analysis, Insights and Forecast - by Product type
- 11.1.1. Smart Watch
- 11.1.2. Sports Watch
- 11.2. Market Analysis, Insights and Forecast - by End user
- 11.2.1. Men
- 11.2.2. Women
- 11.2.3. Unisex
- 11.3. Market Analysis, Insights and Forecast - by Category
- 11.3.1. Mass
- 11.3.2. Luxury
- 11.4. Market Analysis, Insights and Forecast - by Distribution Channel
- 11.4.1. Offline Retail Stores
- 11.4.2. Online Retail Stores
- 11.1. Market Analysis, Insights and Forecast - by Product type
- 12. United Arab Emirates Electronic Watch Market Analysis, Insights and Forecast, 2021-2033
- 12.1. Market Analysis, Insights and Forecast - by Product type
- 12.1.1. Smart Watch
- 12.1.2. Sports Watch
- 12.2. Market Analysis, Insights and Forecast - by End user
- 12.2.1. Men
- 12.2.2. Women
- 12.2.3. Unisex
- 12.3. Market Analysis, Insights and Forecast - by Category
- 12.3.1. Mass
- 12.3.2. Luxury
- 12.4. Market Analysis, Insights and Forecast - by Distribution Channel
- 12.4.1. Offline Retail Stores
- 12.4.2. Online Retail Stores
- 12.1. Market Analysis, Insights and Forecast - by Product type
- 13. Competitive Analysis
- 13.1. Company Profiles
- 13.1.1 Mobvoi Information Technology Company
- 13.1.1.1. Company Overview
- 13.1.1.2. Products
- 13.1.1.3. Company Financials
- 13.1.1.4. SWOT Analysis
- 13.1.2 Fitbit
- 13.1.2.1. Company Overview
- 13.1.2.2. Products
- 13.1.2.3. Company Financials
- 13.1.2.4. SWOT Analysis
- 13.1.3 Samsung Electronics Co Ltd
- 13.1.3.1. Company Overview
- 13.1.3.2. Products
- 13.1.3.3. Company Financials
- 13.1.3.4. SWOT Analysis
- 13.1.4 Garmin Ltd
- 13.1.4.1. Company Overview
- 13.1.4.2. Products
- 13.1.4.3. Company Financials
- 13.1.4.4. SWOT Analysis
- 13.1.5 Xiaomi Corporation
- 13.1.5.1. Company Overview
- 13.1.5.2. Products
- 13.1.5.3. Company Financials
- 13.1.5.4. SWOT Analysis
- 13.1.6 TAG Heuer S A*List Not Exhaustive
- 13.1.6.1. Company Overview
- 13.1.6.2. Products
- 13.1.6.3. Company Financials
- 13.1.6.4. SWOT Analysis
- 13.1.7 Zepp Health
- 13.1.7.1. Company Overview
- 13.1.7.2. Products
- 13.1.7.3. Company Financials
- 13.1.7.4. SWOT Analysis
- 13.1.8 Fossil Group Inc
- 13.1.8.1. Company Overview
- 13.1.8.2. Products
- 13.1.8.3. Company Financials
- 13.1.8.4. SWOT Analysis
- 13.1.9 Apple Inc
- 13.1.9.1. Company Overview
- 13.1.9.2. Products
- 13.1.9.3. Company Financials
- 13.1.9.4. SWOT Analysis
- 13.1.10 Huawei Device Co Ltd
- 13.1.10.1. Company Overview
- 13.1.10.2. Products
- 13.1.10.3. Company Financials
- 13.1.10.4. SWOT Analysis
- 13.1.1 Mobvoi Information Technology Company
- 13.2. Market Entropy
- 13.2.1 Company's Key Areas Served
- 13.2.2 Recent Developments
- 13.3. Company Market Share Analysis 2025
- 13.3.1 Top 5 Companies Market Share Analysis
- 13.3.2 Top 3 Companies Market Share Analysis
- 13.4. List of Potential Customers
- 14. Research Methodology
List of Figures
- Figure 1: Global Electronic Watch Market Revenue Breakdown (billion, %) by Region 2025 & 2033
- Figure 2: Global Electronic Watch Market Volume Breakdown (K Units , %) by Region 2025 & 2033
- Figure 3: North America Electronic Watch Market Revenue (billion), by Product type 2025 & 2033
- Figure 4: North America Electronic Watch Market Volume (K Units ), by Product type 2025 & 2033
- Figure 5: North America Electronic Watch Market Revenue Share (%), by Product type 2025 & 2033
- Figure 6: North America Electronic Watch Market Volume Share (%), by Product type 2025 & 2033
- Figure 7: North America Electronic Watch Market Revenue (billion), by End user 2025 & 2033
- Figure 8: North America Electronic Watch Market Volume (K Units ), by End user 2025 & 2033
- Figure 9: North America Electronic Watch Market Revenue Share (%), by End user 2025 & 2033
- Figure 10: North America Electronic Watch Market Volume Share (%), by End user 2025 & 2033
- Figure 11: North America Electronic Watch Market Revenue (billion), by Category 2025 & 2033
- Figure 12: North America Electronic Watch Market Volume (K Units ), by Category 2025 & 2033
- Figure 13: North America Electronic Watch Market Revenue Share (%), by Category 2025 & 2033
- Figure 14: North America Electronic Watch Market Volume Share (%), by Category 2025 & 2033
- Figure 15: North America Electronic Watch Market Revenue (billion), by Distribution Channel 2025 & 2033
- Figure 16: North America Electronic Watch Market Volume (K Units ), by Distribution Channel 2025 & 2033
- Figure 17: North America Electronic Watch Market Revenue Share (%), by Distribution Channel 2025 & 2033
- Figure 18: North America Electronic Watch Market Volume Share (%), by Distribution Channel 2025 & 2033
- Figure 19: North America Electronic Watch Market Revenue (billion), by Country 2025 & 2033
- Figure 20: North America Electronic Watch Market Volume (K Units ), by Country 2025 & 2033
- Figure 21: North America Electronic Watch Market Revenue Share (%), by Country 2025 & 2033
- Figure 22: North America Electronic Watch Market Volume Share (%), by Country 2025 & 2033
- Figure 23: Europe Electronic Watch Market Revenue (billion), by Product type 2025 & 2033
- Figure 24: Europe Electronic Watch Market Volume (K Units ), by Product type 2025 & 2033
- Figure 25: Europe Electronic Watch Market Revenue Share (%), by Product type 2025 & 2033
- Figure 26: Europe Electronic Watch Market Volume Share (%), by Product type 2025 & 2033
- Figure 27: Europe Electronic Watch Market Revenue (billion), by End user 2025 & 2033
- Figure 28: Europe Electronic Watch Market Volume (K Units ), by End user 2025 & 2033
- Figure 29: Europe Electronic Watch Market Revenue Share (%), by End user 2025 & 2033
- Figure 30: Europe Electronic Watch Market Volume Share (%), by End user 2025 & 2033
- Figure 31: Europe Electronic Watch Market Revenue (billion), by Category 2025 & 2033
- Figure 32: Europe Electronic Watch Market Volume (K Units ), by Category 2025 & 2033
- Figure 33: Europe Electronic Watch Market Revenue Share (%), by Category 2025 & 2033
- Figure 34: Europe Electronic Watch Market Volume Share (%), by Category 2025 & 2033
- Figure 35: Europe Electronic Watch Market Revenue (billion), by Distribution Channel 2025 & 2033
- Figure 36: Europe Electronic Watch Market Volume (K Units ), by Distribution Channel 2025 & 2033
- Figure 37: Europe Electronic Watch Market Revenue Share (%), by Distribution Channel 2025 & 2033
- Figure 38: Europe Electronic Watch Market Volume Share (%), by Distribution Channel 2025 & 2033
- Figure 39: Europe Electronic Watch Market Revenue (billion), by Country 2025 & 2033
- Figure 40: Europe Electronic Watch Market Volume (K Units ), by Country 2025 & 2033
- Figure 41: Europe Electronic Watch Market Revenue Share (%), by Country 2025 & 2033
- Figure 42: Europe Electronic Watch Market Volume Share (%), by Country 2025 & 2033
- Figure 43: Asia Pacific Electronic Watch Market Revenue (billion), by Product type 2025 & 2033
- Figure 44: Asia Pacific Electronic Watch Market Volume (K Units ), by Product type 2025 & 2033
- Figure 45: Asia Pacific Electronic Watch Market Revenue Share (%), by Product type 2025 & 2033
- Figure 46: Asia Pacific Electronic Watch Market Volume Share (%), by Product type 2025 & 2033
- Figure 47: Asia Pacific Electronic Watch Market Revenue (billion), by End user 2025 & 2033
- Figure 48: Asia Pacific Electronic Watch Market Volume (K Units ), by End user 2025 & 2033
- Figure 49: Asia Pacific Electronic Watch Market Revenue Share (%), by End user 2025 & 2033
- Figure 50: Asia Pacific Electronic Watch Market Volume Share (%), by End user 2025 & 2033
- Figure 51: Asia Pacific Electronic Watch Market Revenue (billion), by Category 2025 & 2033
- Figure 52: Asia Pacific Electronic Watch Market Volume (K Units ), by Category 2025 & 2033
- Figure 53: Asia Pacific Electronic Watch Market Revenue Share (%), by Category 2025 & 2033
- Figure 54: Asia Pacific Electronic Watch Market Volume Share (%), by Category 2025 & 2033
- Figure 55: Asia Pacific Electronic Watch Market Revenue (billion), by Distribution Channel 2025 & 2033
- Figure 56: Asia Pacific Electronic Watch Market Volume (K Units ), by Distribution Channel 2025 & 2033
- Figure 57: Asia Pacific Electronic Watch Market Revenue Share (%), by Distribution Channel 2025 & 2033
- Figure 58: Asia Pacific Electronic Watch Market Volume Share (%), by Distribution Channel 2025 & 2033
- Figure 59: Asia Pacific Electronic Watch Market Revenue (billion), by Country 2025 & 2033
- Figure 60: Asia Pacific Electronic Watch Market Volume (K Units ), by Country 2025 & 2033
- Figure 61: Asia Pacific Electronic Watch Market Revenue Share (%), by Country 2025 & 2033
- Figure 62: Asia Pacific Electronic Watch Market Volume Share (%), by Country 2025 & 2033
- Figure 63: South America Electronic Watch Market Revenue (billion), by Product type 2025 & 2033
- Figure 64: South America Electronic Watch Market Volume (K Units ), by Product type 2025 & 2033
- Figure 65: South America Electronic Watch Market Revenue Share (%), by Product type 2025 & 2033
- Figure 66: South America Electronic Watch Market Volume Share (%), by Product type 2025 & 2033
- Figure 67: South America Electronic Watch Market Revenue (billion), by End user 2025 & 2033
- Figure 68: South America Electronic Watch Market Volume (K Units ), by End user 2025 & 2033
- Figure 69: South America Electronic Watch Market Revenue Share (%), by End user 2025 & 2033
- Figure 70: South America Electronic Watch Market Volume Share (%), by End user 2025 & 2033
- Figure 71: South America Electronic Watch Market Revenue (billion), by Category 2025 & 2033
- Figure 72: South America Electronic Watch Market Volume (K Units ), by Category 2025 & 2033
- Figure 73: South America Electronic Watch Market Revenue Share (%), by Category 2025 & 2033
- Figure 74: South America Electronic Watch Market Volume Share (%), by Category 2025 & 2033
- Figure 75: South America Electronic Watch Market Revenue (billion), by Distribution Channel 2025 & 2033
- Figure 76: South America Electronic Watch Market Volume (K Units ), by Distribution Channel 2025 & 2033
- Figure 77: South America Electronic Watch Market Revenue Share (%), by Distribution Channel 2025 & 2033
- Figure 78: South America Electronic Watch Market Volume Share (%), by Distribution Channel 2025 & 2033
- Figure 79: South America Electronic Watch Market Revenue (billion), by Country 2025 & 2033
- Figure 80: South America Electronic Watch Market Volume (K Units ), by Country 2025 & 2033
- Figure 81: South America Electronic Watch Market Revenue Share (%), by Country 2025 & 2033
- Figure 82: South America Electronic Watch Market Volume Share (%), by Country 2025 & 2033
- Figure 83: Middle East Electronic Watch Market Revenue (billion), by Product type 2025 & 2033
- Figure 84: Middle East Electronic Watch Market Volume (K Units ), by Product type 2025 & 2033
- Figure 85: Middle East Electronic Watch Market Revenue Share (%), by Product type 2025 & 2033
- Figure 86: Middle East Electronic Watch Market Volume Share (%), by Product type 2025 & 2033
- Figure 87: Middle East Electronic Watch Market Revenue (billion), by End user 2025 & 2033
- Figure 88: Middle East Electronic Watch Market Volume (K Units ), by End user 2025 & 2033
- Figure 89: Middle East Electronic Watch Market Revenue Share (%), by End user 2025 & 2033
- Figure 90: Middle East Electronic Watch Market Volume Share (%), by End user 2025 & 2033
- Figure 91: Middle East Electronic Watch Market Revenue (billion), by Category 2025 & 2033
- Figure 92: Middle East Electronic Watch Market Volume (K Units ), by Category 2025 & 2033
- Figure 93: Middle East Electronic Watch Market Revenue Share (%), by Category 2025 & 2033
- Figure 94: Middle East Electronic Watch Market Volume Share (%), by Category 2025 & 2033
- Figure 95: Middle East Electronic Watch Market Revenue (billion), by Distribution Channel 2025 & 2033
- Figure 96: Middle East Electronic Watch Market Volume (K Units ), by Distribution Channel 2025 & 2033
- Figure 97: Middle East Electronic Watch Market Revenue Share (%), by Distribution Channel 2025 & 2033
- Figure 98: Middle East Electronic Watch Market Volume Share (%), by Distribution Channel 2025 & 2033
- Figure 99: Middle East Electronic Watch Market Revenue (billion), by Country 2025 & 2033
- Figure 100: Middle East Electronic Watch Market Volume (K Units ), by Country 2025 & 2033
- Figure 101: Middle East Electronic Watch Market Revenue Share (%), by Country 2025 & 2033
- Figure 102: Middle East Electronic Watch Market Volume Share (%), by Country 2025 & 2033
- Figure 103: United Arab Emirates Electronic Watch Market Revenue (billion), by Product type 2025 & 2033
- Figure 104: United Arab Emirates Electronic Watch Market Volume (K Units ), by Product type 2025 & 2033
- Figure 105: United Arab Emirates Electronic Watch Market Revenue Share (%), by Product type 2025 & 2033
- Figure 106: United Arab Emirates Electronic Watch Market Volume Share (%), by Product type 2025 & 2033
- Figure 107: United Arab Emirates Electronic Watch Market Revenue (billion), by End user 2025 & 2033
- Figure 108: United Arab Emirates Electronic Watch Market Volume (K Units ), by End user 2025 & 2033
- Figure 109: United Arab Emirates Electronic Watch Market Revenue Share (%), by End user 2025 & 2033
- Figure 110: United Arab Emirates Electronic Watch Market Volume Share (%), by End user 2025 & 2033
- Figure 111: United Arab Emirates Electronic Watch Market Revenue (billion), by Category 2025 & 2033
- Figure 112: United Arab Emirates Electronic Watch Market Volume (K Units ), by Category 2025 & 2033
- Figure 113: United Arab Emirates Electronic Watch Market Revenue Share (%), by Category 2025 & 2033
- Figure 114: United Arab Emirates Electronic Watch Market Volume Share (%), by Category 2025 & 2033
- Figure 115: United Arab Emirates Electronic Watch Market Revenue (billion), by Distribution Channel 2025 & 2033
- Figure 116: United Arab Emirates Electronic Watch Market Volume (K Units ), by Distribution Channel 2025 & 2033
- Figure 117: United Arab Emirates Electronic Watch Market Revenue Share (%), by Distribution Channel 2025 & 2033
- Figure 118: United Arab Emirates Electronic Watch Market Volume Share (%), by Distribution Channel 2025 & 2033
- Figure 119: United Arab Emirates Electronic Watch Market Revenue (billion), by Country 2025 & 2033
- Figure 120: United Arab Emirates Electronic Watch Market Volume (K Units ), by Country 2025 & 2033
- Figure 121: United Arab Emirates Electronic Watch Market Revenue Share (%), by Country 2025 & 2033
- Figure 122: United Arab Emirates Electronic Watch Market Volume Share (%), by Country 2025 & 2033
List of Tables
- Table 1: Global Electronic Watch Market Revenue billion Forecast, by Product type 2020 & 2033
- Table 2: Global Electronic Watch Market Volume K Units Forecast, by Product type 2020 & 2033
- Table 3: Global Electronic Watch Market Revenue billion Forecast, by End user 2020 & 2033
- Table 4: Global Electronic Watch Market Volume K Units Forecast, by End user 2020 & 2033
- Table 5: Global Electronic Watch Market Revenue billion Forecast, by Category 2020 & 2033
- Table 6: Global Electronic Watch Market Volume K Units Forecast, by Category 2020 & 2033
- Table 7: Global Electronic Watch Market Revenue billion Forecast, by Distribution Channel 2020 & 2033
- Table 8: Global Electronic Watch Market Volume K Units Forecast, by Distribution Channel 2020 & 2033
- Table 9: Global Electronic Watch Market Revenue billion Forecast, by Region 2020 & 2033
- Table 10: Global Electronic Watch Market Volume K Units Forecast, by Region 2020 & 2033
- Table 11: Global Electronic Watch Market Revenue billion Forecast, by Product type 2020 & 2033
- Table 12: Global Electronic Watch Market Volume K Units Forecast, by Product type 2020 & 2033
- Table 13: Global Electronic Watch Market Revenue billion Forecast, by End user 2020 & 2033
- Table 14: Global Electronic Watch Market Volume K Units Forecast, by End user 2020 & 2033
- Table 15: Global Electronic Watch Market Revenue billion Forecast, by Category 2020 & 2033
- Table 16: Global Electronic Watch Market Volume K Units Forecast, by Category 2020 & 2033
- Table 17: Global Electronic Watch Market Revenue billion Forecast, by Distribution Channel 2020 & 2033
- Table 18: Global Electronic Watch Market Volume K Units Forecast, by Distribution Channel 2020 & 2033
- Table 19: Global Electronic Watch Market Revenue billion Forecast, by Country 2020 & 2033
- Table 20: Global Electronic Watch Market Volume K Units Forecast, by Country 2020 & 2033
- Table 21: United States Electronic Watch Market Revenue (billion) Forecast, by Application 2020 & 2033
- Table 22: United States Electronic Watch Market Volume (K Units ) Forecast, by Application 2020 & 2033
- Table 23: Canada Electronic Watch Market Revenue (billion) Forecast, by Application 2020 & 2033
- Table 24: Canada Electronic Watch Market Volume (K Units ) Forecast, by Application 2020 & 2033
- Table 25: Mexico Electronic Watch Market Revenue (billion) Forecast, by Application 2020 & 2033
- Table 26: Mexico Electronic Watch Market Volume (K Units ) Forecast, by Application 2020 & 2033
- Table 27: Rest of North America Electronic Watch Market Revenue (billion) Forecast, by Application 2020 & 2033
- Table 28: Rest of North America Electronic Watch Market Volume (K Units ) Forecast, by Application 2020 & 2033
- Table 29: Global Electronic Watch Market Revenue billion Forecast, by Product type 2020 & 2033
- Table 30: Global Electronic Watch Market Volume K Units Forecast, by Product type 2020 & 2033
- Table 31: Global Electronic Watch Market Revenue billion Forecast, by End user 2020 & 2033
- Table 32: Global Electronic Watch Market Volume K Units Forecast, by End user 2020 & 2033
- Table 33: Global Electronic Watch Market Revenue billion Forecast, by Category 2020 & 2033
- Table 34: Global Electronic Watch Market Volume K Units Forecast, by Category 2020 & 2033
- Table 35: Global Electronic Watch Market Revenue billion Forecast, by Distribution Channel 2020 & 2033
- Table 36: Global Electronic Watch Market Volume K Units Forecast, by Distribution Channel 2020 & 2033
- Table 37: Global Electronic Watch Market Revenue billion Forecast, by Country 2020 & 2033
- Table 38: Global Electronic Watch Market Volume K Units Forecast, by Country 2020 & 2033
- Table 39: United Kingdom Electronic Watch Market Revenue (billion) Forecast, by Application 2020 & 2033
- Table 40: United Kingdom Electronic Watch Market Volume (K Units ) Forecast, by Application 2020 & 2033
- Table 41: Germany Electronic Watch Market Revenue (billion) Forecast, by Application 2020 & 2033
- Table 42: Germany Electronic Watch Market Volume (K Units ) Forecast, by Application 2020 & 2033
- Table 43: Spain Electronic Watch Market Revenue (billion) Forecast, by Application 2020 & 2033
- Table 44: Spain Electronic Watch Market Volume (K Units ) Forecast, by Application 2020 & 2033
- Table 45: France Electronic Watch Market Revenue (billion) Forecast, by Application 2020 & 2033
- Table 46: France Electronic Watch Market Volume (K Units ) Forecast, by Application 2020 & 2033
- Table 47: Italy Electronic Watch Market Revenue (billion) Forecast, by Application 2020 & 2033
- Table 48: Italy Electronic Watch Market Volume (K Units ) Forecast, by Application 2020 & 2033
- Table 49: Russia Electronic Watch Market Revenue (billion) Forecast, by Application 2020 & 2033
- Table 50: Russia Electronic Watch Market Volume (K Units ) Forecast, by Application 2020 & 2033
- Table 51: Rest of Europe Electronic Watch Market Revenue (billion) Forecast, by Application 2020 & 2033
- Table 52: Rest of Europe Electronic Watch Market Volume (K Units ) Forecast, by Application 2020 & 2033
- Table 53: Global Electronic Watch Market Revenue billion Forecast, by Product type 2020 & 2033
- Table 54: Global Electronic Watch Market Volume K Units Forecast, by Product type 2020 & 2033
- Table 55: Global Electronic Watch Market Revenue billion Forecast, by End user 2020 & 2033
- Table 56: Global Electronic Watch Market Volume K Units Forecast, by End user 2020 & 2033
- Table 57: Global Electronic Watch Market Revenue billion Forecast, by Category 2020 & 2033
- Table 58: Global Electronic Watch Market Volume K Units Forecast, by Category 2020 & 2033
- Table 59: Global Electronic Watch Market Revenue billion Forecast, by Distribution Channel 2020 & 2033
- Table 60: Global Electronic Watch Market Volume K Units Forecast, by Distribution Channel 2020 & 2033
- Table 61: Global Electronic Watch Market Revenue billion Forecast, by Country 2020 & 2033
- Table 62: Global Electronic Watch Market Volume K Units Forecast, by Country 2020 & 2033
- Table 63: China Electronic Watch Market Revenue (billion) Forecast, by Application 2020 & 2033
- Table 64: China Electronic Watch Market Volume (K Units ) Forecast, by Application 2020 & 2033
- Table 65: Japan Electronic Watch Market Revenue (billion) Forecast, by Application 2020 & 2033
- Table 66: Japan Electronic Watch Market Volume (K Units ) Forecast, by Application 2020 & 2033
- Table 67: India Electronic Watch Market Revenue (billion) Forecast, by Application 2020 & 2033
- Table 68: India Electronic Watch Market Volume (K Units ) Forecast, by Application 2020 & 2033
- Table 69: Australia Electronic Watch Market Revenue (billion) Forecast, by Application 2020 & 2033
- Table 70: Australia Electronic Watch Market Volume (K Units ) Forecast, by Application 2020 & 2033
- Table 71: Rest of Asia Pacific Electronic Watch Market Revenue (billion) Forecast, by Application 2020 & 2033
- Table 72: Rest of Asia Pacific Electronic Watch Market Volume (K Units ) Forecast, by Application 2020 & 2033
- Table 73: Global Electronic Watch Market Revenue billion Forecast, by Product type 2020 & 2033
- Table 74: Global Electronic Watch Market Volume K Units Forecast, by Product type 2020 & 2033
- Table 75: Global Electronic Watch Market Revenue billion Forecast, by End user 2020 & 2033
- Table 76: Global Electronic Watch Market Volume K Units Forecast, by End user 2020 & 2033
- Table 77: Global Electronic Watch Market Revenue billion Forecast, by Category 2020 & 2033
- Table 78: Global Electronic Watch Market Volume K Units Forecast, by Category 2020 & 2033
- Table 79: Global Electronic Watch Market Revenue billion Forecast, by Distribution Channel 2020 & 2033
- Table 80: Global Electronic Watch Market Volume K Units Forecast, by Distribution Channel 2020 & 2033
- Table 81: Global Electronic Watch Market Revenue billion Forecast, by Country 2020 & 2033
- Table 82: Global Electronic Watch Market Volume K Units Forecast, by Country 2020 & 2033
- Table 83: Brazil Electronic Watch Market Revenue (billion) Forecast, by Application 2020 & 2033
- Table 84: Brazil Electronic Watch Market Volume (K Units ) Forecast, by Application 2020 & 2033
- Table 85: Argentina Electronic Watch Market Revenue (billion) Forecast, by Application 2020 & 2033
- Table 86: Argentina Electronic Watch Market Volume (K Units ) Forecast, by Application 2020 & 2033
- Table 87: Rest of South America Electronic Watch Market Revenue (billion) Forecast, by Application 2020 & 2033
- Table 88: Rest of South America Electronic Watch Market Volume (K Units ) Forecast, by Application 2020 & 2033
- Table 89: Global Electronic Watch Market Revenue billion Forecast, by Product type 2020 & 2033
- Table 90: Global Electronic Watch Market Volume K Units Forecast, by Product type 2020 & 2033
- Table 91: Global Electronic Watch Market Revenue billion Forecast, by End user 2020 & 2033
- Table 92: Global Electronic Watch Market Volume K Units Forecast, by End user 2020 & 2033
- Table 93: Global Electronic Watch Market Revenue billion Forecast, by Category 2020 & 2033
- Table 94: Global Electronic Watch Market Volume K Units Forecast, by Category 2020 & 2033
- Table 95: Global Electronic Watch Market Revenue billion Forecast, by Distribution Channel 2020 & 2033
- Table 96: Global Electronic Watch Market Volume K Units Forecast, by Distribution Channel 2020 & 2033
- Table 97: Global Electronic Watch Market Revenue billion Forecast, by Country 2020 & 2033
- Table 98: Global Electronic Watch Market Volume K Units Forecast, by Country 2020 & 2033
- Table 99: Global Electronic Watch Market Revenue billion Forecast, by Product type 2020 & 2033
- Table 100: Global Electronic Watch Market Volume K Units Forecast, by Product type 2020 & 2033
- Table 101: Global Electronic Watch Market Revenue billion Forecast, by End user 2020 & 2033
- Table 102: Global Electronic Watch Market Volume K Units Forecast, by End user 2020 & 2033
- Table 103: Global Electronic Watch Market Revenue billion Forecast, by Category 2020 & 2033
- Table 104: Global Electronic Watch Market Volume K Units Forecast, by Category 2020 & 2033
- Table 105: Global Electronic Watch Market Revenue billion Forecast, by Distribution Channel 2020 & 2033
- Table 106: Global Electronic Watch Market Volume K Units Forecast, by Distribution Channel 2020 & 2033
- Table 107: Global Electronic Watch Market Revenue billion Forecast, by Country 2020 & 2033
- Table 108: Global Electronic Watch Market Volume K Units Forecast, by Country 2020 & 2033
- Table 109: South Africa Electronic Watch Market Revenue (billion) Forecast, by Application 2020 & 2033
- Table 110: South Africa Electronic Watch Market Volume (K Units ) Forecast, by Application 2020 & 2033
- Table 111: Rest of Middle East Electronic Watch Market Revenue (billion) Forecast, by Application 2020 & 2033
- Table 112: Rest of Middle East Electronic Watch Market Volume (K Units ) Forecast, by Application 2020 & 2033
Frequently Asked Questions
1. What is the projected Compound Annual Growth Rate (CAGR) of the Electronic Watch Market?
The projected CAGR is approximately 5.06%.
2. Which companies are prominent players in the Electronic Watch Market?
Key companies in the market include Mobvoi Information Technology Company, Fitbit, Samsung Electronics Co Ltd, Garmin Ltd, Xiaomi Corporation, TAG Heuer S A*List Not Exhaustive, Zepp Health, Fossil Group Inc, Apple Inc, Huawei Device Co Ltd.
3. What are the main segments of the Electronic Watch Market?
The market segments include Product type, End user, Category, Distribution Channel.
4. Can you provide details about the market size?
The market size is estimated to be USD 77.48 billion as of 2022.
5. What are some drivers contributing to market growth?
Aggressive Marketing and Strategic Investments by Key Players; Growing Prevalence of Smokeless Tobacco Supported By Growth in Production of Tobacco.
6. What are the notable trends driving market growth?
Strong Demand from Fitness Conscious Consumer.
7. Are there any restraints impacting market growth?
Stringent Government Regulations Leading to Ban on Smokeless Tobacco.
8. Can you provide examples of recent developments in the market?
In April 2022, India-based smart accessories and audio brand Gizmore has launched its first 'Made in India' smartwatch with premium features at an affordable price.
9. What pricing options are available for accessing the report?
Pricing options include single-user, multi-user, and enterprise licenses priced at USD 4750, USD 5250, and USD 8750 respectively.
10. Is the market size provided in terms of value or volume?
The market size is provided in terms of value, measured in billion and volume, measured in K Units .
11. Are there any specific market keywords associated with the report?
Yes, the market keyword associated with the report is "Electronic Watch Market," which aids in identifying and referencing the specific market segment covered.
12. How do I determine which pricing option suits my needs best?
The pricing options vary based on user requirements and access needs. Individual users may opt for single-user licenses, while businesses requiring broader access may choose multi-user or enterprise licenses for cost-effective access to the report.
13. Are there any additional resources or data provided in the Electronic Watch Market report?
While the report offers comprehensive insights, it's advisable to review the specific contents or supplementary materials provided to ascertain if additional resources or data are available.
14. How can I stay updated on further developments or reports in the Electronic Watch Market?
To stay informed about further developments, trends, and reports in the Electronic Watch Market, consider subscribing to industry newsletters, following relevant companies and organizations, or regularly checking reputable industry news sources and publications.
Methodology
Step 1 - Identification of Relevant Samples Size from Population Database


Step 2 - Approaches for Defining Global Market Size (Value, Volume* & Price*)

Note*: In applicable scenarios
Step 3 - Data Sources
Primary Research
- Web Analytics
- Survey Reports
- Research Institute
- Latest Research Reports
- Opinion Leaders
Secondary Research
- Annual Reports
- White Paper
- Latest Press Release
- Industry Association
- Paid Database
- Investor Presentations

Step 4 - Data Triangulation
Involves using different sources of information in order to increase the validity of a study
These sources are likely to be stakeholders in a program - participants, other researchers, program staff, other community members, and so on.
Then we put all data in single framework & apply various statistical tools to find out the dynamic on the market.
During the analysis stage, feedback from the stakeholder groups would be compared to determine areas of agreement as well as areas of divergence