
Key Insights
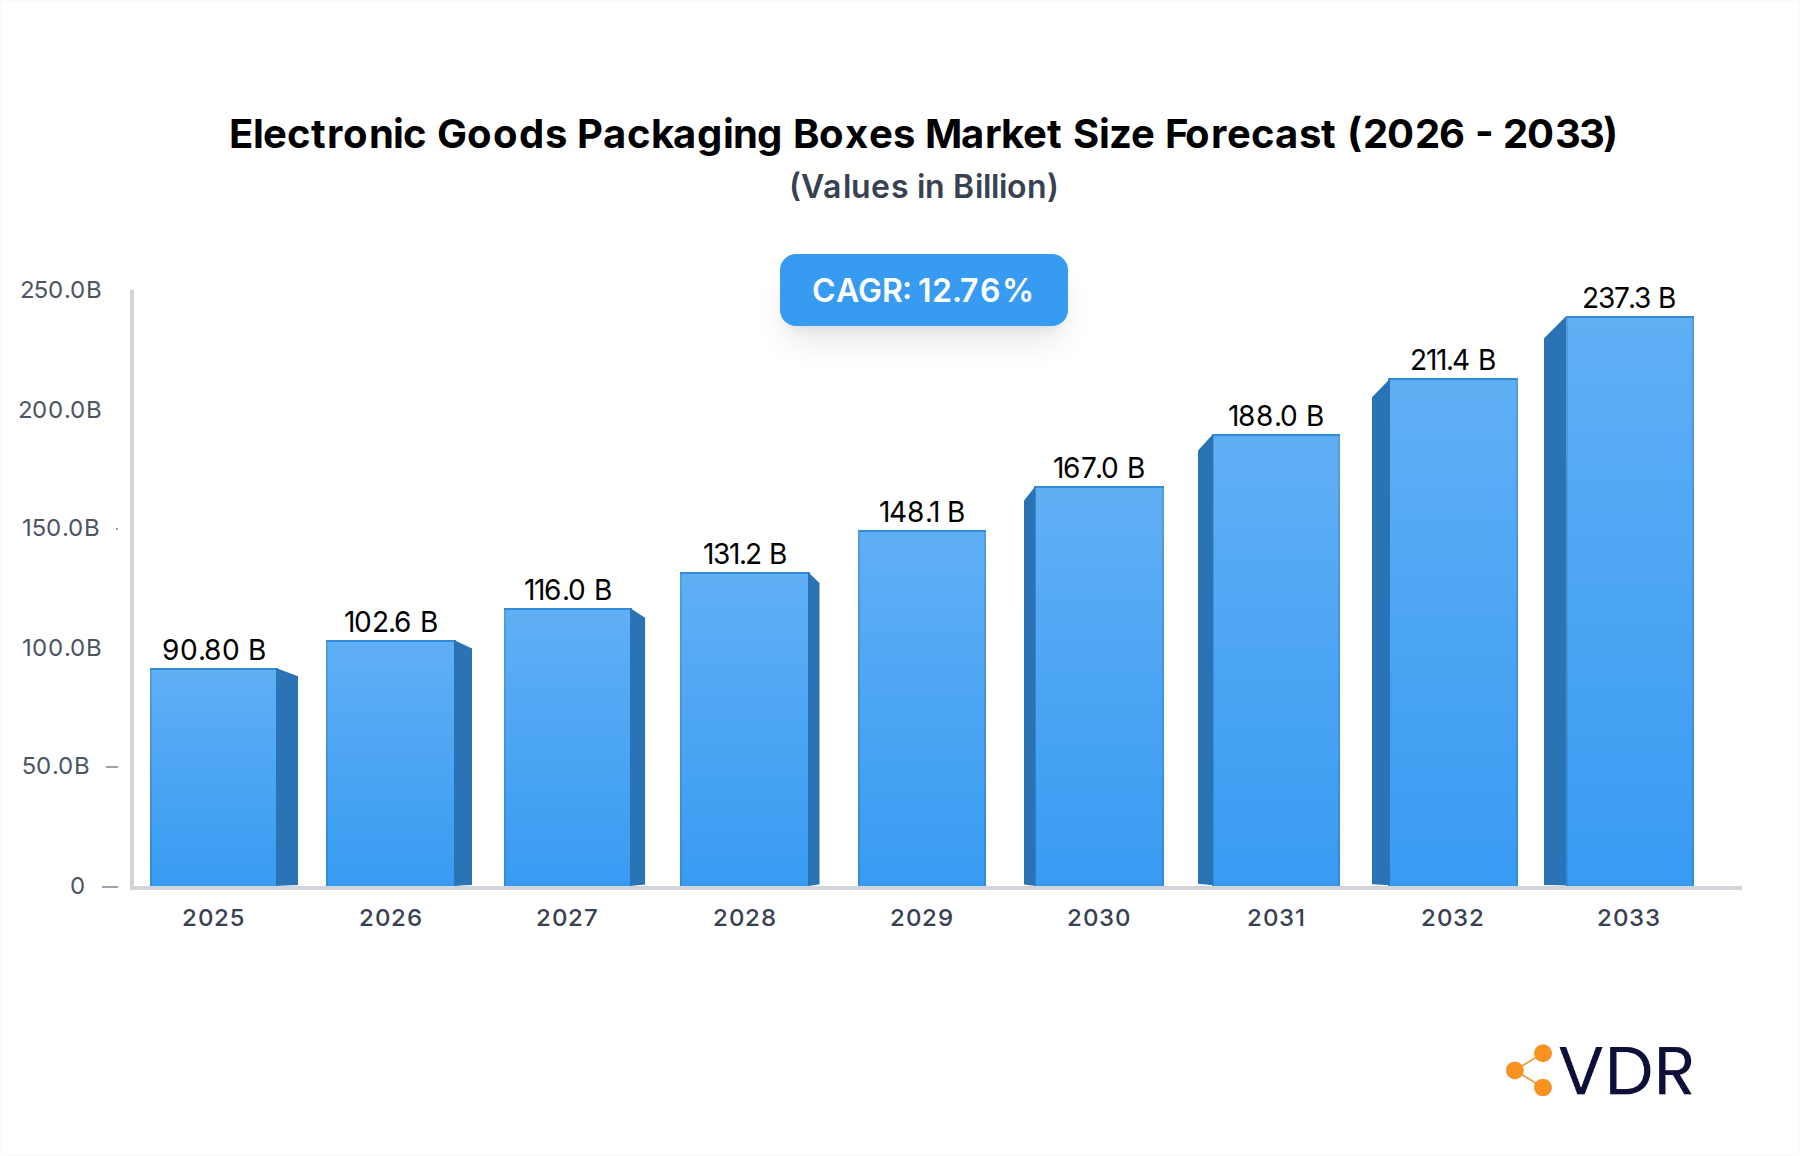
The global market for Electronic Goods Packaging Boxes is poised for substantial growth, projected to reach USD 90.8 billion in 2025. This robust expansion is underpinned by a compelling compound annual growth rate (CAGR) of 13% throughout the forecast period. The primary drivers propelling this surge are the ever-increasing global demand for consumer electronics, the rapid expansion of e-commerce, and the growing adoption of sustainable and innovative packaging solutions. As consumers continually upgrade their devices, the need for protective, visually appealing, and eco-friendly packaging for everything from smartphones and laptops to home appliances intensifies. The online retail segment, in particular, is a significant contributor, demanding packaging that can withstand the rigors of shipping and handling while also offering an unboxing experience that enhances brand perception. Furthermore, advancements in material science are leading to the development of lighter, stronger, and more sustainable packaging options like advanced paper-based materials and biodegradable alternatives, aligning with growing environmental consciousness among consumers and regulatory pressures.
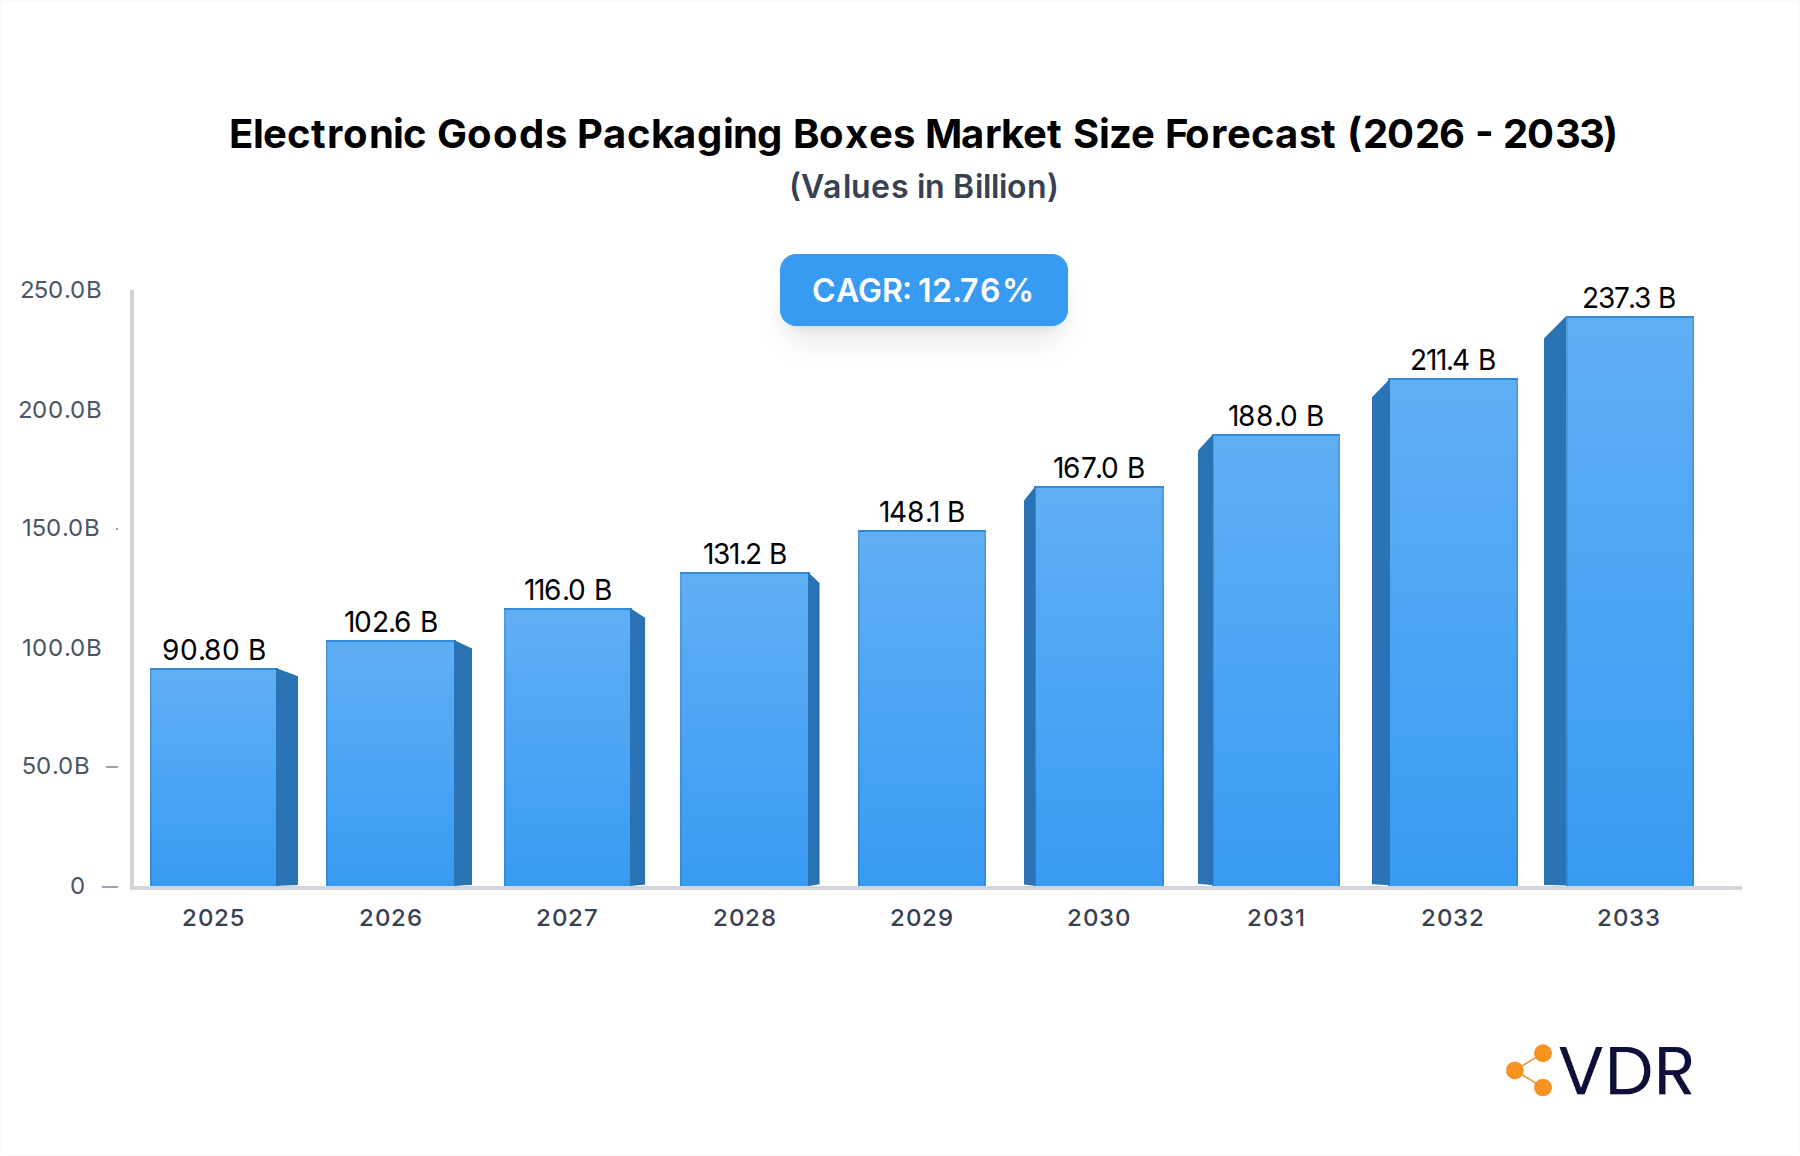
Electronic Goods Packaging Boxes Market Size (In Billion)

This dynamic market is further shaped by key trends such as the rise of smart packaging, which integrates features like tracking and authentication, and the increasing emphasis on customized and premium packaging to differentiate brands in a competitive landscape. While growth is strong, certain restraints exist, including fluctuations in raw material prices, particularly for paper and polypropylene, and the logistical challenges associated with global supply chains. Nevertheless, the market is characterized by a diverse range of players, from global giants like DS Smith and International Paper to specialized providers, all vying for market share through product innovation and strategic partnerships. The dominant regions are expected to be Asia Pacific, driven by its massive manufacturing base and burgeoning consumer market, followed by North America and Europe, both exhibiting strong adoption of premium and sustainable packaging solutions. The continuous evolution of consumer preferences and technological advancements will continue to shape the trajectory of the electronic goods packaging market, ensuring its continued relevance and growth.
Electronic Goods Packaging Boxes Company Market Share
Report Description: Electronic Goods Packaging Boxes Market - Global Outlook 2024-2033
This comprehensive report offers an in-depth analysis of the global Electronic Goods Packaging Boxes market, a critical component of the broader packaging industry. With a projected market size expected to reach $XX billion by 2033, this study delves into the intricate dynamics, growth trajectories, and competitive landscape shaping the future of packaging for electronics. We meticulously examine parent and child markets, providing granular insights into application-driven segments like Online Retail and Offline Retail, and material types including Paper, Wooden, Polypropylene, Kraft Paper, and Others.
The report leverages extensive data spanning the Historical Period (2019-2024), the Base Year (2025), and a detailed Forecast Period (2025-2033), with a Study Period (2019-2033) to capture long-term trends. It identifies key players such as DS Smith, International Paper, Mondi, Sealed Air, Lihua Group, Smurfit Kappa, Dunapack Packaging, Georgia Pacific, Graham Packaging, Pregis, Sonoco, Stora Enso, Unisource Worldwide, Universal Protective Packaging, and WestRock, highlighting their strategic contributions to the market's evolution. For industry professionals and stakeholders, this report is an indispensable resource for strategic decision-making, investment planning, and understanding the future of electronic packaging solutions.
Electronic Goods Packaging Boxes Market Dynamics & Structure
The Electronic Goods Packaging Boxes market is characterized by a moderately consolidated structure, with major players like Smurfit Kappa, WestRock, and International Paper holding significant market shares. Technological innovation is a primary driver, fueled by the demand for sustainable materials, enhanced product protection, and smart packaging solutions that integrate IoT capabilities for supply chain visibility. Regulatory frameworks, particularly concerning environmental sustainability and the reduction of single-use plastics, are increasingly influencing material choices and design innovations. Competitive product substitutes include molded pulp, foam packaging, and advanced flexible packaging, all vying for market share by offering tailored protective features and cost efficiencies.
- Market Concentration: Dominated by a few key global players, but with a significant presence of regional manufacturers catering to specific market needs.
- Technological Innovation Drivers: Increasing demand for sustainable materials (e.g., recycled paper, biodegradable plastics), lightweighting solutions, and smart packaging for tracking and anti-counterfeiting.
- Regulatory Frameworks: Stricter environmental regulations promoting circular economy principles, waste reduction mandates, and the phasing out of certain hazardous materials.
- Competitive Product Substitutes: Molded pulp, expanded polystyrene (EPS) foam, polyethylene foam, and innovative flexible packaging alternatives.
- End-User Demographics: Growing e-commerce penetration, increasing consumer demand for aesthetically pleasing and eco-friendly packaging, and the need for robust protection for high-value electronics.
- M&A Trends: Strategic acquisitions focused on expanding geographic reach, acquiring new technologies, and integrating sustainable packaging solutions. For instance, DS Smith's acquisition of Dupla Embalagens in 2023 aimed to bolster its presence in the South American market. WestRock's merger with Amcor would create a formidable entity in the packaging sector.
Electronic Goods Packaging Boxes Growth Trends & Insights
The Electronic Goods Packaging Boxes market has witnessed a robust growth trajectory, largely propelled by the insatiable demand for consumer electronics and the explosive growth of online retail. The market size, estimated at $XX billion in 2025, is projected to expand at a Compound Annual Growth Rate (CAGR) of XX% during the forecast period of 2025–2033. This expansion is underpinned by escalating consumer electronics sales globally, from smartphones and laptops to advanced gaming consoles and smart home devices, all requiring specialized packaging for protection and presentation. The digital transformation wave has significantly accelerated the adoption of Online Retail as a primary sales channel, directly boosting the demand for durable and efficient shipping packaging for electronics.
Technological disruptions are playing a pivotal role, with a heightened focus on sustainable and eco-friendly packaging materials. The industry is witnessing a substantial shift towards Paper-based solutions, including Kraft Paper, owing to their recyclability and biodegradability, aligning with growing environmental consciousness among consumers and stricter governmental regulations. This trend is exemplified by a XX% increase in the adoption of recycled paper-based packaging for electronic goods between 2020 and 2024. Furthermore, advancements in material science are leading to the development of lightweight yet highly protective packaging, optimizing shipping costs and reducing the carbon footprint.
Consumer behavior shifts are also critical. The unboxing experience has become an integral part of the consumer journey, leading manufacturers to invest in premium, visually appealing, and sustainable packaging designs. This has spurred innovation in custom-fit solutions, protective inserts, and branded elements that enhance the perceived value of electronic products. Market penetration of specialized electronic packaging is projected to reach XX% by 2033, as more manufacturers recognize the importance of packaging in brand perception and customer satisfaction. The growth is further sustained by the increasing demand for protective packaging for sensitive components and the need to mitigate damage during transit, especially for high-value items. The market is expected to be valued at $XX billion in 2033, demonstrating a consistent upward trend.
Dominant Regions, Countries, or Segments in Electronic Goods Packaging Boxes
The Online Retail segment, within the broader Electronic Goods Packaging Boxes market, is unequivocally the dominant force driving global growth. This segment's ascendancy is directly correlated with the exponential rise of e-commerce platforms and the increasing consumer preference for convenient online shopping experiences. As consumers worldwide embrace the ease of purchasing electronics online, the demand for robust, protective, and cost-effective shipping solutions for these often delicate and high-value items has surged. The Online Retail segment is projected to account for XX% of the total market revenue by 2033, showcasing its significant market share and growth potential.
Key drivers propelling the dominance of the Online Retail segment include:
- E-commerce Expansion: The continuous growth of online marketplaces and direct-to-consumer (DTC) sales channels for electronics globally provides a consistent and expanding customer base.
- Logistical Efficiency: Packaging designed for efficient stacking, handling, and shipping is crucial for online retailers to manage large volumes and optimize delivery timelines. This includes the widespread adoption of Paper and Kraft Paper packaging due to their lightweight nature and recyclability, facilitating easier logistics and lower transportation costs.
- Consumer Expectations: Online shoppers expect their purchases to arrive intact and well-presented. This necessitates advanced protective packaging that can withstand the rigors of transit, from warehouse to doorstep.
- Technological Integration: Smart packaging solutions, such as those offering track-and-trace capabilities or tamper-evident features, are increasingly being adopted in the online retail space to enhance supply chain visibility and combat fraud.
Geographically, North America and Asia Pacific are leading regions for the Electronic Goods Packaging Boxes market, largely driven by the high adoption rates of e-commerce and the significant presence of major electronics manufacturing hubs.
- North America: Driven by advanced e-commerce infrastructure, high disposable incomes, and a strong consumer demand for the latest electronic gadgets. The United States, in particular, is a major market, with a substantial portion of its electronics sales occurring online.
- Asia Pacific: Emerging as a powerhouse due to the rapid growth of its digital economy, burgeoning middle class, and its role as a global manufacturing center for electronics. Countries like China, India, and South Korea are significant contributors to the demand for electronic goods packaging.
The dominant material type within the Online Retail segment is increasingly Paper and Kraft Paper, driven by sustainability initiatives and the need for lightweight yet durable solutions. While Polypropylene finds applications in certain protective inserts, the primary shipping and secondary packaging is leaning towards eco-friendly paper-based options.
Electronic Goods Packaging Boxes Product Landscape
The Electronic Goods Packaging Boxes market is characterized by a dynamic product landscape focused on enhanced protection, sustainability, and consumer experience. Innovations center around the development of lightweight yet robust structures, often utilizing corrugated Paper and Kraft Paper to minimize shipping costs and environmental impact. Companies are investing in advanced designs that offer superior shock absorption, vibration dampening, and moisture resistance, crucial for safeguarding sensitive electronic components during transit. Furthermore, the trend towards premiumization is evident in the adoption of visually appealing finishes, custom-fit inserts, and smart features like integrated QR codes for product authentication and detailed information access. The Others category encompasses specialized solutions like antistatic packaging for sensitive electronic components and molded pulp inserts that offer a sustainable and customizable protective solution.
Key Drivers, Barriers & Challenges in Electronic Goods Packaging Boxes
Key Drivers:
The Electronic Goods Packaging Boxes market is propelled by several potent forces. The relentless growth of the global electronics industry, encompassing smartphones, laptops, and smart home devices, directly fuels demand for protective packaging. The surge in online retail is a monumental driver, necessitating efficient and durable shipping solutions. Technological advancements in material science are leading to the development of lighter, stronger, and more sustainable packaging options, particularly Paper and Kraft Paper. Furthermore, increasing consumer awareness regarding environmental sustainability is pushing manufacturers towards eco-friendly packaging solutions, such as those that are recyclable and biodegradable. Strategic initiatives by major players, including M&A activity and investments in R&D for innovative packaging designs, also contribute significantly to market growth.
Barriers & Challenges:
Despite robust growth, the market faces significant hurdles. Fluctuations in the raw material costs, particularly for paper pulp and petrochemicals used in plastics, can impact profitability and pricing strategies. Supply chain disruptions, as witnessed in recent years, can lead to material shortages and increased lead times, affecting production schedules. Stringent regulatory landscapes concerning packaging waste and recyclability can impose compliance costs on manufacturers. The competitive intensity within the packaging industry, with numerous players vying for market share, can lead to price pressures. Moreover, the development of truly biodegradable and compostable alternatives that can match the protective performance of traditional materials at a comparable cost remains a technical challenge. The estimated impact of supply chain disruptions on lead times is currently between XX%-XX%.
Emerging Opportunities in Electronic Goods Packaging Boxes
Emerging opportunities in the Electronic Goods Packaging Boxes market are primarily centered around sustainability, customization, and the integration of smart technologies. The growing demand for eco-friendly packaging presents a significant avenue for innovation in biodegradable and compostable materials, moving beyond traditional paper-based solutions to explore advanced bioplastics and molded fiber alternatives. The customization trend in consumer electronics extends to their packaging, creating opportunities for bespoke designs that enhance the unboxing experience and brand loyalty. Furthermore, the integration of smart technologies into packaging, such as embedded RFID tags for enhanced traceability, NFC chips for authentication, and even temperature sensors for sensitive electronics, offers new avenues for value-added solutions. The untapped potential in emerging economies, with their rapidly expanding e-commerce sectors and growing middle class, also represents a substantial growth opportunity for electronic goods packaging. The market for smart electronic packaging is projected to grow at a CAGR of XX% from 2025-2033.
Growth Accelerators in the Electronic Goods Packaging Boxes Industry
The Electronic Goods Packaging Boxes industry is poised for accelerated growth driven by several catalysts. The continuous evolution of consumer electronics, with new product launches and increased device complexity, necessitates constant innovation in protective packaging. Strategic partnerships between packaging manufacturers and electronics companies are crucial for developing tailor-made solutions that meet specific product requirements and brand aesthetics. Market expansion into emerging economies with rapidly developing e-commerce infrastructure and a burgeoning consumer base for electronics represents a significant growth accelerator. Investments in research and development focused on sustainable materials, advanced protective technologies (e.g., active and intelligent packaging), and efficient design processes will further propel growth. The shift towards a circular economy model, with increased emphasis on recyclability and waste reduction, will also drive the adoption of innovative packaging solutions.
Key Players Shaping the Electronic Goods Packaging Boxes Market
- DS Smith
- International Paper
- Mondi
- Sealed Air
- Lihua Group
- Smurfit Kappa
- Dunapack Packaging
- Georgia Pacific
- Graham Packaging
- Pregis
- Sonoco
- Stora Enso
- Unisource Worldwide
- Universal Protective Packaging
- WestRock
Notable Milestones in Electronic Goods Packaging Boxes Sector
- 2022: Mondi launches its PerFORM range of recyclable paper-based packaging solutions, demonstrating a commitment to sustainability.
- 2023 (Q2): Smurfit Kappa acquires a majority stake in ExPak, a leading corrugated packaging producer in Southeast Asia, expanding its global reach.
- 2023 (Q4): Sealed Air introduces its new line of protective packaging films made from 100% recycled content, addressing growing environmental concerns.
- 2024 (Q1): WestRock announces its acquisition of Adaptal, a specialist in protective packaging for the electronics sector, enhancing its product portfolio.
- 2024 (Q3): Lihua Group invests heavily in advanced automation for its corrugated board production, aiming to boost efficiency and product consistency.
- 2025 (Projected): Increased adoption of smart packaging solutions with integrated IoT capabilities for enhanced supply chain visibility.
- 2025-2030: Significant market push towards fully circular packaging solutions for electronics, driven by regulatory pressures and consumer demand.
In-Depth Electronic Goods Packaging Boxes Market Outlook
The future of the Electronic Goods Packaging Boxes market is exceptionally bright, driven by an interplay of technological advancements, evolving consumer preferences, and expanding global markets. Growth accelerators, including the persistent demand for new electronic devices, the pervasive influence of online retail, and a resolute focus on sustainable packaging solutions, will continue to shape the industry's trajectory. The increasing adoption of Paper and Kraft Paper packaging, alongside innovations in biodegradable and compostable materials, signals a strong commitment to environmental responsibility. Strategic partnerships, mergers, and acquisitions will further consolidate the market and foster innovation, while the expansion into untapped emerging economies promises substantial growth. The market is expected to witness a steady increase in the integration of smart technologies, offering enhanced functionality and value to both manufacturers and consumers, thereby ensuring sustained and robust growth in the coming years.
Electronic Goods Packaging Boxes Segmentation
-
1. Application
- 1.1. Online Retail
- 1.2. Offline Retail
-
2. Type
- 2.1. Paper
- 2.2. Wooden
- 2.3. Polypropylene
- 2.4. Kraft Paper
- 2.5. Others
Electronic Goods Packaging Boxes Segmentation By Geography
-
1. North America
- 1.1. United States
- 1.2. Canada
- 1.3. Mexico
-
2. South America
- 2.1. Brazil
- 2.2. Argentina
- 2.3. Rest of South America
-
3. Europe
- 3.1. United Kingdom
- 3.2. Germany
- 3.3. France
- 3.4. Italy
- 3.5. Spain
- 3.6. Russia
- 3.7. Benelux
- 3.8. Nordics
- 3.9. Rest of Europe
-
4. Middle East & Africa
- 4.1. Turkey
- 4.2. Israel
- 4.3. GCC
- 4.4. North Africa
- 4.5. South Africa
- 4.6. Rest of Middle East & Africa
-
5. Asia Pacific
- 5.1. China
- 5.2. India
- 5.3. Japan
- 5.4. South Korea
- 5.5. ASEAN
- 5.6. Oceania
- 5.7. Rest of Asia Pacific
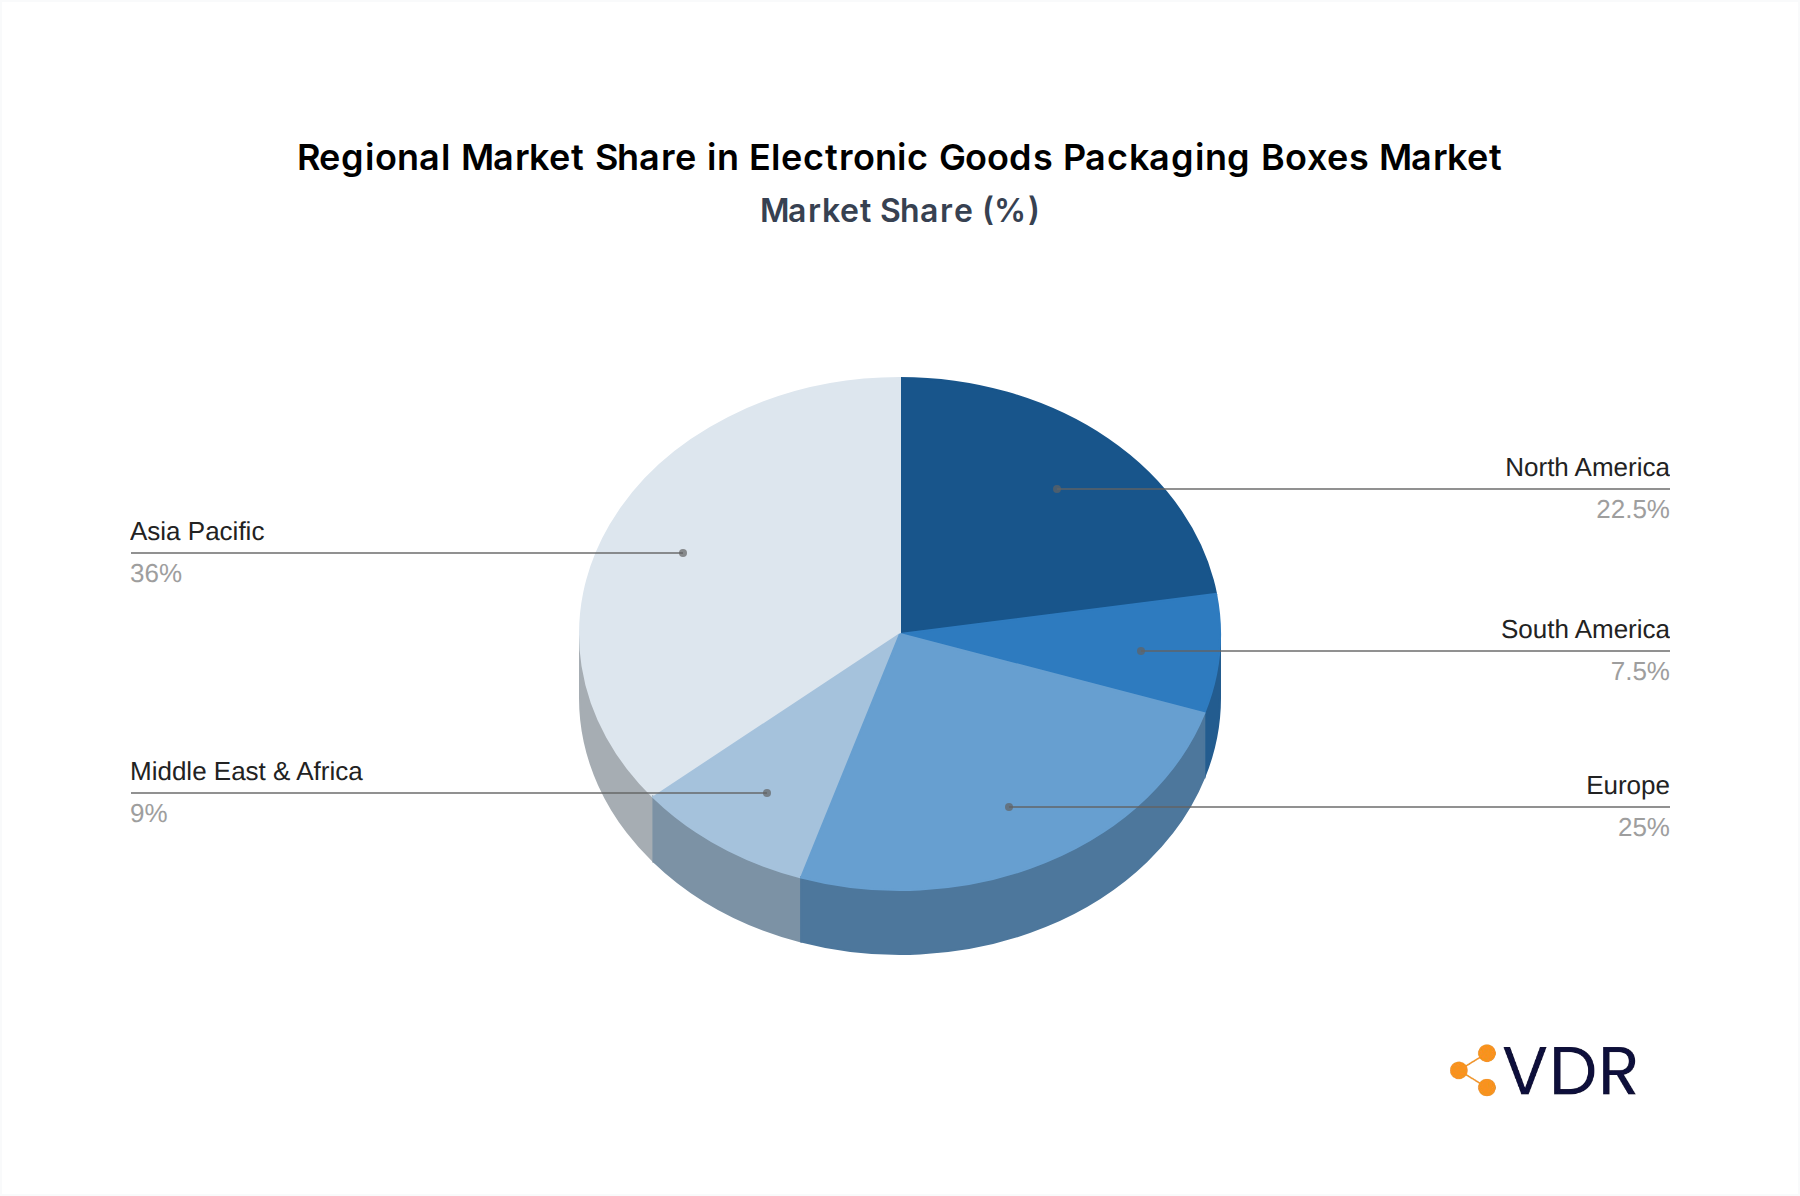
Electronic Goods Packaging Boxes Regional Market Share
Geographic Coverage of Electronic Goods Packaging Boxes
Electronic Goods Packaging Boxes REPORT HIGHLIGHTS
| Aspects | Details |
|---|---|
| Study Period | 2020-2034 |
| Base Year | 2025 |
| Estimated Year | 2026 |
| Forecast Period | 2026-2034 |
| Historical Period | 2020-2025 |
| Growth Rate | CAGR of 7.45% from 2020-2034 |
| Segmentation |
|
Table of Contents
- 1. Introduction
- 1.1. Research Scope
- 1.2. Market Segmentation
- 1.3. Research Objective
- 1.4. Definitions and Assumptions
- 2. Executive Summary
- 2.1. Market Snapshot
- 3. Market Dynamics
- 3.1. Market Drivers
- 3.2. Market Restrains
- 3.3. Market Trends
- 3.4. Market Opportunities
- 4. Market Factor Analysis
- 4.1. Porters Five Forces
- 4.1.1. Bargaining Power of Suppliers
- 4.1.2. Bargaining Power of Buyers
- 4.1.3. Threat of New Entrants
- 4.1.4. Threat of Substitutes
- 4.1.5. Competitive Rivalry
- 4.2. PESTEL analysis
- 4.3. BCG Analysis
- 4.3.1. Stars (High Growth, High Market Share)
- 4.3.2. Cash Cows (Low Growth, High Market Share)
- 4.3.3. Question Mark (High Growth, Low Market Share)
- 4.3.4. Dogs (Low Growth, Low Market Share)
- 4.4. Ansoff Matrix Analysis
- 4.5. Supply Chain Analysis
- 4.6. Regulatory Landscape
- 4.7. Current Market Potential and Opportunity Assessment (TAM–SAM–SOM Framework)
- 4.8. VDR Analyst Note
- 4.1. Porters Five Forces
- 5. Market Analysis, Insights and Forecast 2021-2033
- 5.1. Market Analysis, Insights and Forecast - by Application
- 5.1.1. Online Retail
- 5.1.2. Offline Retail
- 5.2. Market Analysis, Insights and Forecast - by Type
- 5.2.1. Paper
- 5.2.2. Wooden
- 5.2.3. Polypropylene
- 5.2.4. Kraft Paper
- 5.2.5. Others
- 5.3. Market Analysis, Insights and Forecast - by Region
- 5.3.1. North America
- 5.3.2. South America
- 5.3.3. Europe
- 5.3.4. Middle East & Africa
- 5.3.5. Asia Pacific
- 5.1. Market Analysis, Insights and Forecast - by Application
- 6. Global Electronic Goods Packaging Boxes Analysis, Insights and Forecast, 2021-2033
- 6.1. Market Analysis, Insights and Forecast - by Application
- 6.1.1. Online Retail
- 6.1.2. Offline Retail
- 6.2. Market Analysis, Insights and Forecast - by Type
- 6.2.1. Paper
- 6.2.2. Wooden
- 6.2.3. Polypropylene
- 6.2.4. Kraft Paper
- 6.2.5. Others
- 6.1. Market Analysis, Insights and Forecast - by Application
- 7. North America Electronic Goods Packaging Boxes Analysis, Insights and Forecast, 2021-2033
- 7.1. Market Analysis, Insights and Forecast - by Application
- 7.1.1. Online Retail
- 7.1.2. Offline Retail
- 7.2. Market Analysis, Insights and Forecast - by Type
- 7.2.1. Paper
- 7.2.2. Wooden
- 7.2.3. Polypropylene
- 7.2.4. Kraft Paper
- 7.2.5. Others
- 7.1. Market Analysis, Insights and Forecast - by Application
- 8. South America Electronic Goods Packaging Boxes Analysis, Insights and Forecast, 2021-2033
- 8.1. Market Analysis, Insights and Forecast - by Application
- 8.1.1. Online Retail
- 8.1.2. Offline Retail
- 8.2. Market Analysis, Insights and Forecast - by Type
- 8.2.1. Paper
- 8.2.2. Wooden
- 8.2.3. Polypropylene
- 8.2.4. Kraft Paper
- 8.2.5. Others
- 8.1. Market Analysis, Insights and Forecast - by Application
- 9. Europe Electronic Goods Packaging Boxes Analysis, Insights and Forecast, 2021-2033
- 9.1. Market Analysis, Insights and Forecast - by Application
- 9.1.1. Online Retail
- 9.1.2. Offline Retail
- 9.2. Market Analysis, Insights and Forecast - by Type
- 9.2.1. Paper
- 9.2.2. Wooden
- 9.2.3. Polypropylene
- 9.2.4. Kraft Paper
- 9.2.5. Others
- 9.1. Market Analysis, Insights and Forecast - by Application
- 10. Middle East & Africa Electronic Goods Packaging Boxes Analysis, Insights and Forecast, 2021-2033
- 10.1. Market Analysis, Insights and Forecast - by Application
- 10.1.1. Online Retail
- 10.1.2. Offline Retail
- 10.2. Market Analysis, Insights and Forecast - by Type
- 10.2.1. Paper
- 10.2.2. Wooden
- 10.2.3. Polypropylene
- 10.2.4. Kraft Paper
- 10.2.5. Others
- 10.1. Market Analysis, Insights and Forecast - by Application
- 11. Asia Pacific Electronic Goods Packaging Boxes Analysis, Insights and Forecast, 2021-2033
- 11.1. Market Analysis, Insights and Forecast - by Application
- 11.1.1. Online Retail
- 11.1.2. Offline Retail
- 11.2. Market Analysis, Insights and Forecast - by Type
- 11.2.1. Paper
- 11.2.2. Wooden
- 11.2.3. Polypropylene
- 11.2.4. Kraft Paper
- 11.2.5. Others
- 11.1. Market Analysis, Insights and Forecast - by Application
- 12. Competitive Analysis
- 12.1. Company Profiles
- 12.1.1 DS Smith
- 12.1.1.1. Company Overview
- 12.1.1.2. Products
- 12.1.1.3. Company Financials
- 12.1.1.4. SWOT Analysis
- 12.1.2 International Paper
- 12.1.2.1. Company Overview
- 12.1.2.2. Products
- 12.1.2.3. Company Financials
- 12.1.2.4. SWOT Analysis
- 12.1.3 Mondi
- 12.1.3.1. Company Overview
- 12.1.3.2. Products
- 12.1.3.3. Company Financials
- 12.1.3.4. SWOT Analysis
- 12.1.4 Sealed Air
- 12.1.4.1. Company Overview
- 12.1.4.2. Products
- 12.1.4.3. Company Financials
- 12.1.4.4. SWOT Analysis
- 12.1.5 Lihua Group
- 12.1.5.1. Company Overview
- 12.1.5.2. Products
- 12.1.5.3. Company Financials
- 12.1.5.4. SWOT Analysis
- 12.1.6 Smurfit Kappa
- 12.1.6.1. Company Overview
- 12.1.6.2. Products
- 12.1.6.3. Company Financials
- 12.1.6.4. SWOT Analysis
- 12.1.7 Dunapack Packaging
- 12.1.7.1. Company Overview
- 12.1.7.2. Products
- 12.1.7.3. Company Financials
- 12.1.7.4. SWOT Analysis
- 12.1.8 Georgia Pacific
- 12.1.8.1. Company Overview
- 12.1.8.2. Products
- 12.1.8.3. Company Financials
- 12.1.8.4. SWOT Analysis
- 12.1.9 Graham Packaging
- 12.1.9.1. Company Overview
- 12.1.9.2. Products
- 12.1.9.3. Company Financials
- 12.1.9.4. SWOT Analysis
- 12.1.10 Pregis
- 12.1.10.1. Company Overview
- 12.1.10.2. Products
- 12.1.10.3. Company Financials
- 12.1.10.4. SWOT Analysis
- 12.1.11 Sonoco
- 12.1.11.1. Company Overview
- 12.1.11.2. Products
- 12.1.11.3. Company Financials
- 12.1.11.4. SWOT Analysis
- 12.1.12 Stora Enso
- 12.1.12.1. Company Overview
- 12.1.12.2. Products
- 12.1.12.3. Company Financials
- 12.1.12.4. SWOT Analysis
- 12.1.13 Unisource Worldwide
- 12.1.13.1. Company Overview
- 12.1.13.2. Products
- 12.1.13.3. Company Financials
- 12.1.13.4. SWOT Analysis
- 12.1.14 Universal Protective Packaging
- 12.1.14.1. Company Overview
- 12.1.14.2. Products
- 12.1.14.3. Company Financials
- 12.1.14.4. SWOT Analysis
- 12.1.15 WestRock
- 12.1.15.1. Company Overview
- 12.1.15.2. Products
- 12.1.15.3. Company Financials
- 12.1.15.4. SWOT Analysis
- 12.1.1 DS Smith
- 12.2. Market Entropy
- 12.2.1 Company's Key Areas Served
- 12.2.2 Recent Developments
- 12.3. Company Market Share Analysis 2025
- 12.3.1 Top 5 Companies Market Share Analysis
- 12.3.2 Top 3 Companies Market Share Analysis
- 12.4. List of Potential Customers
- 13. Research Methodology
List of Figures
- Figure 1: Global Electronic Goods Packaging Boxes Revenue Breakdown (billion, %) by Region 2025 & 2033
- Figure 2: North America Electronic Goods Packaging Boxes Revenue (billion), by Application 2025 & 2033
- Figure 3: North America Electronic Goods Packaging Boxes Revenue Share (%), by Application 2025 & 2033
- Figure 4: North America Electronic Goods Packaging Boxes Revenue (billion), by Type 2025 & 2033
- Figure 5: North America Electronic Goods Packaging Boxes Revenue Share (%), by Type 2025 & 2033
- Figure 6: North America Electronic Goods Packaging Boxes Revenue (billion), by Country 2025 & 2033
- Figure 7: North America Electronic Goods Packaging Boxes Revenue Share (%), by Country 2025 & 2033
- Figure 8: South America Electronic Goods Packaging Boxes Revenue (billion), by Application 2025 & 2033
- Figure 9: South America Electronic Goods Packaging Boxes Revenue Share (%), by Application 2025 & 2033
- Figure 10: South America Electronic Goods Packaging Boxes Revenue (billion), by Type 2025 & 2033
- Figure 11: South America Electronic Goods Packaging Boxes Revenue Share (%), by Type 2025 & 2033
- Figure 12: South America Electronic Goods Packaging Boxes Revenue (billion), by Country 2025 & 2033
- Figure 13: South America Electronic Goods Packaging Boxes Revenue Share (%), by Country 2025 & 2033
- Figure 14: Europe Electronic Goods Packaging Boxes Revenue (billion), by Application 2025 & 2033
- Figure 15: Europe Electronic Goods Packaging Boxes Revenue Share (%), by Application 2025 & 2033
- Figure 16: Europe Electronic Goods Packaging Boxes Revenue (billion), by Type 2025 & 2033
- Figure 17: Europe Electronic Goods Packaging Boxes Revenue Share (%), by Type 2025 & 2033
- Figure 18: Europe Electronic Goods Packaging Boxes Revenue (billion), by Country 2025 & 2033
- Figure 19: Europe Electronic Goods Packaging Boxes Revenue Share (%), by Country 2025 & 2033
- Figure 20: Middle East & Africa Electronic Goods Packaging Boxes Revenue (billion), by Application 2025 & 2033
- Figure 21: Middle East & Africa Electronic Goods Packaging Boxes Revenue Share (%), by Application 2025 & 2033
- Figure 22: Middle East & Africa Electronic Goods Packaging Boxes Revenue (billion), by Type 2025 & 2033
- Figure 23: Middle East & Africa Electronic Goods Packaging Boxes Revenue Share (%), by Type 2025 & 2033
- Figure 24: Middle East & Africa Electronic Goods Packaging Boxes Revenue (billion), by Country 2025 & 2033
- Figure 25: Middle East & Africa Electronic Goods Packaging Boxes Revenue Share (%), by Country 2025 & 2033
- Figure 26: Asia Pacific Electronic Goods Packaging Boxes Revenue (billion), by Application 2025 & 2033
- Figure 27: Asia Pacific Electronic Goods Packaging Boxes Revenue Share (%), by Application 2025 & 2033
- Figure 28: Asia Pacific Electronic Goods Packaging Boxes Revenue (billion), by Type 2025 & 2033
- Figure 29: Asia Pacific Electronic Goods Packaging Boxes Revenue Share (%), by Type 2025 & 2033
- Figure 30: Asia Pacific Electronic Goods Packaging Boxes Revenue (billion), by Country 2025 & 2033
- Figure 31: Asia Pacific Electronic Goods Packaging Boxes Revenue Share (%), by Country 2025 & 2033
List of Tables
- Table 1: Global Electronic Goods Packaging Boxes Revenue billion Forecast, by Application 2020 & 2033
- Table 2: Global Electronic Goods Packaging Boxes Revenue billion Forecast, by Type 2020 & 2033
- Table 3: Global Electronic Goods Packaging Boxes Revenue billion Forecast, by Region 2020 & 2033
- Table 4: Global Electronic Goods Packaging Boxes Revenue billion Forecast, by Application 2020 & 2033
- Table 5: Global Electronic Goods Packaging Boxes Revenue billion Forecast, by Type 2020 & 2033
- Table 6: Global Electronic Goods Packaging Boxes Revenue billion Forecast, by Country 2020 & 2033
- Table 7: United States Electronic Goods Packaging Boxes Revenue (billion) Forecast, by Application 2020 & 2033
- Table 8: Canada Electronic Goods Packaging Boxes Revenue (billion) Forecast, by Application 2020 & 2033
- Table 9: Mexico Electronic Goods Packaging Boxes Revenue (billion) Forecast, by Application 2020 & 2033
- Table 10: Global Electronic Goods Packaging Boxes Revenue billion Forecast, by Application 2020 & 2033
- Table 11: Global Electronic Goods Packaging Boxes Revenue billion Forecast, by Type 2020 & 2033
- Table 12: Global Electronic Goods Packaging Boxes Revenue billion Forecast, by Country 2020 & 2033
- Table 13: Brazil Electronic Goods Packaging Boxes Revenue (billion) Forecast, by Application 2020 & 2033
- Table 14: Argentina Electronic Goods Packaging Boxes Revenue (billion) Forecast, by Application 2020 & 2033
- Table 15: Rest of South America Electronic Goods Packaging Boxes Revenue (billion) Forecast, by Application 2020 & 2033
- Table 16: Global Electronic Goods Packaging Boxes Revenue billion Forecast, by Application 2020 & 2033
- Table 17: Global Electronic Goods Packaging Boxes Revenue billion Forecast, by Type 2020 & 2033
- Table 18: Global Electronic Goods Packaging Boxes Revenue billion Forecast, by Country 2020 & 2033
- Table 19: United Kingdom Electronic Goods Packaging Boxes Revenue (billion) Forecast, by Application 2020 & 2033
- Table 20: Germany Electronic Goods Packaging Boxes Revenue (billion) Forecast, by Application 2020 & 2033
- Table 21: France Electronic Goods Packaging Boxes Revenue (billion) Forecast, by Application 2020 & 2033
- Table 22: Italy Electronic Goods Packaging Boxes Revenue (billion) Forecast, by Application 2020 & 2033
- Table 23: Spain Electronic Goods Packaging Boxes Revenue (billion) Forecast, by Application 2020 & 2033
- Table 24: Russia Electronic Goods Packaging Boxes Revenue (billion) Forecast, by Application 2020 & 2033
- Table 25: Benelux Electronic Goods Packaging Boxes Revenue (billion) Forecast, by Application 2020 & 2033
- Table 26: Nordics Electronic Goods Packaging Boxes Revenue (billion) Forecast, by Application 2020 & 2033
- Table 27: Rest of Europe Electronic Goods Packaging Boxes Revenue (billion) Forecast, by Application 2020 & 2033
- Table 28: Global Electronic Goods Packaging Boxes Revenue billion Forecast, by Application 2020 & 2033
- Table 29: Global Electronic Goods Packaging Boxes Revenue billion Forecast, by Type 2020 & 2033
- Table 30: Global Electronic Goods Packaging Boxes Revenue billion Forecast, by Country 2020 & 2033
- Table 31: Turkey Electronic Goods Packaging Boxes Revenue (billion) Forecast, by Application 2020 & 2033
- Table 32: Israel Electronic Goods Packaging Boxes Revenue (billion) Forecast, by Application 2020 & 2033
- Table 33: GCC Electronic Goods Packaging Boxes Revenue (billion) Forecast, by Application 2020 & 2033
- Table 34: North Africa Electronic Goods Packaging Boxes Revenue (billion) Forecast, by Application 2020 & 2033
- Table 35: South Africa Electronic Goods Packaging Boxes Revenue (billion) Forecast, by Application 2020 & 2033
- Table 36: Rest of Middle East & Africa Electronic Goods Packaging Boxes Revenue (billion) Forecast, by Application 2020 & 2033
- Table 37: Global Electronic Goods Packaging Boxes Revenue billion Forecast, by Application 2020 & 2033
- Table 38: Global Electronic Goods Packaging Boxes Revenue billion Forecast, by Type 2020 & 2033
- Table 39: Global Electronic Goods Packaging Boxes Revenue billion Forecast, by Country 2020 & 2033
- Table 40: China Electronic Goods Packaging Boxes Revenue (billion) Forecast, by Application 2020 & 2033
- Table 41: India Electronic Goods Packaging Boxes Revenue (billion) Forecast, by Application 2020 & 2033
- Table 42: Japan Electronic Goods Packaging Boxes Revenue (billion) Forecast, by Application 2020 & 2033
- Table 43: South Korea Electronic Goods Packaging Boxes Revenue (billion) Forecast, by Application 2020 & 2033
- Table 44: ASEAN Electronic Goods Packaging Boxes Revenue (billion) Forecast, by Application 2020 & 2033
- Table 45: Oceania Electronic Goods Packaging Boxes Revenue (billion) Forecast, by Application 2020 & 2033
- Table 46: Rest of Asia Pacific Electronic Goods Packaging Boxes Revenue (billion) Forecast, by Application 2020 & 2033
Frequently Asked Questions
1. What is the projected Compound Annual Growth Rate (CAGR) of the Electronic Goods Packaging Boxes?
The projected CAGR is approximately 7.45%.
2. Which companies are prominent players in the Electronic Goods Packaging Boxes?
Key companies in the market include DS Smith, International Paper, Mondi, Sealed Air, Lihua Group, Smurfit Kappa, Dunapack Packaging, Georgia Pacific, Graham Packaging, Pregis, Sonoco, Stora Enso, Unisource Worldwide, Universal Protective Packaging, WestRock.
3. What are the main segments of the Electronic Goods Packaging Boxes?
The market segments include Application, Type.
4. Can you provide details about the market size?
The market size is estimated to be USD 79.83 billion as of 2022.
5. What are some drivers contributing to market growth?
N/A
6. What are the notable trends driving market growth?
N/A
7. Are there any restraints impacting market growth?
N/A
8. Can you provide examples of recent developments in the market?
N/A
9. What pricing options are available for accessing the report?
Pricing options include single-user, multi-user, and enterprise licenses priced at USD 2900.00, USD 4350.00, and USD 5800.00 respectively.
10. Is the market size provided in terms of value or volume?
The market size is provided in terms of value, measured in billion.
11. Are there any specific market keywords associated with the report?
Yes, the market keyword associated with the report is "Electronic Goods Packaging Boxes," which aids in identifying and referencing the specific market segment covered.
12. How do I determine which pricing option suits my needs best?
The pricing options vary based on user requirements and access needs. Individual users may opt for single-user licenses, while businesses requiring broader access may choose multi-user or enterprise licenses for cost-effective access to the report.
13. Are there any additional resources or data provided in the Electronic Goods Packaging Boxes report?
While the report offers comprehensive insights, it's advisable to review the specific contents or supplementary materials provided to ascertain if additional resources or data are available.
14. How can I stay updated on further developments or reports in the Electronic Goods Packaging Boxes?
To stay informed about further developments, trends, and reports in the Electronic Goods Packaging Boxes, consider subscribing to industry newsletters, following relevant companies and organizations, or regularly checking reputable industry news sources and publications.
Methodology
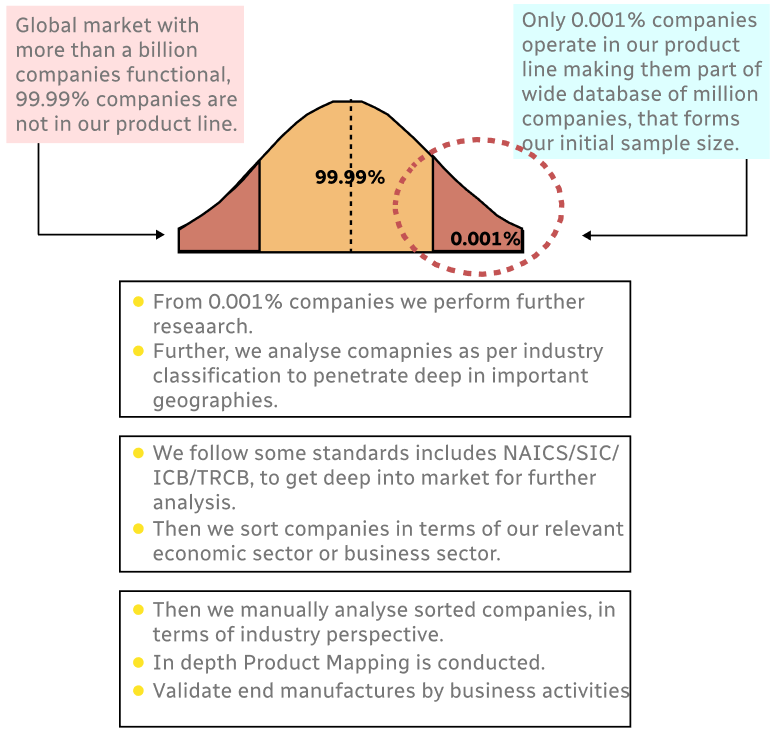
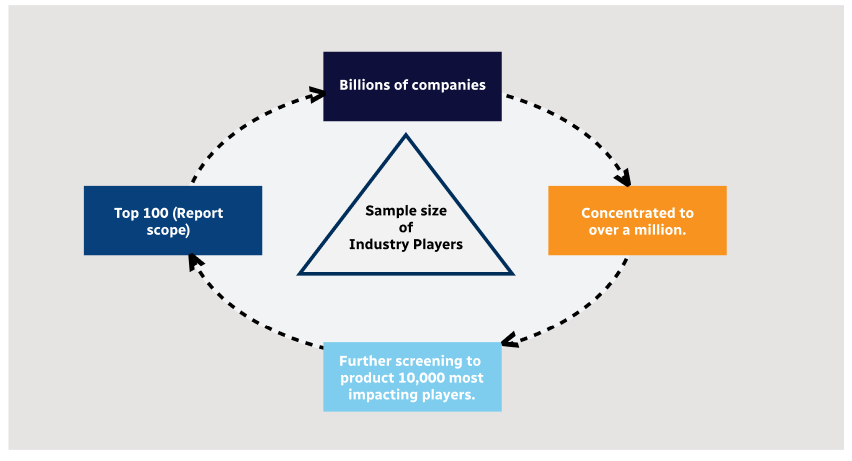
Step 1 - Identification of Relevant Samples Size from Population Database
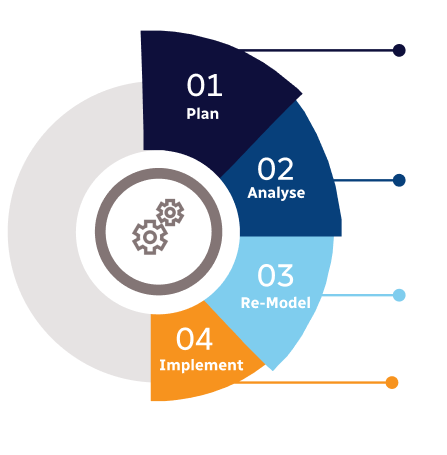
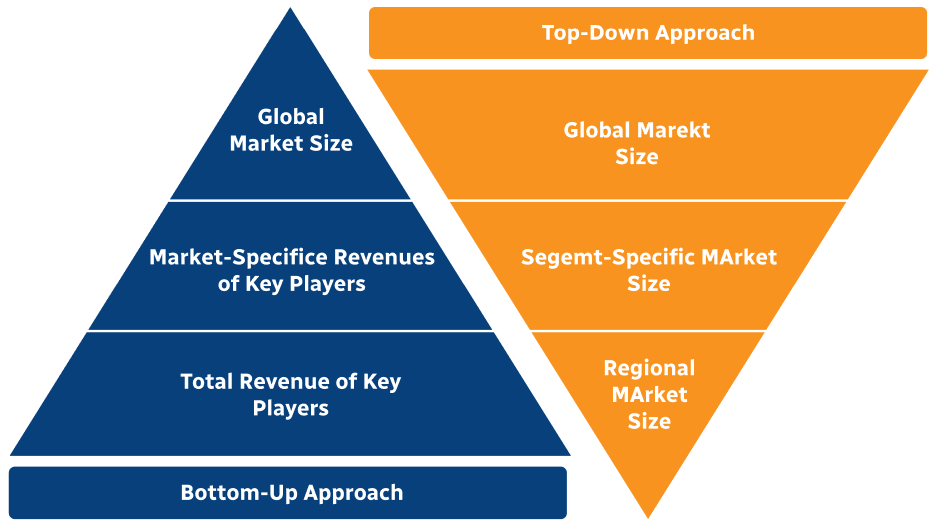
Step 2 - Approaches for Defining Global Market Size (Value, Volume* & Price*)
Note*: In applicable scenarios
Step 3 - Data Sources
Primary Research
- Web Analytics
- Survey Reports
- Research Institute
- Latest Research Reports
- Opinion Leaders
Secondary Research
- Annual Reports
- White Paper
- Latest Press Release
- Industry Association
- Paid Database
- Investor Presentations
Step 4 - Data Triangulation
Involves using different sources of information in order to increase the validity of a study
These sources are likely to be stakeholders in a program - participants, other researchers, program staff, other community members, and so on.
Then we put all data in single framework & apply various statistical tools to find out the dynamic on the market.
During the analysis stage, feedback from the stakeholder groups would be compared to determine areas of agreement as well as areas of divergence