

Key Insights
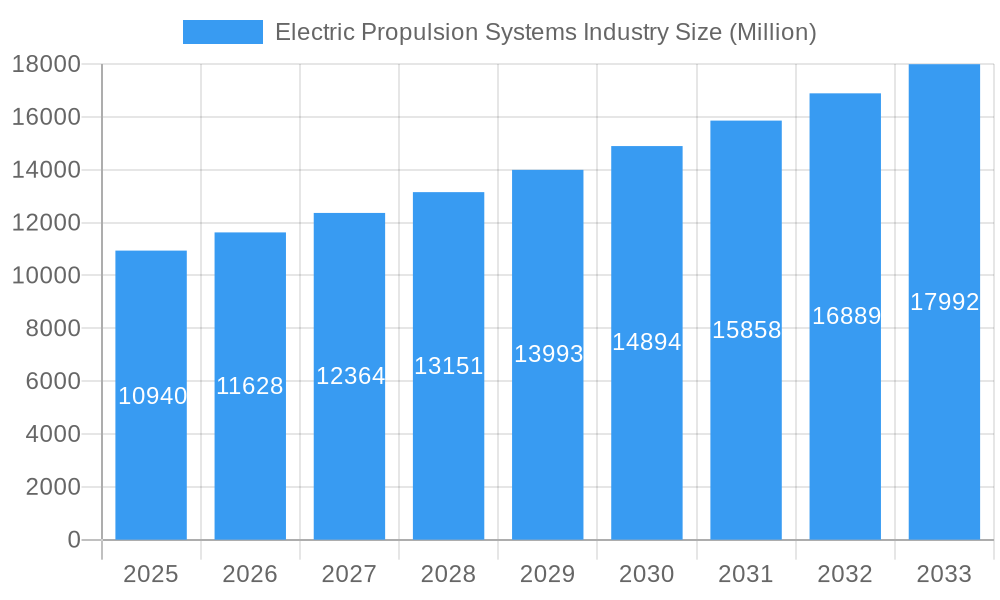
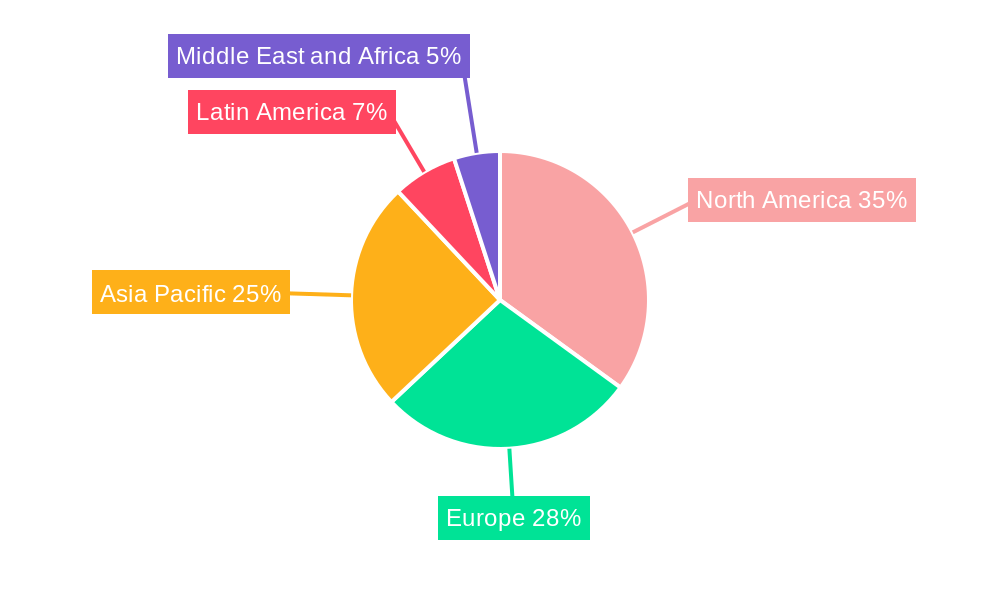
The Electric Propulsion Systems (EPS) market is experiencing robust growth, projected to reach a market size of $10.94 billion in 2025 and maintain a Compound Annual Growth Rate (CAGR) of 6.09% from 2025 to 2033. This expansion is fueled by several key drivers. The increasing demand for fuel-efficient and environmentally friendly transportation solutions across various sectors—airborne, terrestrial, marine, and space—is a major catalyst. Government regulations aimed at reducing carbon emissions are further incentivizing the adoption of EPS technology. Technological advancements leading to improved battery life, higher power density, and reduced costs are making EPS more competitive against traditional propulsion systems. The market is segmented by type (hybrid and full-electric) and application (airborne, terrestrial, marine, and space), reflecting the diverse range of applications for this technology. Competition is intense, with major players like Airbus SE, Safran SA, and Northrop Grumman Corporation, alongside innovative startups like Accion Systems Inc., vying for market share. The North American market currently holds a significant share, driven by robust aerospace and defense sectors, but the Asia-Pacific region is anticipated to witness substantial growth in the coming years, fueled by rapid industrialization and investment in electric vehicle infrastructure.
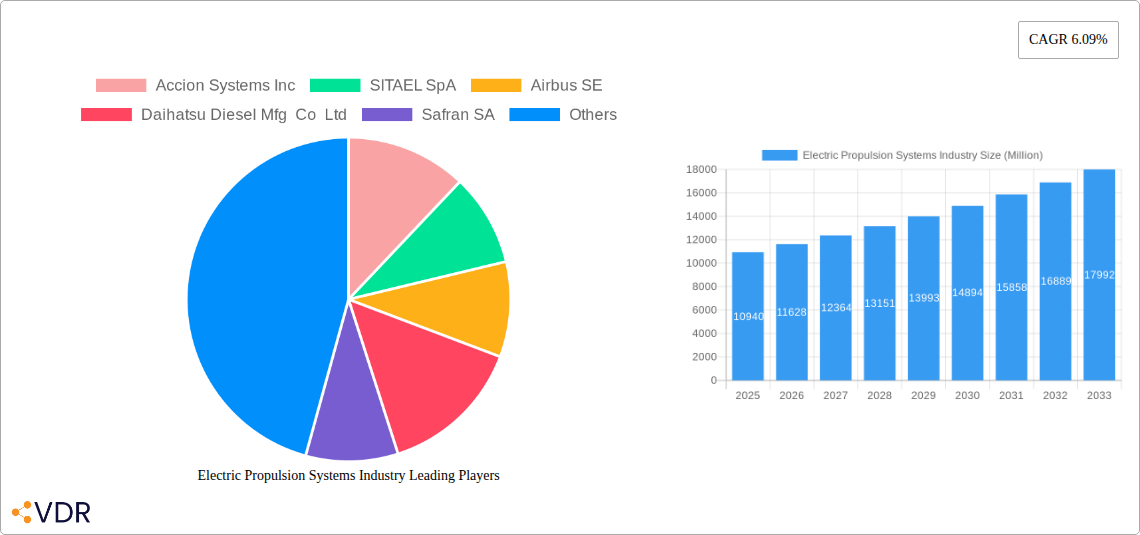
Electric Propulsion Systems Industry Market Size (In Billion)
The forecast period (2025-2033) promises continued expansion, with the market expected to surpass $18 billion by 2033. This growth trajectory is contingent on several factors, including sustained technological innovation, favorable government policies, and the successful integration of EPS into various industries. However, challenges remain, primarily related to the high initial investment costs associated with EPS technology and the need for improved charging infrastructure to support widespread adoption. Furthermore, the development and standardization of safety protocols for electric propulsion systems will be crucial for sustained market growth. Addressing these challenges will be key for unlocking the full potential of the EPS market and achieving widespread adoption across various sectors.
Electric Propulsion Systems Industry Company Market Share
Electric Propulsion Systems Industry Market Report: 2019-2033
This comprehensive report provides an in-depth analysis of the Electric Propulsion Systems industry, encompassing market dynamics, growth trends, regional dominance, product landscape, challenges, opportunities, and key players. The study period covers 2019-2033, with a base year of 2025 and a forecast period of 2025-2033. The report utilizes data from the historical period (2019-2024) and incorporates expert insights to deliver a robust and actionable market forecast. The total market size is projected to reach xx Million units by 2033.
Electric Propulsion Systems Industry Market Dynamics & Structure
The electric propulsion systems market is characterized by a dynamic and evolving landscape, marked by moderate concentration with several dominant players holding substantial market shares. A primary engine of growth is relentless technological innovation, particularly in enhancing power density, improving efficiency, and reducing the overall weight of systems. This is complemented by an increasingly stringent global regulatory framework aimed at reducing emissions across various sectors. While competition from established traditional propulsion systems remains a factor, the undeniable surge in demand for sustainable, environmentally friendly, and cost-effective solutions is steadily tilting the scales in favor of electric propulsion. The industry also experiences a notable trend of strategic mergers and acquisitions (M&A), reflecting a concerted effort by leading companies to consolidate their market positions, expand their technological capabilities, and broaden their geographical reach.
- Market Concentration: The market exhibits moderate concentration, with an estimated dominance by the top 5 players who collectively held approximately [Insert Estimated XX%] of the market share in 2025.
- Technological Innovation: A relentless focus on increasing power density, achieving lighter designs, and maximizing operational efficiency is paramount. These advancements are largely propelled by breakthroughs in cutting-edge battery technologies, sophisticated power electronics, and advanced materials science.
- Regulatory Framework: Stringent and evolving emission standards across key sectors such as aerospace, marine, and terrestrial applications are acting as a significant catalyst, accelerating the adoption and development of electric propulsion systems.
- Competitive Substitutes: Traditional internal combustion engines and hydraulic systems still present competitive challenges. However, the compelling long-term cost advantages, reduced environmental impact, and superior performance characteristics of electric systems are gradually reshaping the competitive landscape.
- End-User Demographics: The market is experiencing robust expansion driven by burgeoning demand from a diverse array of sectors, including aerospace (e.g., eVTOLs, hybrid-electric aircraft), marine (e.g., electric ferries, hybrid-electric vessels), and automotive (e.g., electric vehicles, heavy-duty trucks).
- M&A Trends: The industry has witnessed a consistent pattern of consolidation and expansion, with an average of [Insert Estimated XX] M&A deals annually over the past five years, underscoring strategic growth initiatives by major industry stakeholders.
Electric Propulsion Systems Industry Growth Trends & Insights
The electric propulsion systems market is on a trajectory of significant and sustained growth, primarily fueled by the escalating global demand for energy-efficient and environmentally responsible solutions across a multitude of applications. The market demonstrated a robust Compound Annual Growth Rate (CAGR) of [Insert Estimated XX%] during the historical period spanning from 2019 to 2024. Projections indicate a continuation of this impressive expansion, with an anticipated CAGR of [Insert Estimated XX%] forecast for the period between 2025 and 2033, leading to an estimated market size of [Insert Estimated XX] Million units by the end of 2033. This remarkable growth is underpinned by several key factors: continuous technological advancements, supportive government policies and incentives that champion electric mobility, and a growing global awareness among consumers regarding the critical importance of environmental sustainability. Market penetration is rapidly increasing across various segments, with particularly strong adoption observed in the airborne and marine sectors. Technological disruptions, especially in the realm of advanced battery technology and high-performance power electronics, are serving as further accelerators for the market's expansion. Shifting consumer preferences, influenced by increasing environmental consciousness and the promise of long-term cost savings, are also playing a pivotal role in shaping the market's strong and positive growth trajectory.
Dominant Regions, Countries, or Segments in Electric Propulsion Systems Industry
The North American region currently holds a significant market share in the electric propulsion systems industry, driven by strong government support for electric vehicle adoption and significant investments in research and development. Within the segments, the airborne and space applications demonstrate the highest growth potential, with the full-electric type witnessing faster adoption compared to hybrid systems.
- Leading Region: North America (Market Share: xx% in 2025). Key drivers include strong government incentives, a well-established aerospace industry, and robust R&D investments.
- Leading Country: United States (Market Share: xx% within North America in 2025).
- Leading Segment (By Type): Full-electric systems are experiencing faster adoption due to continuous improvements in battery technology and efficiency.
- Leading Segment (By Application): The airborne segment leads in terms of market value and growth, fueled by the increasing demand for electric aircraft and unmanned aerial vehicles.
Electric Propulsion Systems Industry Product Landscape
The electric propulsion systems market presents a comprehensive and diverse array of products meticulously engineered to address the specific requirements of various applications. The forefront of innovation is dedicated to enhancing the power-to-weight ratio, optimizing operational efficiency, and bolstering overall system reliability. Key features defining these advanced systems include state-of-the-art power electronics for precise control, high-energy-density battery solutions for extended range and performance, and sophisticated control algorithms for seamless operation. Manufacturers are also prioritizing the development of systems that offer superior durability and require minimal maintenance, thereby significantly increasing their value proposition to end-users. The unique selling propositions (USPs) that differentiate products in this competitive market often include the ability to deliver customized solutions tailored to specific needs, the offering of seamlessly integrated system designs for optimal performance, and the incorporation of advanced diagnostic capabilities for proactive maintenance and troubleshooting.
Key Drivers, Barriers & Challenges in Electric Propulsion Systems Industry
Key Drivers: Government regulations promoting emission reduction, increasing demand for electric vehicles across sectors, advancements in battery technology and power electronics, and cost reductions in electric propulsion systems.
Key Challenges: High initial costs compared to traditional systems, limited battery range and charging infrastructure, concerns about battery safety and lifespan, and competition from established propulsion technology providers. Supply chain disruptions related to battery materials and components also pose significant challenges, impacting production volumes and delivery timelines.
Emerging Opportunities in Electric Propulsion Systems Industry
Significant emerging opportunities abound within the electric propulsion systems industry, particularly in the development and deployment of these systems for nascent and rapidly growing applications. These include the electrification of aviation, with advancements in electric and hybrid-electric aircraft (including eVTOLs), the burgeoning field of autonomous vehicles that rely heavily on precise and efficient electric propulsion, and the increasing use of electric propulsion in small satellites for orbital maneuvering and station-keeping. Expansion into emerging economies and developing markets, characterized by substantial infrastructure development and a growing appetite for sustainable technologies, presents a considerable growth potential. Further breakthroughs in battery technology, with a special focus on the development of next-generation solid-state batteries, hold the promise of revolutionizing the sector by effectively addressing critical challenges such as range anxiety and enhancing safety parameters. The strategic integration of electric propulsion systems with renewable energy sources, such as solar and wind power, is also opening up novel avenues for truly sustainable transportation and distributed power generation solutions.
Growth Accelerators in the Electric Propulsion Systems Industry Industry
Technological advancements in power electronics and battery technology are key growth catalysts. Strategic partnerships between electric propulsion system manufacturers and automotive or aerospace companies will accelerate market adoption. Expansion into new markets such as developing economies and exploring new applications such as electric marine vessels will contribute to long-term growth.
Key Players Shaping the Electric Propulsion Systems Industry Market
- Accion Systems Inc
- SITAEL SpA
- Airbus SE
- Daihatsu Diesel Mfg Co Ltd
- Safran SA
- Aerojet Rocketdyne Holdings Inc
- Orbital ATK (Northrop Grumman Corporation)
- Efficient Drivetrains Inc (Cummins Inc)
- Collins Aerospace (RTX Corporation)
- Busek Co Inc
- Thales Alenia Space
- General Electric Company
- The Boeing Company
Notable Milestones in Electric Propulsion Systems Industry Sector
- 2020: Accion Systems Inc. secures significant funding for the development of its next-generation electric propulsion systems.
- 2021: Airbus SE announces a major investment in electric aircraft propulsion technology.
- 2022: Safran SA launches a new line of high-efficiency electric motors for various applications.
- 2023: Several key players announce strategic partnerships to accelerate market adoption.
In-Depth Electric Propulsion Systems Industry Market Outlook
The electric propulsion systems market is confidently positioned for substantial and transformative growth in the coming years. This optimistic outlook is primarily propelled by a confluence of factors: groundbreaking technological advancements, an ever-increasing global imperative for sustainable transportation and cleaner power generation, and the proactive implementation of supportive government policies and regulatory frameworks worldwide. Strategic partnerships, collaborations, and focused market expansion initiatives are expected to play a pivotal role in shaping the future trajectory and competitive dynamics of this vibrant and rapidly evolving industry. The continuous pursuit of improvements in battery technology, the relentless drive to enhance overall system efficiency, and a concerted effort to reduce the cost of electric propulsion solutions will be crucial in accelerating their widespread adoption and fostering deeper market penetration across a broad spectrum of diverse applications. The electric propulsion systems market represents a landscape rich with opportunities for pioneering innovation and strategic investment, poised to deliver a profound and lasting transformative impact across numerous industrial sectors in the foreseeable future.
Electric Propulsion Systems Industry Segmentation
- 1. Production Analysis
- 2. Consumption Analysis
- 3. Import Market Analysis (Value & Volume)
- 4. Export Market Analysis (Value & Volume)
- 5. Price Trend Analysis
Electric Propulsion Systems Industry Segmentation By Geography
-
1. North America
- 1.1. United States
- 1.2. Canada
- 1.3. Mexico
-
2. South America
- 2.1. Brazil
- 2.2. Argentina
- 2.3. Rest of South America
-
3. Europe
- 3.1. United Kingdom
- 3.2. Germany
- 3.3. France
- 3.4. Italy
- 3.5. Spain
- 3.6. Russia
- 3.7. Benelux
- 3.8. Nordics
- 3.9. Rest of Europe
-
4. Middle East & Africa
- 4.1. Turkey
- 4.2. Israel
- 4.3. GCC
- 4.4. North Africa
- 4.5. South Africa
- 4.6. Rest of Middle East & Africa
-
5. Asia Pacific
- 5.1. China
- 5.2. India
- 5.3. Japan
- 5.4. South Korea
- 5.5. ASEAN
- 5.6. Oceania
- 5.7. Rest of Asia Pacific
Electric Propulsion Systems Industry Regional Market Share
Geographic Coverage of Electric Propulsion Systems Industry
Electric Propulsion Systems Industry REPORT HIGHLIGHTS
| Aspects | Details |
|---|---|
| Study Period | 2020-2034 |
| Base Year | 2025 |
| Estimated Year | 2026 |
| Forecast Period | 2026-2034 |
| Historical Period | 2020-2025 |
| Growth Rate | CAGR of 6.09% from 2020-2034 |
| Segmentation |
|
Table of Contents
- 1. Introduction
- 1.1. Research Scope
- 1.2. Market Segmentation
- 1.3. Research Objective
- 1.4. Definitions and Assumptions
- 2. Executive Summary
- 2.1. Market Snapshot
- 3. Market Dynamics
- 3.1. Market Drivers
- 3.2. Market Restrains
- 3.3. Market Trends
- 3.4. Market Opportunities
- 4. Market Factor Analysis
- 4.1. Porters Five Forces
- 4.1.1. Bargaining Power of Suppliers
- 4.1.2. Bargaining Power of Buyers
- 4.1.3. Threat of New Entrants
- 4.1.4. Threat of Substitutes
- 4.1.5. Competitive Rivalry
- 4.2. PESTEL analysis
- 4.3. BCG Analysis
- 4.3.1. Stars (High Growth, High Market Share)
- 4.3.2. Cash Cows (Low Growth, High Market Share)
- 4.3.3. Question Mark (High Growth, Low Market Share)
- 4.3.4. Dogs (Low Growth, Low Market Share)
- 4.4. Ansoff Matrix Analysis
- 4.5. Supply Chain Analysis
- 4.6. Regulatory Landscape
- 4.7. Current Market Potential and Opportunity Assessment (TAM–SAM–SOM Framework)
- 4.8. VDR Analyst Note
- 4.1. Porters Five Forces
- 5. Market Analysis, Insights and Forecast 2021-2033
- 5.1. Market Analysis, Insights and Forecast - by Production Analysis
- 5.2. Market Analysis, Insights and Forecast - by Consumption Analysis
- 5.3. Market Analysis, Insights and Forecast - by Import Market Analysis (Value & Volume)
- 5.4. Market Analysis, Insights and Forecast - by Export Market Analysis (Value & Volume)
- 5.5. Market Analysis, Insights and Forecast - by Price Trend Analysis
- 5.6. Market Analysis, Insights and Forecast - by Region
- 5.6.1. North America
- 5.6.2. South America
- 5.6.3. Europe
- 5.6.4. Middle East & Africa
- 5.6.5. Asia Pacific
- 6. Global Electric Propulsion Systems Industry Analysis, Insights and Forecast, 2021-2033
- 6.1. Market Analysis, Insights and Forecast - by Production Analysis
- 6.2. Market Analysis, Insights and Forecast - by Consumption Analysis
- 6.3. Market Analysis, Insights and Forecast - by Import Market Analysis (Value & Volume)
- 6.4. Market Analysis, Insights and Forecast - by Export Market Analysis (Value & Volume)
- 6.5. Market Analysis, Insights and Forecast - by Price Trend Analysis
- 7. North America Electric Propulsion Systems Industry Analysis, Insights and Forecast, 2021-2033
- 7.1. Market Analysis, Insights and Forecast - by Production Analysis
- 7.2. Market Analysis, Insights and Forecast - by Consumption Analysis
- 7.3. Market Analysis, Insights and Forecast - by Import Market Analysis (Value & Volume)
- 7.4. Market Analysis, Insights and Forecast - by Export Market Analysis (Value & Volume)
- 7.5. Market Analysis, Insights and Forecast - by Price Trend Analysis
- 8. South America Electric Propulsion Systems Industry Analysis, Insights and Forecast, 2021-2033
- 8.1. Market Analysis, Insights and Forecast - by Production Analysis
- 8.2. Market Analysis, Insights and Forecast - by Consumption Analysis
- 8.3. Market Analysis, Insights and Forecast - by Import Market Analysis (Value & Volume)
- 8.4. Market Analysis, Insights and Forecast - by Export Market Analysis (Value & Volume)
- 8.5. Market Analysis, Insights and Forecast - by Price Trend Analysis
- 9. Europe Electric Propulsion Systems Industry Analysis, Insights and Forecast, 2021-2033
- 9.1. Market Analysis, Insights and Forecast - by Production Analysis
- 9.2. Market Analysis, Insights and Forecast - by Consumption Analysis
- 9.3. Market Analysis, Insights and Forecast - by Import Market Analysis (Value & Volume)
- 9.4. Market Analysis, Insights and Forecast - by Export Market Analysis (Value & Volume)
- 9.5. Market Analysis, Insights and Forecast - by Price Trend Analysis
- 10. Middle East & Africa Electric Propulsion Systems Industry Analysis, Insights and Forecast, 2021-2033
- 10.1. Market Analysis, Insights and Forecast - by Production Analysis
- 10.2. Market Analysis, Insights and Forecast - by Consumption Analysis
- 10.3. Market Analysis, Insights and Forecast - by Import Market Analysis (Value & Volume)
- 10.4. Market Analysis, Insights and Forecast - by Export Market Analysis (Value & Volume)
- 10.5. Market Analysis, Insights and Forecast - by Price Trend Analysis
- 11. Asia Pacific Electric Propulsion Systems Industry Analysis, Insights and Forecast, 2021-2033
- 11.1. Market Analysis, Insights and Forecast - by Production Analysis
- 11.2. Market Analysis, Insights and Forecast - by Consumption Analysis
- 11.3. Market Analysis, Insights and Forecast - by Import Market Analysis (Value & Volume)
- 11.4. Market Analysis, Insights and Forecast - by Export Market Analysis (Value & Volume)
- 11.5. Market Analysis, Insights and Forecast - by Price Trend Analysis
- 12. Competitive Analysis
- 12.1. Company Profiles
- 12.1.1 Accion Systems Inc
- 12.1.1.1. Company Overview
- 12.1.1.2. Products
- 12.1.1.3. Company Financials
- 12.1.1.4. SWOT Analysis
- 12.1.2 SITAEL SpA
- 12.1.2.1. Company Overview
- 12.1.2.2. Products
- 12.1.2.3. Company Financials
- 12.1.2.4. SWOT Analysis
- 12.1.3 Airbus SE
- 12.1.3.1. Company Overview
- 12.1.3.2. Products
- 12.1.3.3. Company Financials
- 12.1.3.4. SWOT Analysis
- 12.1.4 Daihatsu Diesel Mfg Co Ltd
- 12.1.4.1. Company Overview
- 12.1.4.2. Products
- 12.1.4.3. Company Financials
- 12.1.4.4. SWOT Analysis
- 12.1.5 Safran SA
- 12.1.5.1. Company Overview
- 12.1.5.2. Products
- 12.1.5.3. Company Financials
- 12.1.5.4. SWOT Analysis
- 12.1.6 Aerojet Rocketdyne Holdings Inc
- 12.1.6.1. Company Overview
- 12.1.6.2. Products
- 12.1.6.3. Company Financials
- 12.1.6.4. SWOT Analysis
- 12.1.7 Orbital ATK (Northrop Grumman Corporation)
- 12.1.7.1. Company Overview
- 12.1.7.2. Products
- 12.1.7.3. Company Financials
- 12.1.7.4. SWOT Analysis
- 12.1.8 Efficient Drivetrains Inc (Cummins Inc )
- 12.1.8.1. Company Overview
- 12.1.8.2. Products
- 12.1.8.3. Company Financials
- 12.1.8.4. SWOT Analysis
- 12.1.9 Collins Aerospace (RTX Corporation
- 12.1.9.1. Company Overview
- 12.1.9.2. Products
- 12.1.9.3. Company Financials
- 12.1.9.4. SWOT Analysis
- 12.1.10 Busek Co Inc
- 12.1.10.1. Company Overview
- 12.1.10.2. Products
- 12.1.10.3. Company Financials
- 12.1.10.4. SWOT Analysis
- 12.1.11 Thales Alenia Space
- 12.1.11.1. Company Overview
- 12.1.11.2. Products
- 12.1.11.3. Company Financials
- 12.1.11.4. SWOT Analysis
- 12.1.12 General Electric Company
- 12.1.12.1. Company Overview
- 12.1.12.2. Products
- 12.1.12.3. Company Financials
- 12.1.12.4. SWOT Analysis
- 12.1.13 The Boeing Company
- 12.1.13.1. Company Overview
- 12.1.13.2. Products
- 12.1.13.3. Company Financials
- 12.1.13.4. SWOT Analysis
- 12.1.1 Accion Systems Inc
- 12.2. Market Entropy
- 12.2.1 Company's Key Areas Served
- 12.2.2 Recent Developments
- 12.3. Company Market Share Analysis 2025
- 12.3.1 Top 5 Companies Market Share Analysis
- 12.3.2 Top 3 Companies Market Share Analysis
- 12.4. List of Potential Customers
- 13. Research Methodology
List of Figures
- Figure 1: Global Electric Propulsion Systems Industry Revenue Breakdown (Million, %) by Region 2025 & 2033
- Figure 2: North America Electric Propulsion Systems Industry Revenue (Million), by Production Analysis 2025 & 2033
- Figure 3: North America Electric Propulsion Systems Industry Revenue Share (%), by Production Analysis 2025 & 2033
- Figure 4: North America Electric Propulsion Systems Industry Revenue (Million), by Consumption Analysis 2025 & 2033
- Figure 5: North America Electric Propulsion Systems Industry Revenue Share (%), by Consumption Analysis 2025 & 2033
- Figure 6: North America Electric Propulsion Systems Industry Revenue (Million), by Import Market Analysis (Value & Volume) 2025 & 2033
- Figure 7: North America Electric Propulsion Systems Industry Revenue Share (%), by Import Market Analysis (Value & Volume) 2025 & 2033
- Figure 8: North America Electric Propulsion Systems Industry Revenue (Million), by Export Market Analysis (Value & Volume) 2025 & 2033
- Figure 9: North America Electric Propulsion Systems Industry Revenue Share (%), by Export Market Analysis (Value & Volume) 2025 & 2033
- Figure 10: North America Electric Propulsion Systems Industry Revenue (Million), by Price Trend Analysis 2025 & 2033
- Figure 11: North America Electric Propulsion Systems Industry Revenue Share (%), by Price Trend Analysis 2025 & 2033
- Figure 12: North America Electric Propulsion Systems Industry Revenue (Million), by Country 2025 & 2033
- Figure 13: North America Electric Propulsion Systems Industry Revenue Share (%), by Country 2025 & 2033
- Figure 14: South America Electric Propulsion Systems Industry Revenue (Million), by Production Analysis 2025 & 2033
- Figure 15: South America Electric Propulsion Systems Industry Revenue Share (%), by Production Analysis 2025 & 2033
- Figure 16: South America Electric Propulsion Systems Industry Revenue (Million), by Consumption Analysis 2025 & 2033
- Figure 17: South America Electric Propulsion Systems Industry Revenue Share (%), by Consumption Analysis 2025 & 2033
- Figure 18: South America Electric Propulsion Systems Industry Revenue (Million), by Import Market Analysis (Value & Volume) 2025 & 2033
- Figure 19: South America Electric Propulsion Systems Industry Revenue Share (%), by Import Market Analysis (Value & Volume) 2025 & 2033
- Figure 20: South America Electric Propulsion Systems Industry Revenue (Million), by Export Market Analysis (Value & Volume) 2025 & 2033
- Figure 21: South America Electric Propulsion Systems Industry Revenue Share (%), by Export Market Analysis (Value & Volume) 2025 & 2033
- Figure 22: South America Electric Propulsion Systems Industry Revenue (Million), by Price Trend Analysis 2025 & 2033
- Figure 23: South America Electric Propulsion Systems Industry Revenue Share (%), by Price Trend Analysis 2025 & 2033
- Figure 24: South America Electric Propulsion Systems Industry Revenue (Million), by Country 2025 & 2033
- Figure 25: South America Electric Propulsion Systems Industry Revenue Share (%), by Country 2025 & 2033
- Figure 26: Europe Electric Propulsion Systems Industry Revenue (Million), by Production Analysis 2025 & 2033
- Figure 27: Europe Electric Propulsion Systems Industry Revenue Share (%), by Production Analysis 2025 & 2033
- Figure 28: Europe Electric Propulsion Systems Industry Revenue (Million), by Consumption Analysis 2025 & 2033
- Figure 29: Europe Electric Propulsion Systems Industry Revenue Share (%), by Consumption Analysis 2025 & 2033
- Figure 30: Europe Electric Propulsion Systems Industry Revenue (Million), by Import Market Analysis (Value & Volume) 2025 & 2033
- Figure 31: Europe Electric Propulsion Systems Industry Revenue Share (%), by Import Market Analysis (Value & Volume) 2025 & 2033
- Figure 32: Europe Electric Propulsion Systems Industry Revenue (Million), by Export Market Analysis (Value & Volume) 2025 & 2033
- Figure 33: Europe Electric Propulsion Systems Industry Revenue Share (%), by Export Market Analysis (Value & Volume) 2025 & 2033
- Figure 34: Europe Electric Propulsion Systems Industry Revenue (Million), by Price Trend Analysis 2025 & 2033
- Figure 35: Europe Electric Propulsion Systems Industry Revenue Share (%), by Price Trend Analysis 2025 & 2033
- Figure 36: Europe Electric Propulsion Systems Industry Revenue (Million), by Country 2025 & 2033
- Figure 37: Europe Electric Propulsion Systems Industry Revenue Share (%), by Country 2025 & 2033
- Figure 38: Middle East & Africa Electric Propulsion Systems Industry Revenue (Million), by Production Analysis 2025 & 2033
- Figure 39: Middle East & Africa Electric Propulsion Systems Industry Revenue Share (%), by Production Analysis 2025 & 2033
- Figure 40: Middle East & Africa Electric Propulsion Systems Industry Revenue (Million), by Consumption Analysis 2025 & 2033
- Figure 41: Middle East & Africa Electric Propulsion Systems Industry Revenue Share (%), by Consumption Analysis 2025 & 2033
- Figure 42: Middle East & Africa Electric Propulsion Systems Industry Revenue (Million), by Import Market Analysis (Value & Volume) 2025 & 2033
- Figure 43: Middle East & Africa Electric Propulsion Systems Industry Revenue Share (%), by Import Market Analysis (Value & Volume) 2025 & 2033
- Figure 44: Middle East & Africa Electric Propulsion Systems Industry Revenue (Million), by Export Market Analysis (Value & Volume) 2025 & 2033
- Figure 45: Middle East & Africa Electric Propulsion Systems Industry Revenue Share (%), by Export Market Analysis (Value & Volume) 2025 & 2033
- Figure 46: Middle East & Africa Electric Propulsion Systems Industry Revenue (Million), by Price Trend Analysis 2025 & 2033
- Figure 47: Middle East & Africa Electric Propulsion Systems Industry Revenue Share (%), by Price Trend Analysis 2025 & 2033
- Figure 48: Middle East & Africa Electric Propulsion Systems Industry Revenue (Million), by Country 2025 & 2033
- Figure 49: Middle East & Africa Electric Propulsion Systems Industry Revenue Share (%), by Country 2025 & 2033
- Figure 50: Asia Pacific Electric Propulsion Systems Industry Revenue (Million), by Production Analysis 2025 & 2033
- Figure 51: Asia Pacific Electric Propulsion Systems Industry Revenue Share (%), by Production Analysis 2025 & 2033
- Figure 52: Asia Pacific Electric Propulsion Systems Industry Revenue (Million), by Consumption Analysis 2025 & 2033
- Figure 53: Asia Pacific Electric Propulsion Systems Industry Revenue Share (%), by Consumption Analysis 2025 & 2033
- Figure 54: Asia Pacific Electric Propulsion Systems Industry Revenue (Million), by Import Market Analysis (Value & Volume) 2025 & 2033
- Figure 55: Asia Pacific Electric Propulsion Systems Industry Revenue Share (%), by Import Market Analysis (Value & Volume) 2025 & 2033
- Figure 56: Asia Pacific Electric Propulsion Systems Industry Revenue (Million), by Export Market Analysis (Value & Volume) 2025 & 2033
- Figure 57: Asia Pacific Electric Propulsion Systems Industry Revenue Share (%), by Export Market Analysis (Value & Volume) 2025 & 2033
- Figure 58: Asia Pacific Electric Propulsion Systems Industry Revenue (Million), by Price Trend Analysis 2025 & 2033
- Figure 59: Asia Pacific Electric Propulsion Systems Industry Revenue Share (%), by Price Trend Analysis 2025 & 2033
- Figure 60: Asia Pacific Electric Propulsion Systems Industry Revenue (Million), by Country 2025 & 2033
- Figure 61: Asia Pacific Electric Propulsion Systems Industry Revenue Share (%), by Country 2025 & 2033
List of Tables
- Table 1: Global Electric Propulsion Systems Industry Revenue Million Forecast, by Production Analysis 2020 & 2033
- Table 2: Global Electric Propulsion Systems Industry Revenue Million Forecast, by Consumption Analysis 2020 & 2033
- Table 3: Global Electric Propulsion Systems Industry Revenue Million Forecast, by Import Market Analysis (Value & Volume) 2020 & 2033
- Table 4: Global Electric Propulsion Systems Industry Revenue Million Forecast, by Export Market Analysis (Value & Volume) 2020 & 2033
- Table 5: Global Electric Propulsion Systems Industry Revenue Million Forecast, by Price Trend Analysis 2020 & 2033
- Table 6: Global Electric Propulsion Systems Industry Revenue Million Forecast, by Region 2020 & 2033
- Table 7: Global Electric Propulsion Systems Industry Revenue Million Forecast, by Production Analysis 2020 & 2033
- Table 8: Global Electric Propulsion Systems Industry Revenue Million Forecast, by Consumption Analysis 2020 & 2033
- Table 9: Global Electric Propulsion Systems Industry Revenue Million Forecast, by Import Market Analysis (Value & Volume) 2020 & 2033
- Table 10: Global Electric Propulsion Systems Industry Revenue Million Forecast, by Export Market Analysis (Value & Volume) 2020 & 2033
- Table 11: Global Electric Propulsion Systems Industry Revenue Million Forecast, by Price Trend Analysis 2020 & 2033
- Table 12: Global Electric Propulsion Systems Industry Revenue Million Forecast, by Country 2020 & 2033
- Table 13: United States Electric Propulsion Systems Industry Revenue (Million) Forecast, by Application 2020 & 2033
- Table 14: Canada Electric Propulsion Systems Industry Revenue (Million) Forecast, by Application 2020 & 2033
- Table 15: Mexico Electric Propulsion Systems Industry Revenue (Million) Forecast, by Application 2020 & 2033
- Table 16: Global Electric Propulsion Systems Industry Revenue Million Forecast, by Production Analysis 2020 & 2033
- Table 17: Global Electric Propulsion Systems Industry Revenue Million Forecast, by Consumption Analysis 2020 & 2033
- Table 18: Global Electric Propulsion Systems Industry Revenue Million Forecast, by Import Market Analysis (Value & Volume) 2020 & 2033
- Table 19: Global Electric Propulsion Systems Industry Revenue Million Forecast, by Export Market Analysis (Value & Volume) 2020 & 2033
- Table 20: Global Electric Propulsion Systems Industry Revenue Million Forecast, by Price Trend Analysis 2020 & 2033
- Table 21: Global Electric Propulsion Systems Industry Revenue Million Forecast, by Country 2020 & 2033
- Table 22: Brazil Electric Propulsion Systems Industry Revenue (Million) Forecast, by Application 2020 & 2033
- Table 23: Argentina Electric Propulsion Systems Industry Revenue (Million) Forecast, by Application 2020 & 2033
- Table 24: Rest of South America Electric Propulsion Systems Industry Revenue (Million) Forecast, by Application 2020 & 2033
- Table 25: Global Electric Propulsion Systems Industry Revenue Million Forecast, by Production Analysis 2020 & 2033
- Table 26: Global Electric Propulsion Systems Industry Revenue Million Forecast, by Consumption Analysis 2020 & 2033
- Table 27: Global Electric Propulsion Systems Industry Revenue Million Forecast, by Import Market Analysis (Value & Volume) 2020 & 2033
- Table 28: Global Electric Propulsion Systems Industry Revenue Million Forecast, by Export Market Analysis (Value & Volume) 2020 & 2033
- Table 29: Global Electric Propulsion Systems Industry Revenue Million Forecast, by Price Trend Analysis 2020 & 2033
- Table 30: Global Electric Propulsion Systems Industry Revenue Million Forecast, by Country 2020 & 2033
- Table 31: United Kingdom Electric Propulsion Systems Industry Revenue (Million) Forecast, by Application 2020 & 2033
- Table 32: Germany Electric Propulsion Systems Industry Revenue (Million) Forecast, by Application 2020 & 2033
- Table 33: France Electric Propulsion Systems Industry Revenue (Million) Forecast, by Application 2020 & 2033
- Table 34: Italy Electric Propulsion Systems Industry Revenue (Million) Forecast, by Application 2020 & 2033
- Table 35: Spain Electric Propulsion Systems Industry Revenue (Million) Forecast, by Application 2020 & 2033
- Table 36: Russia Electric Propulsion Systems Industry Revenue (Million) Forecast, by Application 2020 & 2033
- Table 37: Benelux Electric Propulsion Systems Industry Revenue (Million) Forecast, by Application 2020 & 2033
- Table 38: Nordics Electric Propulsion Systems Industry Revenue (Million) Forecast, by Application 2020 & 2033
- Table 39: Rest of Europe Electric Propulsion Systems Industry Revenue (Million) Forecast, by Application 2020 & 2033
- Table 40: Global Electric Propulsion Systems Industry Revenue Million Forecast, by Production Analysis 2020 & 2033
- Table 41: Global Electric Propulsion Systems Industry Revenue Million Forecast, by Consumption Analysis 2020 & 2033
- Table 42: Global Electric Propulsion Systems Industry Revenue Million Forecast, by Import Market Analysis (Value & Volume) 2020 & 2033
- Table 43: Global Electric Propulsion Systems Industry Revenue Million Forecast, by Export Market Analysis (Value & Volume) 2020 & 2033
- Table 44: Global Electric Propulsion Systems Industry Revenue Million Forecast, by Price Trend Analysis 2020 & 2033
- Table 45: Global Electric Propulsion Systems Industry Revenue Million Forecast, by Country 2020 & 2033
- Table 46: Turkey Electric Propulsion Systems Industry Revenue (Million) Forecast, by Application 2020 & 2033
- Table 47: Israel Electric Propulsion Systems Industry Revenue (Million) Forecast, by Application 2020 & 2033
- Table 48: GCC Electric Propulsion Systems Industry Revenue (Million) Forecast, by Application 2020 & 2033
- Table 49: North Africa Electric Propulsion Systems Industry Revenue (Million) Forecast, by Application 2020 & 2033
- Table 50: South Africa Electric Propulsion Systems Industry Revenue (Million) Forecast, by Application 2020 & 2033
- Table 51: Rest of Middle East & Africa Electric Propulsion Systems Industry Revenue (Million) Forecast, by Application 2020 & 2033
- Table 52: Global Electric Propulsion Systems Industry Revenue Million Forecast, by Production Analysis 2020 & 2033
- Table 53: Global Electric Propulsion Systems Industry Revenue Million Forecast, by Consumption Analysis 2020 & 2033
- Table 54: Global Electric Propulsion Systems Industry Revenue Million Forecast, by Import Market Analysis (Value & Volume) 2020 & 2033
- Table 55: Global Electric Propulsion Systems Industry Revenue Million Forecast, by Export Market Analysis (Value & Volume) 2020 & 2033
- Table 56: Global Electric Propulsion Systems Industry Revenue Million Forecast, by Price Trend Analysis 2020 & 2033
- Table 57: Global Electric Propulsion Systems Industry Revenue Million Forecast, by Country 2020 & 2033
- Table 58: China Electric Propulsion Systems Industry Revenue (Million) Forecast, by Application 2020 & 2033
- Table 59: India Electric Propulsion Systems Industry Revenue (Million) Forecast, by Application 2020 & 2033
- Table 60: Japan Electric Propulsion Systems Industry Revenue (Million) Forecast, by Application 2020 & 2033
- Table 61: South Korea Electric Propulsion Systems Industry Revenue (Million) Forecast, by Application 2020 & 2033
- Table 62: ASEAN Electric Propulsion Systems Industry Revenue (Million) Forecast, by Application 2020 & 2033
- Table 63: Oceania Electric Propulsion Systems Industry Revenue (Million) Forecast, by Application 2020 & 2033
- Table 64: Rest of Asia Pacific Electric Propulsion Systems Industry Revenue (Million) Forecast, by Application 2020 & 2033
Frequently Asked Questions
1. What is the projected Compound Annual Growth Rate (CAGR) of the Electric Propulsion Systems Industry?
The projected CAGR is approximately 6.09%.
2. Which companies are prominent players in the Electric Propulsion Systems Industry?
Key companies in the market include Accion Systems Inc, SITAEL SpA, Airbus SE, Daihatsu Diesel Mfg Co Ltd, Safran SA, Aerojet Rocketdyne Holdings Inc, Orbital ATK (Northrop Grumman Corporation), Efficient Drivetrains Inc (Cummins Inc ), Collins Aerospace (RTX Corporation, Busek Co Inc, Thales Alenia Space, General Electric Company, The Boeing Company.
3. What are the main segments of the Electric Propulsion Systems Industry?
The market segments include Production Analysis, Consumption Analysis, Import Market Analysis (Value & Volume), Export Market Analysis (Value & Volume), Price Trend Analysis.
4. Can you provide details about the market size?
The market size is estimated to be USD 10.94 Million as of 2022.
5. What are some drivers contributing to market growth?
; Increased Seaborne Threats And Ambiguous Maritime Security Policies; Increasing Adoption Of Security Technologies In Bric Countries.
6. What are the notable trends driving market growth?
Space Segment Envisioned to Experience Highest Growth During the Forecast Period.
7. Are there any restraints impacting market growth?
; High Risk Rate In Ungoverned Zones; Unstructured Security Standards And Technologies.
8. Can you provide examples of recent developments in the market?
N/A
9. What pricing options are available for accessing the report?
Pricing options include single-user, multi-user, and enterprise licenses priced at USD 4750, USD 5250, and USD 8750 respectively.
10. Is the market size provided in terms of value or volume?
The market size is provided in terms of value, measured in Million.
11. Are there any specific market keywords associated with the report?
Yes, the market keyword associated with the report is "Electric Propulsion Systems Industry," which aids in identifying and referencing the specific market segment covered.
12. How do I determine which pricing option suits my needs best?
The pricing options vary based on user requirements and access needs. Individual users may opt for single-user licenses, while businesses requiring broader access may choose multi-user or enterprise licenses for cost-effective access to the report.
13. Are there any additional resources or data provided in the Electric Propulsion Systems Industry report?
While the report offers comprehensive insights, it's advisable to review the specific contents or supplementary materials provided to ascertain if additional resources or data are available.
14. How can I stay updated on further developments or reports in the Electric Propulsion Systems Industry?
To stay informed about further developments, trends, and reports in the Electric Propulsion Systems Industry, consider subscribing to industry newsletters, following relevant companies and organizations, or regularly checking reputable industry news sources and publications.
Methodology
Step 1 - Identification of Relevant Samples Size from Population Database


Step 2 - Approaches for Defining Global Market Size (Value, Volume* & Price*)

Note*: In applicable scenarios
Step 3 - Data Sources
Primary Research
- Web Analytics
- Survey Reports
- Research Institute
- Latest Research Reports
- Opinion Leaders
Secondary Research
- Annual Reports
- White Paper
- Latest Press Release
- Industry Association
- Paid Database
- Investor Presentations

Step 4 - Data Triangulation
Involves using different sources of information in order to increase the validity of a study
These sources are likely to be stakeholders in a program - participants, other researchers, program staff, other community members, and so on.
Then we put all data in single framework & apply various statistical tools to find out the dynamic on the market.
During the analysis stage, feedback from the stakeholder groups would be compared to determine areas of agreement as well as areas of divergence