

Key Insights
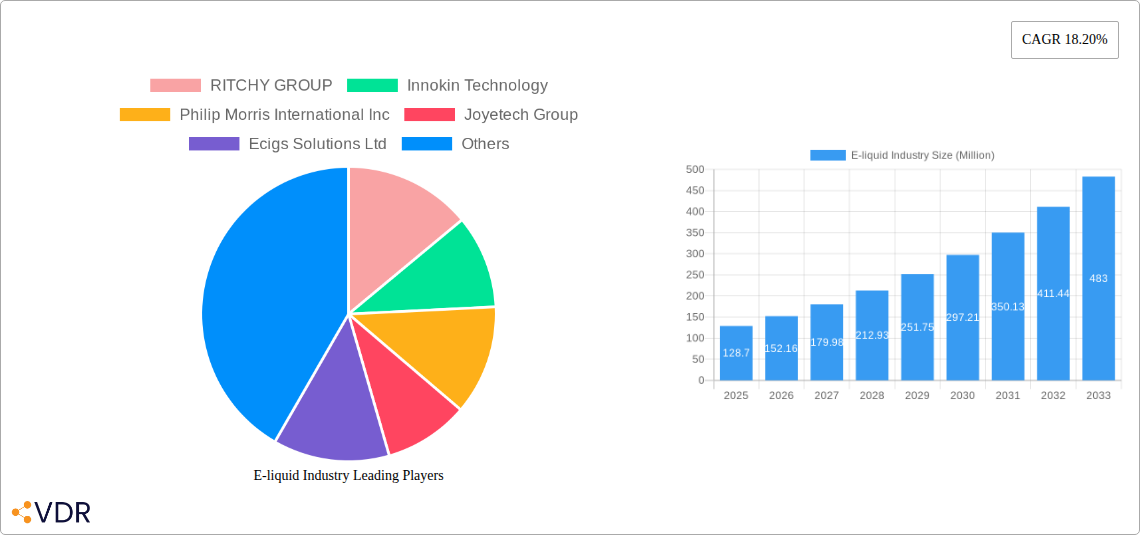
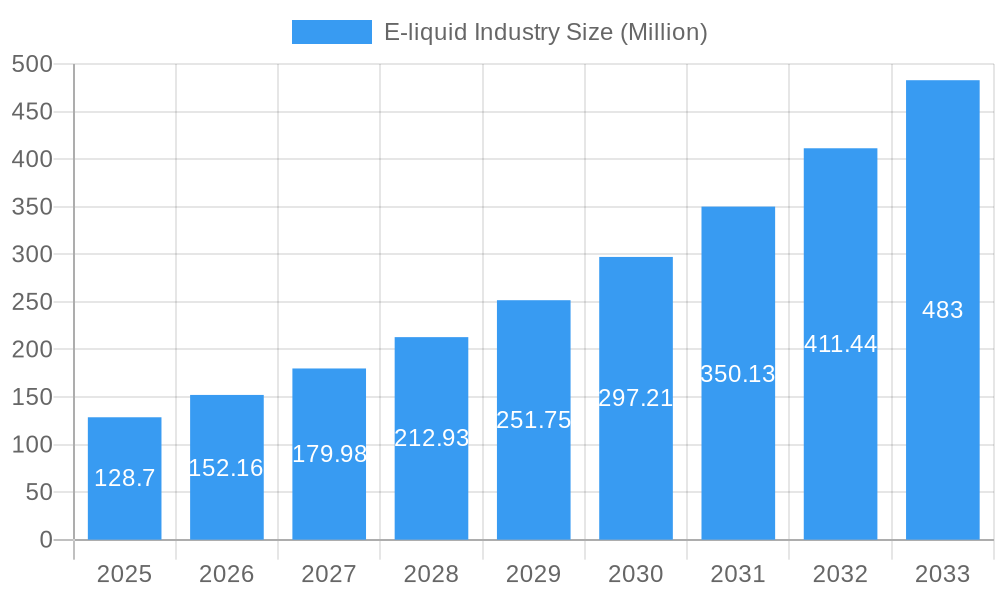
The e-liquid market, valued at $128.70 million in 2025, is projected to experience robust growth, driven by the increasing popularity of vaping and e-cigarettes as alternatives to traditional smoking. This growth is further fueled by continuous innovation in product development, with manufacturers focusing on diverse flavors, nicotine strengths, and device compatibility. The online distribution channel is witnessing significant expansion, facilitated by e-commerce platforms and targeted digital marketing campaigns, complementing the established offline retail presence. However, the market faces challenges including stringent regulations aimed at curbing youth vaping, evolving consumer preferences, and concerns surrounding the long-term health effects of e-cigarette use. These regulatory hurdles and health concerns necessitate ongoing adaptation and innovation within the industry, demanding a focus on responsible marketing and transparent product information.
E-liquid Industry Market Size (In Million)
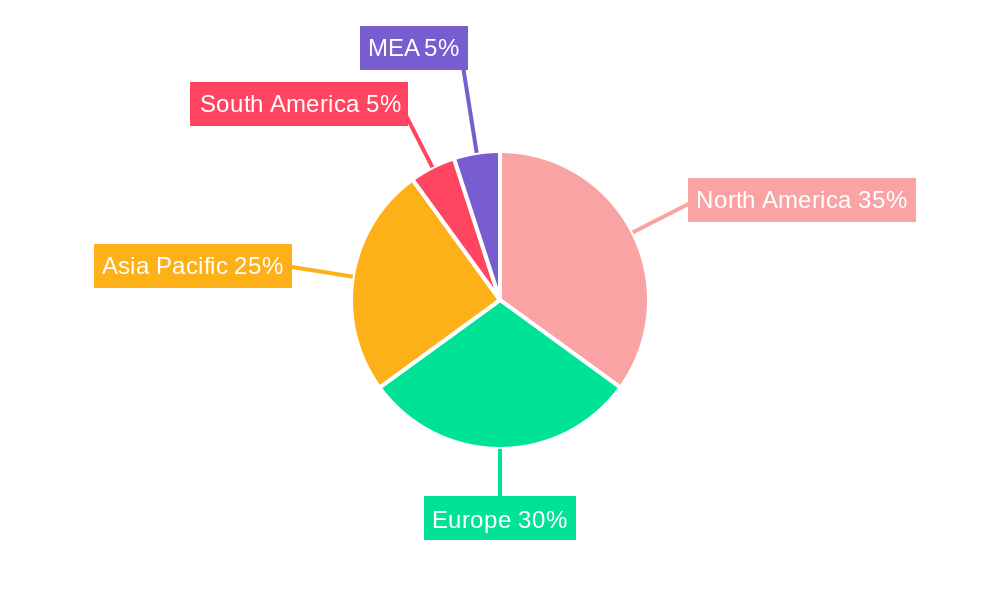
Despite these headwinds, the market's compound annual growth rate (CAGR) of 18.20% from 2025 to 2033 indicates a sustained expansion. This positive outlook is largely driven by the growing adult vaping population seeking harm reduction strategies and a preference for customizable vaping experiences. Regional variations are anticipated, with North America and Europe maintaining significant market shares due to established consumer bases and robust regulatory frameworks (though these frameworks are also a source of restraint). Asia Pacific is poised for substantial growth, reflecting increasing disposable incomes and a rising adoption rate of vaping products in key markets like China and Southeast Asia. The competitive landscape is characterized by both established multinational tobacco companies and smaller specialized e-liquid manufacturers, resulting in a dynamic market with intense competition and continuous innovation.
E-liquid Industry Company Market Share
This comprehensive report provides a detailed analysis of the e-liquid industry, encompassing market dynamics, growth trends, regional dominance, product landscape, challenges, opportunities, and key players. The report covers the period 2019-2033, with a focus on the forecast period 2025-2033 and a base year of 2025. The analysis includes both parent markets (e.g., vaping products) and child markets (e-liquids, e-cigarette devices) for a complete understanding of this evolving industry. This report is crucial for investors, manufacturers, distributors, and regulatory bodies seeking to navigate the complexities of this dynamic market. Market values are presented in million units.
E-liquid Industry Market Dynamics & Structure
The e-liquid market exhibits a moderately concentrated structure, with key players such as RITCHY GROUP, Innokin Technology, Philip Morris International Inc, and Joyetech Group holding significant market share. The industry is characterized by rapid technological innovation, driving the development of new e-liquid flavors, nicotine delivery systems, and device designs. However, innovation is constrained by stringent regulatory frameworks that vary significantly across regions. The market faces competition from traditional tobacco products and alternative nicotine delivery systems. End-user demographics are shifting, with a growing segment of younger adults adopting vaping products. The M&A landscape has seen a moderate level of activity, with larger players consolidating their market positions and expanding their product portfolios. xx% of M&A deals in the last 5 years involved companies in the e-liquid supply chain.
- Market Concentration: Moderately concentrated, with top 5 players holding xx% market share (2024).
- Technological Innovation: Rapid advancements in flavor technology, nicotine delivery, and device design. Key barrier: regulatory hurdles.
- Regulatory Frameworks: Highly variable across regions, impacting product availability and marketing.
- Competitive Substitutes: Traditional cigarettes, nicotine pouches, and other alternative nicotine products.
- End-User Demographics: Shifting towards younger adult demographics, with evolving preferences for flavors and devices.
- M&A Trends: Moderate activity, driven by consolidation and expansion strategies.
E-liquid Industry Growth Trends & Insights
The global e-liquid market experienced significant growth during the historical period (2019-2024), driven by increasing awareness of vaping as a potential alternative to smoking. The market size expanded from xx million units in 2019 to xx million units in 2024, achieving a CAGR of xx%. The adoption rate is expected to continue growing during the forecast period, albeit at a slower pace due to increased regulation. Technological disruptions, such as the introduction of new nicotine salts and pod-based systems, have significantly impacted consumer behavior. Consumers are increasingly demanding higher-quality e-liquids with diverse flavors and customized nicotine strengths. The market penetration is expected to reach xx% by 2033, driven by increasing acceptance and expanding availability of vaping products.
Dominant Regions, Countries, or Segments in E-liquid Industry
The North American and European markets currently dominate the e-liquid industry, contributing xx% and xx% of the global market share respectively in 2024. Within product types, e-cigarette devices hold a larger market share compared to e-liquid devices, reflecting the intertwined nature of the product categories. The online channel dominates the distribution landscape, providing wider reach and convenience to consumers. However, the offline channel maintains significant market presence, particularly for premium brands and specialized retail outlets.
- North America: High consumer adoption, strong regulatory scrutiny.
- Europe: Varying regulations across countries, significant market size.
- Asia-Pacific: High growth potential, but regulatory uncertainty.
- E-cigarette Devices: Dominant segment due to dependence on devices for usage.
- Online Channel: Higher market share due to ease of access and broader reach.
E-liquid Industry Product Landscape
E-liquid products are characterized by a wide range of flavors, nicotine strengths, and base ingredients. Recent innovations focus on enhancing flavor profiles, developing safer and more efficient nicotine delivery systems (e.g., nicotine salts), and incorporating natural and organic ingredients. Product differentiation is key in a competitive market. Performance metrics, such as vapor production, throat hit, and flavor intensity, are crucial factors influencing consumer preferences. Unique selling propositions often include proprietary flavor blends and advanced device integration.
Key Drivers, Barriers & Challenges in E-liquid Industry
Key Drivers:
- Increasing consumer demand for harm reduction alternatives to traditional cigarettes.
- Technological advancements leading to improved product quality and safety.
- Growing acceptance of vaping among specific consumer segments.
Challenges & Restraints:
- Stringent regulatory frameworks and changing policies hindering market expansion.
- Supply chain disruptions impacting product availability and pricing.
- Intense competition from established tobacco companies and emerging players.
- Growing public health concerns related to vaping.
Emerging Opportunities in E-liquid Industry
Emerging opportunities include expansion into untapped markets, particularly in developing economies; development of novel nicotine delivery systems that reduce health risks; and increased focus on customization, with personalized e-liquids catering to individual preferences. Innovation in product formulation, packaging, and delivery will be crucial to maintaining market competitiveness.
Growth Accelerators in the E-liquid Industry Industry
Technological breakthroughs in nicotine delivery, innovative flavor development, and strategic partnerships between device manufacturers and e-liquid producers are key growth catalysts. Strategic market expansion into new regions with less restrictive regulations, coupled with targeted marketing campaigns, are poised to fuel long-term growth.
Key Players Shaping the E-liquid Industry Market
- RITCHY GROUP
- Innokin Technology
- Philip Morris International Inc
- Joyetech Group
- Ecigs Solutions Ltd
- Intellicig Inc
- Aspire
- KangerTech
- British American Tobacco
- VIP Electronic Cigarettes
Notable Milestones in E-liquid Industry Sector
- September 2019: The Emirates Government Consumer Supervision Agency and the Emirates Standardization and Measurement Authority (ESMA) confirmed new regulations for electronic cigarettes in Dubai.
- November 2019: The Dubai Department of Economic Development (DED) introduced 'Electronic cigarettes & accessories trading' as a legal activity.
- April 2022: RELX International lauded the Egyptian authorities' decision to legalize e-cigarette imports and commercialization.
In-Depth E-liquid Industry Market Outlook
The e-liquid market is expected to experience continued growth in the coming years, fueled by technological advancements, expanding consumer base, and strategic market expansion. Opportunities exist in product diversification, personalized offerings, and targeted marketing to specific consumer demographics. Navigating the evolving regulatory landscape and addressing potential health concerns will remain key challenges for industry participants. Companies with robust innovation capabilities, strong supply chains, and flexible marketing strategies are best positioned to thrive in this dynamic market.
E-liquid Industry Segmentation
-
1. Product Type
- 1.1. E-cigarette Devices
- 1.2. E-liquid Devices
-
2. Distribution Channel
- 2.1. Offline Channel
- 2.2. Online Channel
-
3. Geography
- 3.1. South Africa
- 3.2. Nigeria
- 3.3. Kenya
- 3.4. Ghana
- 3.5. United Arab Emirates
- 3.6. Egypt
- 3.7. Rest of Middle East & Africa
E-liquid Industry Segmentation By Geography
- 1. South Africa
- 2. Nigeria
- 3. Kenya
- 4. Ghana
- 5. United Arab Emirates
- 6. Egypt
- 7. Rest of Middle East
E-liquid Industry Regional Market Share
Geographic Coverage of E-liquid Industry
E-liquid Industry REPORT HIGHLIGHTS
| Aspects | Details |
|---|---|
| Study Period | 2020-2034 |
| Base Year | 2025 |
| Estimated Year | 2026 |
| Forecast Period | 2026-2034 |
| Historical Period | 2020-2025 |
| Growth Rate | CAGR of 18.20% from 2020-2034 |
| Segmentation |
|
Table of Contents
- 1. Introduction
- 1.1. Research Scope
- 1.2. Market Segmentation
- 1.3. Research Objective
- 1.4. Definitions and Assumptions
- 2. Executive Summary
- 2.1. Market Snapshot
- 3. Market Dynamics
- 3.1. Market Drivers
- 3.2. Market Restrains
- 3.3. Market Trends
- 3.4. Market Opportunities
- 4. Market Factor Analysis
- 4.1. Porters Five Forces
- 4.1.1. Bargaining Power of Suppliers
- 4.1.2. Bargaining Power of Buyers
- 4.1.3. Threat of New Entrants
- 4.1.4. Threat of Substitutes
- 4.1.5. Competitive Rivalry
- 4.2. PESTEL analysis
- 4.3. BCG Analysis
- 4.3.1. Stars (High Growth, High Market Share)
- 4.3.2. Cash Cows (Low Growth, High Market Share)
- 4.3.3. Question Mark (High Growth, Low Market Share)
- 4.3.4. Dogs (Low Growth, Low Market Share)
- 4.4. Ansoff Matrix Analysis
- 4.5. Supply Chain Analysis
- 4.6. Regulatory Landscape
- 4.7. Current Market Potential and Opportunity Assessment (TAM–SAM–SOM Framework)
- 4.8. VDR Analyst Note
- 4.1. Porters Five Forces
- 5. Market Analysis, Insights and Forecast 2021-2033
- 5.1. Market Analysis, Insights and Forecast - by Product Type
- 5.1.1. E-cigarette Devices
- 5.1.2. E-liquid Devices
- 5.2. Market Analysis, Insights and Forecast - by Distribution Channel
- 5.2.1. Offline Channel
- 5.2.2. Online Channel
- 5.3. Market Analysis, Insights and Forecast - by Geography
- 5.3.1. South Africa
- 5.3.2. Nigeria
- 5.3.3. Kenya
- 5.3.4. Ghana
- 5.3.5. United Arab Emirates
- 5.3.6. Egypt
- 5.3.7. Rest of Middle East & Africa
- 5.4. Market Analysis, Insights and Forecast - by Region
- 5.4.1. South Africa
- 5.4.2. Nigeria
- 5.4.3. Kenya
- 5.4.4. Ghana
- 5.4.5. United Arab Emirates
- 5.4.6. Egypt
- 5.4.7. Rest of Middle East
- 5.1. Market Analysis, Insights and Forecast - by Product Type
- 6. Global E-liquid Industry Analysis, Insights and Forecast, 2021-2033
- 6.1. Market Analysis, Insights and Forecast - by Product Type
- 6.1.1. E-cigarette Devices
- 6.1.2. E-liquid Devices
- 6.2. Market Analysis, Insights and Forecast - by Distribution Channel
- 6.2.1. Offline Channel
- 6.2.2. Online Channel
- 6.3. Market Analysis, Insights and Forecast - by Geography
- 6.3.1. South Africa
- 6.3.2. Nigeria
- 6.3.3. Kenya
- 6.3.4. Ghana
- 6.3.5. United Arab Emirates
- 6.3.6. Egypt
- 6.3.7. Rest of Middle East & Africa
- 6.1. Market Analysis, Insights and Forecast - by Product Type
- 7. South Africa E-liquid Industry Analysis, Insights and Forecast, 2021-2033
- 7.1. Market Analysis, Insights and Forecast - by Product Type
- 7.1.1. E-cigarette Devices
- 7.1.2. E-liquid Devices
- 7.2. Market Analysis, Insights and Forecast - by Distribution Channel
- 7.2.1. Offline Channel
- 7.2.2. Online Channel
- 7.3. Market Analysis, Insights and Forecast - by Geography
- 7.3.1. South Africa
- 7.3.2. Nigeria
- 7.3.3. Kenya
- 7.3.4. Ghana
- 7.3.5. United Arab Emirates
- 7.3.6. Egypt
- 7.3.7. Rest of Middle East & Africa
- 7.1. Market Analysis, Insights and Forecast - by Product Type
- 8. Nigeria E-liquid Industry Analysis, Insights and Forecast, 2021-2033
- 8.1. Market Analysis, Insights and Forecast - by Product Type
- 8.1.1. E-cigarette Devices
- 8.1.2. E-liquid Devices
- 8.2. Market Analysis, Insights and Forecast - by Distribution Channel
- 8.2.1. Offline Channel
- 8.2.2. Online Channel
- 8.3. Market Analysis, Insights and Forecast - by Geography
- 8.3.1. South Africa
- 8.3.2. Nigeria
- 8.3.3. Kenya
- 8.3.4. Ghana
- 8.3.5. United Arab Emirates
- 8.3.6. Egypt
- 8.3.7. Rest of Middle East & Africa
- 8.1. Market Analysis, Insights and Forecast - by Product Type
- 9. Kenya E-liquid Industry Analysis, Insights and Forecast, 2021-2033
- 9.1. Market Analysis, Insights and Forecast - by Product Type
- 9.1.1. E-cigarette Devices
- 9.1.2. E-liquid Devices
- 9.2. Market Analysis, Insights and Forecast - by Distribution Channel
- 9.2.1. Offline Channel
- 9.2.2. Online Channel
- 9.3. Market Analysis, Insights and Forecast - by Geography
- 9.3.1. South Africa
- 9.3.2. Nigeria
- 9.3.3. Kenya
- 9.3.4. Ghana
- 9.3.5. United Arab Emirates
- 9.3.6. Egypt
- 9.3.7. Rest of Middle East & Africa
- 9.1. Market Analysis, Insights and Forecast - by Product Type
- 10. Ghana E-liquid Industry Analysis, Insights and Forecast, 2021-2033
- 10.1. Market Analysis, Insights and Forecast - by Product Type
- 10.1.1. E-cigarette Devices
- 10.1.2. E-liquid Devices
- 10.2. Market Analysis, Insights and Forecast - by Distribution Channel
- 10.2.1. Offline Channel
- 10.2.2. Online Channel
- 10.3. Market Analysis, Insights and Forecast - by Geography
- 10.3.1. South Africa
- 10.3.2. Nigeria
- 10.3.3. Kenya
- 10.3.4. Ghana
- 10.3.5. United Arab Emirates
- 10.3.6. Egypt
- 10.3.7. Rest of Middle East & Africa
- 10.1. Market Analysis, Insights and Forecast - by Product Type
- 11. United Arab Emirates E-liquid Industry Analysis, Insights and Forecast, 2021-2033
- 11.1. Market Analysis, Insights and Forecast - by Product Type
- 11.1.1. E-cigarette Devices
- 11.1.2. E-liquid Devices
- 11.2. Market Analysis, Insights and Forecast - by Distribution Channel
- 11.2.1. Offline Channel
- 11.2.2. Online Channel
- 11.3. Market Analysis, Insights and Forecast - by Geography
- 11.3.1. South Africa
- 11.3.2. Nigeria
- 11.3.3. Kenya
- 11.3.4. Ghana
- 11.3.5. United Arab Emirates
- 11.3.6. Egypt
- 11.3.7. Rest of Middle East & Africa
- 11.1. Market Analysis, Insights and Forecast - by Product Type
- 12. Egypt E-liquid Industry Analysis, Insights and Forecast, 2021-2033
- 12.1. Market Analysis, Insights and Forecast - by Product Type
- 12.1.1. E-cigarette Devices
- 12.1.2. E-liquid Devices
- 12.2. Market Analysis, Insights and Forecast - by Distribution Channel
- 12.2.1. Offline Channel
- 12.2.2. Online Channel
- 12.3. Market Analysis, Insights and Forecast - by Geography
- 12.3.1. South Africa
- 12.3.2. Nigeria
- 12.3.3. Kenya
- 12.3.4. Ghana
- 12.3.5. United Arab Emirates
- 12.3.6. Egypt
- 12.3.7. Rest of Middle East & Africa
- 12.1. Market Analysis, Insights and Forecast - by Product Type
- 13. Rest of Middle East E-liquid Industry Analysis, Insights and Forecast, 2021-2033
- 13.1. Market Analysis, Insights and Forecast - by Product Type
- 13.1.1. E-cigarette Devices
- 13.1.2. E-liquid Devices
- 13.2. Market Analysis, Insights and Forecast - by Distribution Channel
- 13.2.1. Offline Channel
- 13.2.2. Online Channel
- 13.3. Market Analysis, Insights and Forecast - by Geography
- 13.3.1. South Africa
- 13.3.2. Nigeria
- 13.3.3. Kenya
- 13.3.4. Ghana
- 13.3.5. United Arab Emirates
- 13.3.6. Egypt
- 13.3.7. Rest of Middle East & Africa
- 13.1. Market Analysis, Insights and Forecast - by Product Type
- 14. Competitive Analysis
- 14.1. Company Profiles
- 14.1.1 RITCHY GROUP
- 14.1.1.1. Company Overview
- 14.1.1.2. Products
- 14.1.1.3. Company Financials
- 14.1.1.4. SWOT Analysis
- 14.1.2 Innokin Technology
- 14.1.2.1. Company Overview
- 14.1.2.2. Products
- 14.1.2.3. Company Financials
- 14.1.2.4. SWOT Analysis
- 14.1.3 Philip Morris International Inc
- 14.1.3.1. Company Overview
- 14.1.3.2. Products
- 14.1.3.3. Company Financials
- 14.1.3.4. SWOT Analysis
- 14.1.4 Joyetech Group
- 14.1.4.1. Company Overview
- 14.1.4.2. Products
- 14.1.4.3. Company Financials
- 14.1.4.4. SWOT Analysis
- 14.1.5 Ecigs Solutions Ltd
- 14.1.5.1. Company Overview
- 14.1.5.2. Products
- 14.1.5.3. Company Financials
- 14.1.5.4. SWOT Analysis
- 14.1.6 Intellicig Inc
- 14.1.6.1. Company Overview
- 14.1.6.2. Products
- 14.1.6.3. Company Financials
- 14.1.6.4. SWOT Analysis
- 14.1.7 Aspire
- 14.1.7.1. Company Overview
- 14.1.7.2. Products
- 14.1.7.3. Company Financials
- 14.1.7.4. SWOT Analysis
- 14.1.8 KangerTech
- 14.1.8.1. Company Overview
- 14.1.8.2. Products
- 14.1.8.3. Company Financials
- 14.1.8.4. SWOT Analysis
- 14.1.9 British American Tobacco
- 14.1.9.1. Company Overview
- 14.1.9.2. Products
- 14.1.9.3. Company Financials
- 14.1.9.4. SWOT Analysis
- 14.1.10 VIP Electronic Cigarettes
- 14.1.10.1. Company Overview
- 14.1.10.2. Products
- 14.1.10.3. Company Financials
- 14.1.10.4. SWOT Analysis
- 14.1.1 RITCHY GROUP
- 14.2. Market Entropy
- 14.2.1 Company's Key Areas Served
- 14.2.2 Recent Developments
- 14.3. Company Market Share Analysis 2025
- 14.3.1 Top 5 Companies Market Share Analysis
- 14.3.2 Top 3 Companies Market Share Analysis
- 14.4. List of Potential Customers
- 15. Research Methodology
List of Figures
- Figure 1: Global E-liquid Industry Revenue Breakdown (Million, %) by Region 2025 & 2033
- Figure 2: South Africa E-liquid Industry Revenue (Million), by Product Type 2025 & 2033
- Figure 3: South Africa E-liquid Industry Revenue Share (%), by Product Type 2025 & 2033
- Figure 4: South Africa E-liquid Industry Revenue (Million), by Distribution Channel 2025 & 2033
- Figure 5: South Africa E-liquid Industry Revenue Share (%), by Distribution Channel 2025 & 2033
- Figure 6: South Africa E-liquid Industry Revenue (Million), by Geography 2025 & 2033
- Figure 7: South Africa E-liquid Industry Revenue Share (%), by Geography 2025 & 2033
- Figure 8: South Africa E-liquid Industry Revenue (Million), by Country 2025 & 2033
- Figure 9: South Africa E-liquid Industry Revenue Share (%), by Country 2025 & 2033
- Figure 10: Nigeria E-liquid Industry Revenue (Million), by Product Type 2025 & 2033
- Figure 11: Nigeria E-liquid Industry Revenue Share (%), by Product Type 2025 & 2033
- Figure 12: Nigeria E-liquid Industry Revenue (Million), by Distribution Channel 2025 & 2033
- Figure 13: Nigeria E-liquid Industry Revenue Share (%), by Distribution Channel 2025 & 2033
- Figure 14: Nigeria E-liquid Industry Revenue (Million), by Geography 2025 & 2033
- Figure 15: Nigeria E-liquid Industry Revenue Share (%), by Geography 2025 & 2033
- Figure 16: Nigeria E-liquid Industry Revenue (Million), by Country 2025 & 2033
- Figure 17: Nigeria E-liquid Industry Revenue Share (%), by Country 2025 & 2033
- Figure 18: Kenya E-liquid Industry Revenue (Million), by Product Type 2025 & 2033
- Figure 19: Kenya E-liquid Industry Revenue Share (%), by Product Type 2025 & 2033
- Figure 20: Kenya E-liquid Industry Revenue (Million), by Distribution Channel 2025 & 2033
- Figure 21: Kenya E-liquid Industry Revenue Share (%), by Distribution Channel 2025 & 2033
- Figure 22: Kenya E-liquid Industry Revenue (Million), by Geography 2025 & 2033
- Figure 23: Kenya E-liquid Industry Revenue Share (%), by Geography 2025 & 2033
- Figure 24: Kenya E-liquid Industry Revenue (Million), by Country 2025 & 2033
- Figure 25: Kenya E-liquid Industry Revenue Share (%), by Country 2025 & 2033
- Figure 26: Ghana E-liquid Industry Revenue (Million), by Product Type 2025 & 2033
- Figure 27: Ghana E-liquid Industry Revenue Share (%), by Product Type 2025 & 2033
- Figure 28: Ghana E-liquid Industry Revenue (Million), by Distribution Channel 2025 & 2033
- Figure 29: Ghana E-liquid Industry Revenue Share (%), by Distribution Channel 2025 & 2033
- Figure 30: Ghana E-liquid Industry Revenue (Million), by Geography 2025 & 2033
- Figure 31: Ghana E-liquid Industry Revenue Share (%), by Geography 2025 & 2033
- Figure 32: Ghana E-liquid Industry Revenue (Million), by Country 2025 & 2033
- Figure 33: Ghana E-liquid Industry Revenue Share (%), by Country 2025 & 2033
- Figure 34: United Arab Emirates E-liquid Industry Revenue (Million), by Product Type 2025 & 2033
- Figure 35: United Arab Emirates E-liquid Industry Revenue Share (%), by Product Type 2025 & 2033
- Figure 36: United Arab Emirates E-liquid Industry Revenue (Million), by Distribution Channel 2025 & 2033
- Figure 37: United Arab Emirates E-liquid Industry Revenue Share (%), by Distribution Channel 2025 & 2033
- Figure 38: United Arab Emirates E-liquid Industry Revenue (Million), by Geography 2025 & 2033
- Figure 39: United Arab Emirates E-liquid Industry Revenue Share (%), by Geography 2025 & 2033
- Figure 40: United Arab Emirates E-liquid Industry Revenue (Million), by Country 2025 & 2033
- Figure 41: United Arab Emirates E-liquid Industry Revenue Share (%), by Country 2025 & 2033
- Figure 42: Egypt E-liquid Industry Revenue (Million), by Product Type 2025 & 2033
- Figure 43: Egypt E-liquid Industry Revenue Share (%), by Product Type 2025 & 2033
- Figure 44: Egypt E-liquid Industry Revenue (Million), by Distribution Channel 2025 & 2033
- Figure 45: Egypt E-liquid Industry Revenue Share (%), by Distribution Channel 2025 & 2033
- Figure 46: Egypt E-liquid Industry Revenue (Million), by Geography 2025 & 2033
- Figure 47: Egypt E-liquid Industry Revenue Share (%), by Geography 2025 & 2033
- Figure 48: Egypt E-liquid Industry Revenue (Million), by Country 2025 & 2033
- Figure 49: Egypt E-liquid Industry Revenue Share (%), by Country 2025 & 2033
- Figure 50: Rest of Middle East E-liquid Industry Revenue (Million), by Product Type 2025 & 2033
- Figure 51: Rest of Middle East E-liquid Industry Revenue Share (%), by Product Type 2025 & 2033
- Figure 52: Rest of Middle East E-liquid Industry Revenue (Million), by Distribution Channel 2025 & 2033
- Figure 53: Rest of Middle East E-liquid Industry Revenue Share (%), by Distribution Channel 2025 & 2033
- Figure 54: Rest of Middle East E-liquid Industry Revenue (Million), by Geography 2025 & 2033
- Figure 55: Rest of Middle East E-liquid Industry Revenue Share (%), by Geography 2025 & 2033
- Figure 56: Rest of Middle East E-liquid Industry Revenue (Million), by Country 2025 & 2033
- Figure 57: Rest of Middle East E-liquid Industry Revenue Share (%), by Country 2025 & 2033
List of Tables
- Table 1: Global E-liquid Industry Revenue Million Forecast, by Product Type 2020 & 2033
- Table 2: Global E-liquid Industry Revenue Million Forecast, by Distribution Channel 2020 & 2033
- Table 3: Global E-liquid Industry Revenue Million Forecast, by Geography 2020 & 2033
- Table 4: Global E-liquid Industry Revenue Million Forecast, by Region 2020 & 2033
- Table 5: Global E-liquid Industry Revenue Million Forecast, by Product Type 2020 & 2033
- Table 6: Global E-liquid Industry Revenue Million Forecast, by Distribution Channel 2020 & 2033
- Table 7: Global E-liquid Industry Revenue Million Forecast, by Geography 2020 & 2033
- Table 8: Global E-liquid Industry Revenue Million Forecast, by Country 2020 & 2033
- Table 9: Global E-liquid Industry Revenue Million Forecast, by Product Type 2020 & 2033
- Table 10: Global E-liquid Industry Revenue Million Forecast, by Distribution Channel 2020 & 2033
- Table 11: Global E-liquid Industry Revenue Million Forecast, by Geography 2020 & 2033
- Table 12: Global E-liquid Industry Revenue Million Forecast, by Country 2020 & 2033
- Table 13: Global E-liquid Industry Revenue Million Forecast, by Product Type 2020 & 2033
- Table 14: Global E-liquid Industry Revenue Million Forecast, by Distribution Channel 2020 & 2033
- Table 15: Global E-liquid Industry Revenue Million Forecast, by Geography 2020 & 2033
- Table 16: Global E-liquid Industry Revenue Million Forecast, by Country 2020 & 2033
- Table 17: Global E-liquid Industry Revenue Million Forecast, by Product Type 2020 & 2033
- Table 18: Global E-liquid Industry Revenue Million Forecast, by Distribution Channel 2020 & 2033
- Table 19: Global E-liquid Industry Revenue Million Forecast, by Geography 2020 & 2033
- Table 20: Global E-liquid Industry Revenue Million Forecast, by Country 2020 & 2033
- Table 21: Global E-liquid Industry Revenue Million Forecast, by Product Type 2020 & 2033
- Table 22: Global E-liquid Industry Revenue Million Forecast, by Distribution Channel 2020 & 2033
- Table 23: Global E-liquid Industry Revenue Million Forecast, by Geography 2020 & 2033
- Table 24: Global E-liquid Industry Revenue Million Forecast, by Country 2020 & 2033
- Table 25: Global E-liquid Industry Revenue Million Forecast, by Product Type 2020 & 2033
- Table 26: Global E-liquid Industry Revenue Million Forecast, by Distribution Channel 2020 & 2033
- Table 27: Global E-liquid Industry Revenue Million Forecast, by Geography 2020 & 2033
- Table 28: Global E-liquid Industry Revenue Million Forecast, by Country 2020 & 2033
- Table 29: Global E-liquid Industry Revenue Million Forecast, by Product Type 2020 & 2033
- Table 30: Global E-liquid Industry Revenue Million Forecast, by Distribution Channel 2020 & 2033
- Table 31: Global E-liquid Industry Revenue Million Forecast, by Geography 2020 & 2033
- Table 32: Global E-liquid Industry Revenue Million Forecast, by Country 2020 & 2033
Frequently Asked Questions
1. What is the projected Compound Annual Growth Rate (CAGR) of the E-liquid Industry?
The projected CAGR is approximately 18.20%.
2. Which companies are prominent players in the E-liquid Industry?
Key companies in the market include RITCHY GROUP, Innokin Technology, Philip Morris International Inc, Joyetech Group, Ecigs Solutions Ltd, Intellicig Inc, Aspire, KangerTech, British American Tobacco, VIP Electronic Cigarettes.
3. What are the main segments of the E-liquid Industry?
The market segments include Product Type, Distribution Channel, Geography.
4. Can you provide details about the market size?
The market size is estimated to be USD 128.70 Million as of 2022.
5. What are some drivers contributing to market growth?
Aggressive Social Media Marketing; Lower-risk Factor Associated with the Use of E-Cigarettes Compared to Conventional/Combustible Cigarettes.
6. What are the notable trends driving market growth?
Penetration of E-cigarettes in Organized Retail.
7. Are there any restraints impacting market growth?
Government Initiatives to Ban Disposable E-Cigarettes.
8. Can you provide examples of recent developments in the market?
In April 2022, RELX International, a multinational electronic cigarettes company, lauds the recent decision by Egyptian authorities to allow the legal import and commercialization of e-cigarette products in the country. The lifting of the ban highlights the Egyptian authorities' progressive approach to e-cigarettes. It sets the stage for creating a regulated market rich with business opportunities by serving the demand for easily accessible, quality products by legal age (adult) consumers across the country.
9. What pricing options are available for accessing the report?
Pricing options include single-user, multi-user, and enterprise licenses priced at USD 4750, USD 5250, and USD 8750 respectively.
10. Is the market size provided in terms of value or volume?
The market size is provided in terms of value, measured in Million.
11. Are there any specific market keywords associated with the report?
Yes, the market keyword associated with the report is "E-liquid Industry," which aids in identifying and referencing the specific market segment covered.
12. How do I determine which pricing option suits my needs best?
The pricing options vary based on user requirements and access needs. Individual users may opt for single-user licenses, while businesses requiring broader access may choose multi-user or enterprise licenses for cost-effective access to the report.
13. Are there any additional resources or data provided in the E-liquid Industry report?
While the report offers comprehensive insights, it's advisable to review the specific contents or supplementary materials provided to ascertain if additional resources or data are available.
14. How can I stay updated on further developments or reports in the E-liquid Industry?
To stay informed about further developments, trends, and reports in the E-liquid Industry, consider subscribing to industry newsletters, following relevant companies and organizations, or regularly checking reputable industry news sources and publications.
Methodology
Step 1 - Identification of Relevant Samples Size from Population Database


Step 2 - Approaches for Defining Global Market Size (Value, Volume* & Price*)

Note*: In applicable scenarios
Step 3 - Data Sources
Primary Research
- Web Analytics
- Survey Reports
- Research Institute
- Latest Research Reports
- Opinion Leaders
Secondary Research
- Annual Reports
- White Paper
- Latest Press Release
- Industry Association
- Paid Database
- Investor Presentations

Step 4 - Data Triangulation
Involves using different sources of information in order to increase the validity of a study
These sources are likely to be stakeholders in a program - participants, other researchers, program staff, other community members, and so on.
Then we put all data in single framework & apply various statistical tools to find out the dynamic on the market.
During the analysis stage, feedback from the stakeholder groups would be compared to determine areas of agreement as well as areas of divergence