

Key Insights
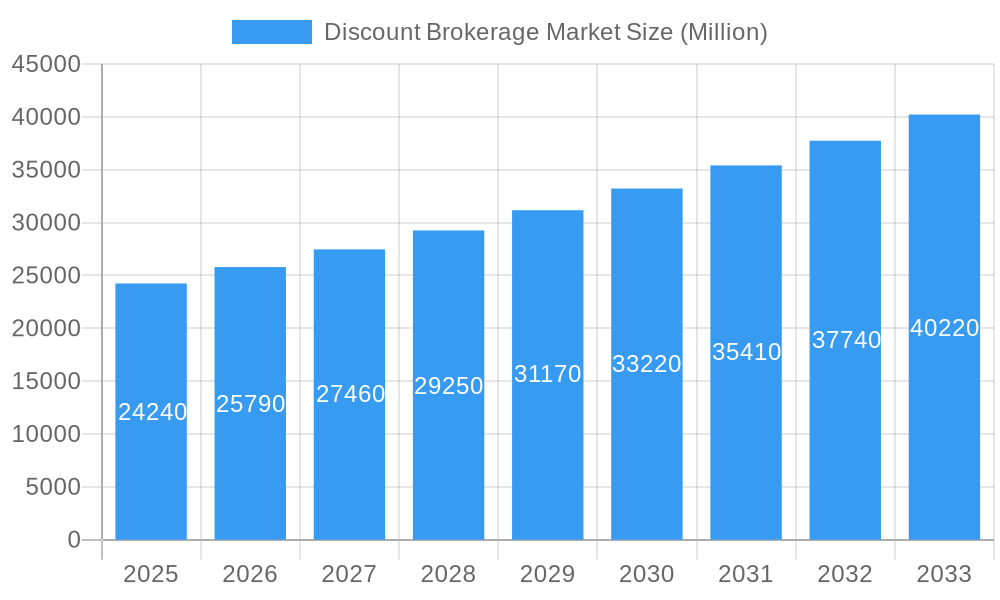
The discount brokerage market, valued at $24.24 billion in 2025, is projected to experience robust growth, driven by increasing digital adoption, the rise of mobile trading platforms, and a growing interest in self-directed investing, particularly among millennials and Gen Z. The market's Compound Annual Growth Rate (CAGR) of 6.29% from 2019-2033 indicates a steady expansion, fueled by competitive pricing strategies, innovative trading tools, and the broadening accessibility of financial markets to a wider demographic. Key players like Interactive Brokers, TD Ameritrade, Charles Schwab, E*TRADE, Fidelity Investments, Robinhood, Vanguard, Ally Invest, Firstrade, and DEGIRO are vying for market share through technological advancements and enhanced customer service. While regulatory changes and cybersecurity concerns present potential restraints, the overall market outlook remains positive, fueled by the ongoing democratization of finance.
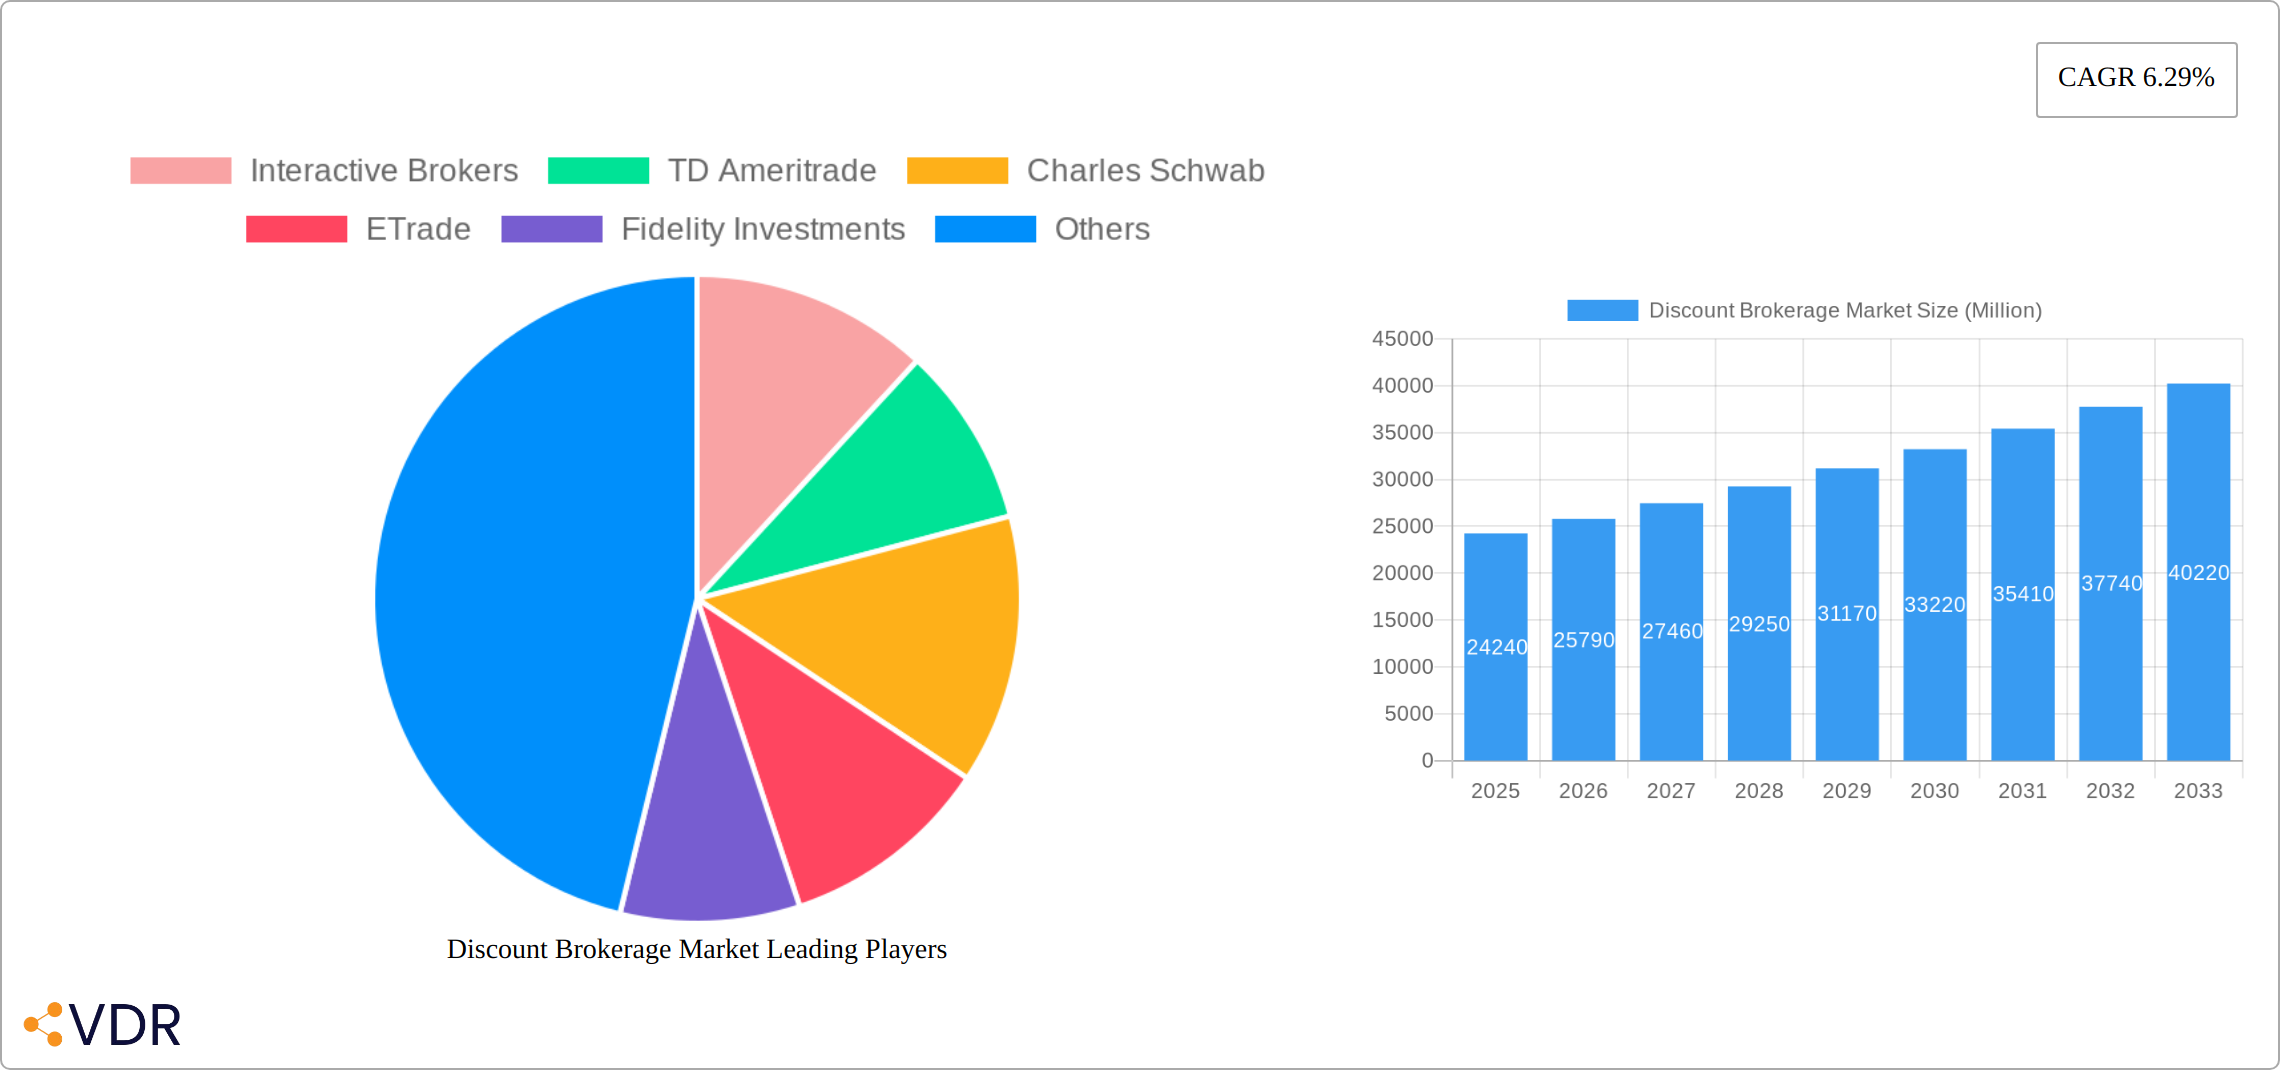
Discount Brokerage Market Market Size (In Billion)
The sustained growth is further supported by several factors, including the expansion of fractional share trading, the increasing popularity of robo-advisors, and the development of sophisticated investment tools accessible through user-friendly interfaces. The market segmentation, though not explicitly provided, can be reasonably inferred to include factors such as trading volume tiers, service offerings (e.g., robo-advisory, margin accounts), and target demographic. Regional variations will undoubtedly exist, with developed economies likely demonstrating higher market penetration and a greater concentration of industry players. Future growth will depend on maintaining investor confidence, adapting to evolving technological advancements, and successfully navigating shifts in regulatory landscapes. The ongoing evolution of financial technology and the ever-changing investor landscape promise to keep the discount brokerage market dynamic and competitive in the coming years.
Discount Brokerage Market Company Market Share
This comprehensive report provides a deep dive into the Discount Brokerage Market, analyzing its dynamics, growth trends, and future outlook. The study covers the period 2019-2033, with a base year of 2025 and a forecast period of 2025-2033. This report is essential for industry professionals, investors, and anyone seeking to understand this rapidly evolving market. The parent market is the broader Financial Services industry, while the child market focuses specifically on discount brokerage services. The market size is predicted to reach xx Million by 2033.
Discount Brokerage Market Market Dynamics & Structure
The discount brokerage market is characterized by intense competition, driven by technological innovation and evolving consumer preferences. Market concentration is moderate, with several major players commanding significant shares, but also allowing for the existence of numerous smaller niche players. Technological advancements, such as AI-driven investment tools and mobile-first platforms, are key drivers of growth. Regulatory frameworks, varying by region, significantly impact operational costs and market access. The rise of robo-advisors presents a significant competitive substitute, while mergers and acquisitions (M&A) activity continues to shape the market landscape.
- Market Concentration: Moderately concentrated, with top 5 players holding approximately xx% market share in 2024 (estimated).
- Technological Innovation: High levels of innovation in AI-powered trading tools, mobile apps, and fractional share trading.
- Regulatory Framework: Varies significantly across geographies, impacting compliance costs and market entry barriers.
- Competitive Substitutes: Robo-advisors and other automated investment platforms pose a growing threat.
- End-User Demographics: Growing adoption among millennials and Gen Z, driving demand for user-friendly platforms.
- M&A Trends: Consistent M&A activity, with xx deals recorded between 2019 and 2024 (estimated). Deals focused on enhancing technology and expanding market reach.
Discount Brokerage Market Growth Trends & Insights
The discount brokerage market experienced explosive growth between 2019 and 2024, fueled by a surge in retail investor participation and rapid technological advancements. While precise figures require specific data (replace xx Million with actual figures), the market exhibited a significant expansion, showcasing a robust Compound Annual Growth Rate (CAGR). This remarkable growth is attributed to several key factors: the widespread adoption of digital platforms, the increasing affordability of investment products, and the burgeoning popularity of self-directed investing. Technological disruptions, such as the proliferation of user-friendly mobile trading apps and the rise of robo-advisors, have fundamentally reshaped consumer behavior, driving an unprecedented demand for convenient and cost-effective investment solutions. Market penetration has increased significantly, particularly within developed economies, with a noticeable surge in first-time investors. Future growth projections remain positive, driven by factors such as improving financial literacy, the expanding millennial and Gen Z investor base, and the continuous expansion of innovative digital financial services. The increasing accessibility of information and educational resources online further empowers individual investors, contributing to sustained market growth.
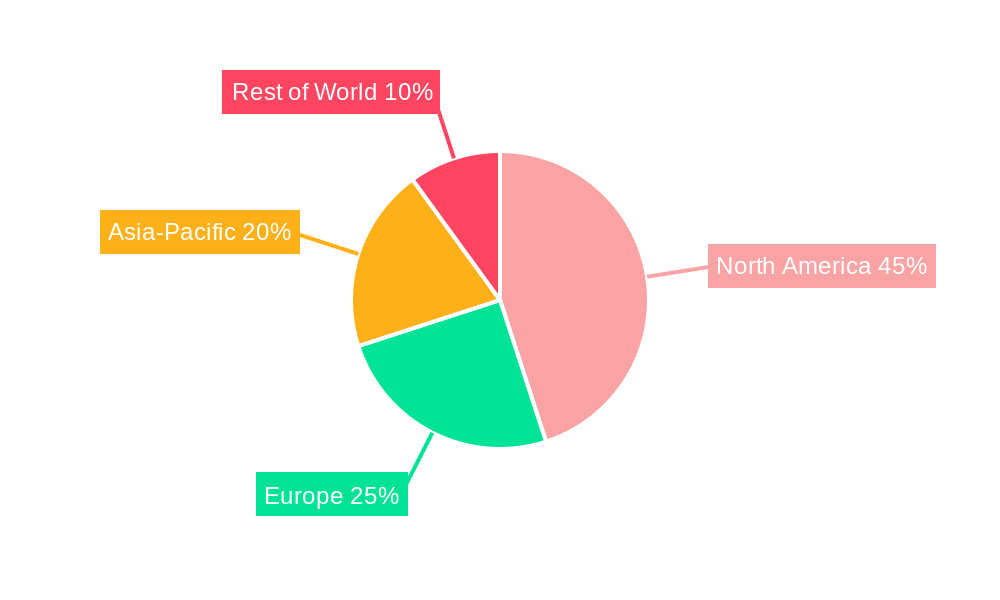
Dominant Regions, Countries, or Segments in Discount Brokerage Market
North America currently holds a dominant position in the discount brokerage market, propelled by high levels of financial literacy, a robust technological infrastructure, and a substantial base of retail investors. However, emerging markets in Asia and Latin America present significant growth opportunities, fueled by factors such as increasing smartphone penetration, rising disposable incomes, and supportive government initiatives promoting financial inclusion. Competition is intensifying globally, with established players expanding into new markets and innovative fintech startups disrupting traditional models.
- North America: High market penetration, strong regulatory environment, technological leadership, and established investor base.
- Europe: Steady growth, driven by increasing digital adoption and evolving regulatory landscapes. Consolidation among players is also shaping the market.
- Asia-Pacific: High growth potential, driven by a burgeoning middle class, increasing smartphone penetration, and a young, digitally-savvy population.
- Latin America: An emerging market with substantial growth potential, driven by increasing financial inclusion and government efforts to expand access to financial services.
Discount Brokerage Market Product Landscape
The discount brokerage landscape is evolving rapidly, moving beyond basic trading functionalities to encompass a diverse range of sophisticated investment tools, comprehensive educational resources, and increasingly personalized financial advice. Platforms now offer a wide array of features, including fractional share trading, algorithmic trading capabilities, and access to a broad spectrum of investment products such as ETFs, mutual funds, options, and even cryptocurrencies (where regulations allow). Key differentiators now include not only low fees but also user-friendly interfaces, advanced charting and analytics tools, and personalized investment insights powered by AI and machine learning. These technological advancements are revolutionizing the user experience, enhancing investment decision-making, and automating many aspects of the trading process, leading to greater efficiency and accessibility.
Key Drivers, Barriers & Challenges in Discount Brokerage Market
Key Drivers:
- Increasing retail investor participation
- Technological advancements (mobile trading, AI-powered tools)
- Rising financial literacy
- Low-cost brokerage fees
Challenges & Restraints:
- Intense competition among established players and new entrants
- Regulatory changes and compliance costs (estimated to impact profitability by xx% in the next 5 years)
- Cybersecurity risks and data breaches (an estimated xx Million in losses due to cyberattacks between 2019-2024)
- Supply chain disruptions affecting technology infrastructure.
Emerging Opportunities in Discount Brokerage Market
- Expansion into underserved markets, including emerging economies and specific demographics.
- Development of innovative investment products and services tailored to specific needs.
- Integration of AI and machine learning for enhanced personalization and risk management.
- Strategic partnerships with fintech companies to expand product offerings and reach.
Growth Accelerators in the Discount Brokerage Market Industry
The long-term growth of the discount brokerage market will be driven by several factors, including continued technological innovation, strategic partnerships with financial institutions, and expansion into new geographic markets. The rising adoption of robo-advisors, the development of personalized investment solutions, and the integration of blockchain technology will also play significant roles in shaping the market’s future.
Key Players Shaping the Discount Brokerage Market Market
- Interactive Brokers
- TD Ameritrade
- Charles Schwab
- ETrade
- Fidelity Investments
- Robinhood
- Vanguard
- Ally Invest
- Firstrade
- DEGIRO
- List Not Exhaustive
Notable Milestones in Discount Brokerage Market Sector
- September 2023: HDFC Securities launched the discount brokerage platform Sky, offering a wide range of trading and investment options, significantly expanding the reach of discount brokerage services in India and highlighting the continued growth in emerging markets.
- September 2023: Ujjivan SFB partnered with SMC Global Securities to extend online trading services to its clientele, increasing accessibility to discount brokerage services and demonstrating the collaborative efforts to expand market penetration.
- [Add more recent milestones here, with dates and brief descriptions. Include details on mergers, acquisitions, new product launches, regulatory changes, or other significant events impacting the market.]
In-Depth Discount Brokerage Market Market Outlook
The discount brokerage market is poised for sustained growth over the forecast period, driven by several factors including the increasing adoption of online trading platforms, the growth of the millennial and Gen Z investor base, and the expansion of financial technology. The continued innovation in investment products and services, coupled with strategic partnerships and mergers and acquisitions, will further accelerate market expansion and create new opportunities for both established players and new entrants. The market is expected to show strong potential for significant revenue generation in the years to come.
Discount Brokerage Market Segmentation
-
1. Mode
- 1.1. Online Discount Brokerage Service
- 1.2. Offline Discount Brokerage Service
-
2. Application
- 2.1. Individual
- 2.2. Enterprise
- 2.3. Government Agencies
-
3. Services
- 3.1. Order Execution and Advisory
- 3.2. Discretionary
- 3.3. Online Trading Platforms
- 3.4. Education and Investor Resources
-
4. Commission
- 4.1. Commission-free Brokers
- 4.2. Fixed Commission Brokers
Discount Brokerage Market Segmentation By Geography
-
1. North America
- 1.1. United States
- 1.2. Canada
- 1.3. Mexico
- 1.4. Rest of North America
-
2. Europe
- 2.1. Germany
- 2.2. United Kingdom
- 2.3. France
- 2.4. Russia
- 2.5. Spain
- 2.6. Rest of Europe
-
3. Asia Pacific
- 3.1. India
- 3.2. China
- 3.3. Japan
- 3.4. Rest of Asia Pacific
-
4. South America
- 4.1. Brazil
- 4.2. Argentina
- 4.3. Rest of South America
-
5. Middle East
- 5.1. United Arab Emirates
- 5.2. Saudi Arabia
- 5.3. Rest of Middle East
Discount Brokerage Market Regional Market Share
Geographic Coverage of Discount Brokerage Market
Discount Brokerage Market REPORT HIGHLIGHTS
| Aspects | Details |
|---|---|
| Study Period | 2020-2034 |
| Base Year | 2025 |
| Estimated Year | 2026 |
| Forecast Period | 2026-2034 |
| Historical Period | 2020-2025 |
| Growth Rate | CAGR of 6.29% from 2020-2034 |
| Segmentation |
|
Table of Contents
- 1. Introduction
- 1.1. Research Scope
- 1.2. Market Segmentation
- 1.3. Research Objective
- 1.4. Definitions and Assumptions
- 2. Executive Summary
- 2.1. Market Snapshot
- 3. Market Dynamics
- 3.1. Market Drivers
- 3.2. Market Restrains
- 3.3. Market Trends
- 3.4. Market Opportunities
- 4. Market Factor Analysis
- 4.1. Porters Five Forces
- 4.1.1. Bargaining Power of Suppliers
- 4.1.2. Bargaining Power of Buyers
- 4.1.3. Threat of New Entrants
- 4.1.4. Threat of Substitutes
- 4.1.5. Competitive Rivalry
- 4.2. PESTEL analysis
- 4.3. BCG Analysis
- 4.3.1. Stars (High Growth, High Market Share)
- 4.3.2. Cash Cows (Low Growth, High Market Share)
- 4.3.3. Question Mark (High Growth, Low Market Share)
- 4.3.4. Dogs (Low Growth, Low Market Share)
- 4.4. Ansoff Matrix Analysis
- 4.5. Supply Chain Analysis
- 4.6. Regulatory Landscape
- 4.7. Current Market Potential and Opportunity Assessment (TAM–SAM–SOM Framework)
- 4.8. VDR Analyst Note
- 4.1. Porters Five Forces
- 5. Market Analysis, Insights and Forecast 2021-2033
- 5.1. Market Analysis, Insights and Forecast - by Mode
- 5.1.1. Online Discount Brokerage Service
- 5.1.2. Offline Discount Brokerage Service
- 5.2. Market Analysis, Insights and Forecast - by Application
- 5.2.1. Individual
- 5.2.2. Enterprise
- 5.2.3. Government Agencies
- 5.3. Market Analysis, Insights and Forecast - by Services
- 5.3.1. Order Execution and Advisory
- 5.3.2. Discretionary
- 5.3.3. Online Trading Platforms
- 5.3.4. Education and Investor Resources
- 5.4. Market Analysis, Insights and Forecast - by Commission
- 5.4.1. Commission-free Brokers
- 5.4.2. Fixed Commission Brokers
- 5.5. Market Analysis, Insights and Forecast - by Region
- 5.5.1. North America
- 5.5.2. Europe
- 5.5.3. Asia Pacific
- 5.5.4. South America
- 5.5.5. Middle East
- 5.1. Market Analysis, Insights and Forecast - by Mode
- 6. Global Discount Brokerage Market Analysis, Insights and Forecast, 2021-2033
- 6.1. Market Analysis, Insights and Forecast - by Mode
- 6.1.1. Online Discount Brokerage Service
- 6.1.2. Offline Discount Brokerage Service
- 6.2. Market Analysis, Insights and Forecast - by Application
- 6.2.1. Individual
- 6.2.2. Enterprise
- 6.2.3. Government Agencies
- 6.3. Market Analysis, Insights and Forecast - by Services
- 6.3.1. Order Execution and Advisory
- 6.3.2. Discretionary
- 6.3.3. Online Trading Platforms
- 6.3.4. Education and Investor Resources
- 6.4. Market Analysis, Insights and Forecast - by Commission
- 6.4.1. Commission-free Brokers
- 6.4.2. Fixed Commission Brokers
- 6.1. Market Analysis, Insights and Forecast - by Mode
- 7. North America Discount Brokerage Market Analysis, Insights and Forecast, 2021-2033
- 7.1. Market Analysis, Insights and Forecast - by Mode
- 7.1.1. Online Discount Brokerage Service
- 7.1.2. Offline Discount Brokerage Service
- 7.2. Market Analysis, Insights and Forecast - by Application
- 7.2.1. Individual
- 7.2.2. Enterprise
- 7.2.3. Government Agencies
- 7.3. Market Analysis, Insights and Forecast - by Services
- 7.3.1. Order Execution and Advisory
- 7.3.2. Discretionary
- 7.3.3. Online Trading Platforms
- 7.3.4. Education and Investor Resources
- 7.4. Market Analysis, Insights and Forecast - by Commission
- 7.4.1. Commission-free Brokers
- 7.4.2. Fixed Commission Brokers
- 7.1. Market Analysis, Insights and Forecast - by Mode
- 8. Europe Discount Brokerage Market Analysis, Insights and Forecast, 2021-2033
- 8.1. Market Analysis, Insights and Forecast - by Mode
- 8.1.1. Online Discount Brokerage Service
- 8.1.2. Offline Discount Brokerage Service
- 8.2. Market Analysis, Insights and Forecast - by Application
- 8.2.1. Individual
- 8.2.2. Enterprise
- 8.2.3. Government Agencies
- 8.3. Market Analysis, Insights and Forecast - by Services
- 8.3.1. Order Execution and Advisory
- 8.3.2. Discretionary
- 8.3.3. Online Trading Platforms
- 8.3.4. Education and Investor Resources
- 8.4. Market Analysis, Insights and Forecast - by Commission
- 8.4.1. Commission-free Brokers
- 8.4.2. Fixed Commission Brokers
- 8.1. Market Analysis, Insights and Forecast - by Mode
- 9. Asia Pacific Discount Brokerage Market Analysis, Insights and Forecast, 2021-2033
- 9.1. Market Analysis, Insights and Forecast - by Mode
- 9.1.1. Online Discount Brokerage Service
- 9.1.2. Offline Discount Brokerage Service
- 9.2. Market Analysis, Insights and Forecast - by Application
- 9.2.1. Individual
- 9.2.2. Enterprise
- 9.2.3. Government Agencies
- 9.3. Market Analysis, Insights and Forecast - by Services
- 9.3.1. Order Execution and Advisory
- 9.3.2. Discretionary
- 9.3.3. Online Trading Platforms
- 9.3.4. Education and Investor Resources
- 9.4. Market Analysis, Insights and Forecast - by Commission
- 9.4.1. Commission-free Brokers
- 9.4.2. Fixed Commission Brokers
- 9.1. Market Analysis, Insights and Forecast - by Mode
- 10. South America Discount Brokerage Market Analysis, Insights and Forecast, 2021-2033
- 10.1. Market Analysis, Insights and Forecast - by Mode
- 10.1.1. Online Discount Brokerage Service
- 10.1.2. Offline Discount Brokerage Service
- 10.2. Market Analysis, Insights and Forecast - by Application
- 10.2.1. Individual
- 10.2.2. Enterprise
- 10.2.3. Government Agencies
- 10.3. Market Analysis, Insights and Forecast - by Services
- 10.3.1. Order Execution and Advisory
- 10.3.2. Discretionary
- 10.3.3. Online Trading Platforms
- 10.3.4. Education and Investor Resources
- 10.4. Market Analysis, Insights and Forecast - by Commission
- 10.4.1. Commission-free Brokers
- 10.4.2. Fixed Commission Brokers
- 10.1. Market Analysis, Insights and Forecast - by Mode
- 11. Middle East Discount Brokerage Market Analysis, Insights and Forecast, 2021-2033
- 11.1. Market Analysis, Insights and Forecast - by Mode
- 11.1.1. Online Discount Brokerage Service
- 11.1.2. Offline Discount Brokerage Service
- 11.2. Market Analysis, Insights and Forecast - by Application
- 11.2.1. Individual
- 11.2.2. Enterprise
- 11.2.3. Government Agencies
- 11.3. Market Analysis, Insights and Forecast - by Services
- 11.3.1. Order Execution and Advisory
- 11.3.2. Discretionary
- 11.3.3. Online Trading Platforms
- 11.3.4. Education and Investor Resources
- 11.4. Market Analysis, Insights and Forecast - by Commission
- 11.4.1. Commission-free Brokers
- 11.4.2. Fixed Commission Brokers
- 11.1. Market Analysis, Insights and Forecast - by Mode
- 12. Competitive Analysis
- 12.1. Company Profiles
- 12.1.1 Interactive Brokers
- 12.1.1.1. Company Overview
- 12.1.1.2. Products
- 12.1.1.3. Company Financials
- 12.1.1.4. SWOT Analysis
- 12.1.2 TD Ameritrade
- 12.1.2.1. Company Overview
- 12.1.2.2. Products
- 12.1.2.3. Company Financials
- 12.1.2.4. SWOT Analysis
- 12.1.3 Charles Schwab
- 12.1.3.1. Company Overview
- 12.1.3.2. Products
- 12.1.3.3. Company Financials
- 12.1.3.4. SWOT Analysis
- 12.1.4 ETrade
- 12.1.4.1. Company Overview
- 12.1.4.2. Products
- 12.1.4.3. Company Financials
- 12.1.4.4. SWOT Analysis
- 12.1.5 Fidelity Investments
- 12.1.5.1. Company Overview
- 12.1.5.2. Products
- 12.1.5.3. Company Financials
- 12.1.5.4. SWOT Analysis
- 12.1.6 Robinhood
- 12.1.6.1. Company Overview
- 12.1.6.2. Products
- 12.1.6.3. Company Financials
- 12.1.6.4. SWOT Analysis
- 12.1.7 Vanguard
- 12.1.7.1. Company Overview
- 12.1.7.2. Products
- 12.1.7.3. Company Financials
- 12.1.7.4. SWOT Analysis
- 12.1.8 Ally Invest
- 12.1.8.1. Company Overview
- 12.1.8.2. Products
- 12.1.8.3. Company Financials
- 12.1.8.4. SWOT Analysis
- 12.1.9 Firstrade
- 12.1.9.1. Company Overview
- 12.1.9.2. Products
- 12.1.9.3. Company Financials
- 12.1.9.4. SWOT Analysis
- 12.1.10 DEGIRO**List Not Exhaustive
- 12.1.10.1. Company Overview
- 12.1.10.2. Products
- 12.1.10.3. Company Financials
- 12.1.10.4. SWOT Analysis
- 12.1.1 Interactive Brokers
- 12.2. Market Entropy
- 12.2.1 Company's Key Areas Served
- 12.2.2 Recent Developments
- 12.3. Company Market Share Analysis 2025
- 12.3.1 Top 5 Companies Market Share Analysis
- 12.3.2 Top 3 Companies Market Share Analysis
- 12.4. List of Potential Customers
- 13. Research Methodology
List of Figures
- Figure 1: Global Discount Brokerage Market Revenue Breakdown (Million, %) by Region 2025 & 2033
- Figure 2: Global Discount Brokerage Market Volume Breakdown (Billion, %) by Region 2025 & 2033
- Figure 3: North America Discount Brokerage Market Revenue (Million), by Mode 2025 & 2033
- Figure 4: North America Discount Brokerage Market Volume (Billion), by Mode 2025 & 2033
- Figure 5: North America Discount Brokerage Market Revenue Share (%), by Mode 2025 & 2033
- Figure 6: North America Discount Brokerage Market Volume Share (%), by Mode 2025 & 2033
- Figure 7: North America Discount Brokerage Market Revenue (Million), by Application 2025 & 2033
- Figure 8: North America Discount Brokerage Market Volume (Billion), by Application 2025 & 2033
- Figure 9: North America Discount Brokerage Market Revenue Share (%), by Application 2025 & 2033
- Figure 10: North America Discount Brokerage Market Volume Share (%), by Application 2025 & 2033
- Figure 11: North America Discount Brokerage Market Revenue (Million), by Services 2025 & 2033
- Figure 12: North America Discount Brokerage Market Volume (Billion), by Services 2025 & 2033
- Figure 13: North America Discount Brokerage Market Revenue Share (%), by Services 2025 & 2033
- Figure 14: North America Discount Brokerage Market Volume Share (%), by Services 2025 & 2033
- Figure 15: North America Discount Brokerage Market Revenue (Million), by Commission 2025 & 2033
- Figure 16: North America Discount Brokerage Market Volume (Billion), by Commission 2025 & 2033
- Figure 17: North America Discount Brokerage Market Revenue Share (%), by Commission 2025 & 2033
- Figure 18: North America Discount Brokerage Market Volume Share (%), by Commission 2025 & 2033
- Figure 19: North America Discount Brokerage Market Revenue (Million), by Country 2025 & 2033
- Figure 20: North America Discount Brokerage Market Volume (Billion), by Country 2025 & 2033
- Figure 21: North America Discount Brokerage Market Revenue Share (%), by Country 2025 & 2033
- Figure 22: North America Discount Brokerage Market Volume Share (%), by Country 2025 & 2033
- Figure 23: Europe Discount Brokerage Market Revenue (Million), by Mode 2025 & 2033
- Figure 24: Europe Discount Brokerage Market Volume (Billion), by Mode 2025 & 2033
- Figure 25: Europe Discount Brokerage Market Revenue Share (%), by Mode 2025 & 2033
- Figure 26: Europe Discount Brokerage Market Volume Share (%), by Mode 2025 & 2033
- Figure 27: Europe Discount Brokerage Market Revenue (Million), by Application 2025 & 2033
- Figure 28: Europe Discount Brokerage Market Volume (Billion), by Application 2025 & 2033
- Figure 29: Europe Discount Brokerage Market Revenue Share (%), by Application 2025 & 2033
- Figure 30: Europe Discount Brokerage Market Volume Share (%), by Application 2025 & 2033
- Figure 31: Europe Discount Brokerage Market Revenue (Million), by Services 2025 & 2033
- Figure 32: Europe Discount Brokerage Market Volume (Billion), by Services 2025 & 2033
- Figure 33: Europe Discount Brokerage Market Revenue Share (%), by Services 2025 & 2033
- Figure 34: Europe Discount Brokerage Market Volume Share (%), by Services 2025 & 2033
- Figure 35: Europe Discount Brokerage Market Revenue (Million), by Commission 2025 & 2033
- Figure 36: Europe Discount Brokerage Market Volume (Billion), by Commission 2025 & 2033
- Figure 37: Europe Discount Brokerage Market Revenue Share (%), by Commission 2025 & 2033
- Figure 38: Europe Discount Brokerage Market Volume Share (%), by Commission 2025 & 2033
- Figure 39: Europe Discount Brokerage Market Revenue (Million), by Country 2025 & 2033
- Figure 40: Europe Discount Brokerage Market Volume (Billion), by Country 2025 & 2033
- Figure 41: Europe Discount Brokerage Market Revenue Share (%), by Country 2025 & 2033
- Figure 42: Europe Discount Brokerage Market Volume Share (%), by Country 2025 & 2033
- Figure 43: Asia Pacific Discount Brokerage Market Revenue (Million), by Mode 2025 & 2033
- Figure 44: Asia Pacific Discount Brokerage Market Volume (Billion), by Mode 2025 & 2033
- Figure 45: Asia Pacific Discount Brokerage Market Revenue Share (%), by Mode 2025 & 2033
- Figure 46: Asia Pacific Discount Brokerage Market Volume Share (%), by Mode 2025 & 2033
- Figure 47: Asia Pacific Discount Brokerage Market Revenue (Million), by Application 2025 & 2033
- Figure 48: Asia Pacific Discount Brokerage Market Volume (Billion), by Application 2025 & 2033
- Figure 49: Asia Pacific Discount Brokerage Market Revenue Share (%), by Application 2025 & 2033
- Figure 50: Asia Pacific Discount Brokerage Market Volume Share (%), by Application 2025 & 2033
- Figure 51: Asia Pacific Discount Brokerage Market Revenue (Million), by Services 2025 & 2033
- Figure 52: Asia Pacific Discount Brokerage Market Volume (Billion), by Services 2025 & 2033
- Figure 53: Asia Pacific Discount Brokerage Market Revenue Share (%), by Services 2025 & 2033
- Figure 54: Asia Pacific Discount Brokerage Market Volume Share (%), by Services 2025 & 2033
- Figure 55: Asia Pacific Discount Brokerage Market Revenue (Million), by Commission 2025 & 2033
- Figure 56: Asia Pacific Discount Brokerage Market Volume (Billion), by Commission 2025 & 2033
- Figure 57: Asia Pacific Discount Brokerage Market Revenue Share (%), by Commission 2025 & 2033
- Figure 58: Asia Pacific Discount Brokerage Market Volume Share (%), by Commission 2025 & 2033
- Figure 59: Asia Pacific Discount Brokerage Market Revenue (Million), by Country 2025 & 2033
- Figure 60: Asia Pacific Discount Brokerage Market Volume (Billion), by Country 2025 & 2033
- Figure 61: Asia Pacific Discount Brokerage Market Revenue Share (%), by Country 2025 & 2033
- Figure 62: Asia Pacific Discount Brokerage Market Volume Share (%), by Country 2025 & 2033
- Figure 63: South America Discount Brokerage Market Revenue (Million), by Mode 2025 & 2033
- Figure 64: South America Discount Brokerage Market Volume (Billion), by Mode 2025 & 2033
- Figure 65: South America Discount Brokerage Market Revenue Share (%), by Mode 2025 & 2033
- Figure 66: South America Discount Brokerage Market Volume Share (%), by Mode 2025 & 2033
- Figure 67: South America Discount Brokerage Market Revenue (Million), by Application 2025 & 2033
- Figure 68: South America Discount Brokerage Market Volume (Billion), by Application 2025 & 2033
- Figure 69: South America Discount Brokerage Market Revenue Share (%), by Application 2025 & 2033
- Figure 70: South America Discount Brokerage Market Volume Share (%), by Application 2025 & 2033
- Figure 71: South America Discount Brokerage Market Revenue (Million), by Services 2025 & 2033
- Figure 72: South America Discount Brokerage Market Volume (Billion), by Services 2025 & 2033
- Figure 73: South America Discount Brokerage Market Revenue Share (%), by Services 2025 & 2033
- Figure 74: South America Discount Brokerage Market Volume Share (%), by Services 2025 & 2033
- Figure 75: South America Discount Brokerage Market Revenue (Million), by Commission 2025 & 2033
- Figure 76: South America Discount Brokerage Market Volume (Billion), by Commission 2025 & 2033
- Figure 77: South America Discount Brokerage Market Revenue Share (%), by Commission 2025 & 2033
- Figure 78: South America Discount Brokerage Market Volume Share (%), by Commission 2025 & 2033
- Figure 79: South America Discount Brokerage Market Revenue (Million), by Country 2025 & 2033
- Figure 80: South America Discount Brokerage Market Volume (Billion), by Country 2025 & 2033
- Figure 81: South America Discount Brokerage Market Revenue Share (%), by Country 2025 & 2033
- Figure 82: South America Discount Brokerage Market Volume Share (%), by Country 2025 & 2033
- Figure 83: Middle East Discount Brokerage Market Revenue (Million), by Mode 2025 & 2033
- Figure 84: Middle East Discount Brokerage Market Volume (Billion), by Mode 2025 & 2033
- Figure 85: Middle East Discount Brokerage Market Revenue Share (%), by Mode 2025 & 2033
- Figure 86: Middle East Discount Brokerage Market Volume Share (%), by Mode 2025 & 2033
- Figure 87: Middle East Discount Brokerage Market Revenue (Million), by Application 2025 & 2033
- Figure 88: Middle East Discount Brokerage Market Volume (Billion), by Application 2025 & 2033
- Figure 89: Middle East Discount Brokerage Market Revenue Share (%), by Application 2025 & 2033
- Figure 90: Middle East Discount Brokerage Market Volume Share (%), by Application 2025 & 2033
- Figure 91: Middle East Discount Brokerage Market Revenue (Million), by Services 2025 & 2033
- Figure 92: Middle East Discount Brokerage Market Volume (Billion), by Services 2025 & 2033
- Figure 93: Middle East Discount Brokerage Market Revenue Share (%), by Services 2025 & 2033
- Figure 94: Middle East Discount Brokerage Market Volume Share (%), by Services 2025 & 2033
- Figure 95: Middle East Discount Brokerage Market Revenue (Million), by Commission 2025 & 2033
- Figure 96: Middle East Discount Brokerage Market Volume (Billion), by Commission 2025 & 2033
- Figure 97: Middle East Discount Brokerage Market Revenue Share (%), by Commission 2025 & 2033
- Figure 98: Middle East Discount Brokerage Market Volume Share (%), by Commission 2025 & 2033
- Figure 99: Middle East Discount Brokerage Market Revenue (Million), by Country 2025 & 2033
- Figure 100: Middle East Discount Brokerage Market Volume (Billion), by Country 2025 & 2033
- Figure 101: Middle East Discount Brokerage Market Revenue Share (%), by Country 2025 & 2033
- Figure 102: Middle East Discount Brokerage Market Volume Share (%), by Country 2025 & 2033
List of Tables
- Table 1: Global Discount Brokerage Market Revenue Million Forecast, by Mode 2020 & 2033
- Table 2: Global Discount Brokerage Market Volume Billion Forecast, by Mode 2020 & 2033
- Table 3: Global Discount Brokerage Market Revenue Million Forecast, by Application 2020 & 2033
- Table 4: Global Discount Brokerage Market Volume Billion Forecast, by Application 2020 & 2033
- Table 5: Global Discount Brokerage Market Revenue Million Forecast, by Services 2020 & 2033
- Table 6: Global Discount Brokerage Market Volume Billion Forecast, by Services 2020 & 2033
- Table 7: Global Discount Brokerage Market Revenue Million Forecast, by Commission 2020 & 2033
- Table 8: Global Discount Brokerage Market Volume Billion Forecast, by Commission 2020 & 2033
- Table 9: Global Discount Brokerage Market Revenue Million Forecast, by Region 2020 & 2033
- Table 10: Global Discount Brokerage Market Volume Billion Forecast, by Region 2020 & 2033
- Table 11: Global Discount Brokerage Market Revenue Million Forecast, by Mode 2020 & 2033
- Table 12: Global Discount Brokerage Market Volume Billion Forecast, by Mode 2020 & 2033
- Table 13: Global Discount Brokerage Market Revenue Million Forecast, by Application 2020 & 2033
- Table 14: Global Discount Brokerage Market Volume Billion Forecast, by Application 2020 & 2033
- Table 15: Global Discount Brokerage Market Revenue Million Forecast, by Services 2020 & 2033
- Table 16: Global Discount Brokerage Market Volume Billion Forecast, by Services 2020 & 2033
- Table 17: Global Discount Brokerage Market Revenue Million Forecast, by Commission 2020 & 2033
- Table 18: Global Discount Brokerage Market Volume Billion Forecast, by Commission 2020 & 2033
- Table 19: Global Discount Brokerage Market Revenue Million Forecast, by Country 2020 & 2033
- Table 20: Global Discount Brokerage Market Volume Billion Forecast, by Country 2020 & 2033
- Table 21: United States Discount Brokerage Market Revenue (Million) Forecast, by Application 2020 & 2033
- Table 22: United States Discount Brokerage Market Volume (Billion) Forecast, by Application 2020 & 2033
- Table 23: Canada Discount Brokerage Market Revenue (Million) Forecast, by Application 2020 & 2033
- Table 24: Canada Discount Brokerage Market Volume (Billion) Forecast, by Application 2020 & 2033
- Table 25: Mexico Discount Brokerage Market Revenue (Million) Forecast, by Application 2020 & 2033
- Table 26: Mexico Discount Brokerage Market Volume (Billion) Forecast, by Application 2020 & 2033
- Table 27: Rest of North America Discount Brokerage Market Revenue (Million) Forecast, by Application 2020 & 2033
- Table 28: Rest of North America Discount Brokerage Market Volume (Billion) Forecast, by Application 2020 & 2033
- Table 29: Global Discount Brokerage Market Revenue Million Forecast, by Mode 2020 & 2033
- Table 30: Global Discount Brokerage Market Volume Billion Forecast, by Mode 2020 & 2033
- Table 31: Global Discount Brokerage Market Revenue Million Forecast, by Application 2020 & 2033
- Table 32: Global Discount Brokerage Market Volume Billion Forecast, by Application 2020 & 2033
- Table 33: Global Discount Brokerage Market Revenue Million Forecast, by Services 2020 & 2033
- Table 34: Global Discount Brokerage Market Volume Billion Forecast, by Services 2020 & 2033
- Table 35: Global Discount Brokerage Market Revenue Million Forecast, by Commission 2020 & 2033
- Table 36: Global Discount Brokerage Market Volume Billion Forecast, by Commission 2020 & 2033
- Table 37: Global Discount Brokerage Market Revenue Million Forecast, by Country 2020 & 2033
- Table 38: Global Discount Brokerage Market Volume Billion Forecast, by Country 2020 & 2033
- Table 39: Germany Discount Brokerage Market Revenue (Million) Forecast, by Application 2020 & 2033
- Table 40: Germany Discount Brokerage Market Volume (Billion) Forecast, by Application 2020 & 2033
- Table 41: United Kingdom Discount Brokerage Market Revenue (Million) Forecast, by Application 2020 & 2033
- Table 42: United Kingdom Discount Brokerage Market Volume (Billion) Forecast, by Application 2020 & 2033
- Table 43: France Discount Brokerage Market Revenue (Million) Forecast, by Application 2020 & 2033
- Table 44: France Discount Brokerage Market Volume (Billion) Forecast, by Application 2020 & 2033
- Table 45: Russia Discount Brokerage Market Revenue (Million) Forecast, by Application 2020 & 2033
- Table 46: Russia Discount Brokerage Market Volume (Billion) Forecast, by Application 2020 & 2033
- Table 47: Spain Discount Brokerage Market Revenue (Million) Forecast, by Application 2020 & 2033
- Table 48: Spain Discount Brokerage Market Volume (Billion) Forecast, by Application 2020 & 2033
- Table 49: Rest of Europe Discount Brokerage Market Revenue (Million) Forecast, by Application 2020 & 2033
- Table 50: Rest of Europe Discount Brokerage Market Volume (Billion) Forecast, by Application 2020 & 2033
- Table 51: Global Discount Brokerage Market Revenue Million Forecast, by Mode 2020 & 2033
- Table 52: Global Discount Brokerage Market Volume Billion Forecast, by Mode 2020 & 2033
- Table 53: Global Discount Brokerage Market Revenue Million Forecast, by Application 2020 & 2033
- Table 54: Global Discount Brokerage Market Volume Billion Forecast, by Application 2020 & 2033
- Table 55: Global Discount Brokerage Market Revenue Million Forecast, by Services 2020 & 2033
- Table 56: Global Discount Brokerage Market Volume Billion Forecast, by Services 2020 & 2033
- Table 57: Global Discount Brokerage Market Revenue Million Forecast, by Commission 2020 & 2033
- Table 58: Global Discount Brokerage Market Volume Billion Forecast, by Commission 2020 & 2033
- Table 59: Global Discount Brokerage Market Revenue Million Forecast, by Country 2020 & 2033
- Table 60: Global Discount Brokerage Market Volume Billion Forecast, by Country 2020 & 2033
- Table 61: India Discount Brokerage Market Revenue (Million) Forecast, by Application 2020 & 2033
- Table 62: India Discount Brokerage Market Volume (Billion) Forecast, by Application 2020 & 2033
- Table 63: China Discount Brokerage Market Revenue (Million) Forecast, by Application 2020 & 2033
- Table 64: China Discount Brokerage Market Volume (Billion) Forecast, by Application 2020 & 2033
- Table 65: Japan Discount Brokerage Market Revenue (Million) Forecast, by Application 2020 & 2033
- Table 66: Japan Discount Brokerage Market Volume (Billion) Forecast, by Application 2020 & 2033
- Table 67: Rest of Asia Pacific Discount Brokerage Market Revenue (Million) Forecast, by Application 2020 & 2033
- Table 68: Rest of Asia Pacific Discount Brokerage Market Volume (Billion) Forecast, by Application 2020 & 2033
- Table 69: Global Discount Brokerage Market Revenue Million Forecast, by Mode 2020 & 2033
- Table 70: Global Discount Brokerage Market Volume Billion Forecast, by Mode 2020 & 2033
- Table 71: Global Discount Brokerage Market Revenue Million Forecast, by Application 2020 & 2033
- Table 72: Global Discount Brokerage Market Volume Billion Forecast, by Application 2020 & 2033
- Table 73: Global Discount Brokerage Market Revenue Million Forecast, by Services 2020 & 2033
- Table 74: Global Discount Brokerage Market Volume Billion Forecast, by Services 2020 & 2033
- Table 75: Global Discount Brokerage Market Revenue Million Forecast, by Commission 2020 & 2033
- Table 76: Global Discount Brokerage Market Volume Billion Forecast, by Commission 2020 & 2033
- Table 77: Global Discount Brokerage Market Revenue Million Forecast, by Country 2020 & 2033
- Table 78: Global Discount Brokerage Market Volume Billion Forecast, by Country 2020 & 2033
- Table 79: Brazil Discount Brokerage Market Revenue (Million) Forecast, by Application 2020 & 2033
- Table 80: Brazil Discount Brokerage Market Volume (Billion) Forecast, by Application 2020 & 2033
- Table 81: Argentina Discount Brokerage Market Revenue (Million) Forecast, by Application 2020 & 2033
- Table 82: Argentina Discount Brokerage Market Volume (Billion) Forecast, by Application 2020 & 2033
- Table 83: Rest of South America Discount Brokerage Market Revenue (Million) Forecast, by Application 2020 & 2033
- Table 84: Rest of South America Discount Brokerage Market Volume (Billion) Forecast, by Application 2020 & 2033
- Table 85: Global Discount Brokerage Market Revenue Million Forecast, by Mode 2020 & 2033
- Table 86: Global Discount Brokerage Market Volume Billion Forecast, by Mode 2020 & 2033
- Table 87: Global Discount Brokerage Market Revenue Million Forecast, by Application 2020 & 2033
- Table 88: Global Discount Brokerage Market Volume Billion Forecast, by Application 2020 & 2033
- Table 89: Global Discount Brokerage Market Revenue Million Forecast, by Services 2020 & 2033
- Table 90: Global Discount Brokerage Market Volume Billion Forecast, by Services 2020 & 2033
- Table 91: Global Discount Brokerage Market Revenue Million Forecast, by Commission 2020 & 2033
- Table 92: Global Discount Brokerage Market Volume Billion Forecast, by Commission 2020 & 2033
- Table 93: Global Discount Brokerage Market Revenue Million Forecast, by Country 2020 & 2033
- Table 94: Global Discount Brokerage Market Volume Billion Forecast, by Country 2020 & 2033
- Table 95: United Arab Emirates Discount Brokerage Market Revenue (Million) Forecast, by Application 2020 & 2033
- Table 96: United Arab Emirates Discount Brokerage Market Volume (Billion) Forecast, by Application 2020 & 2033
- Table 97: Saudi Arabia Discount Brokerage Market Revenue (Million) Forecast, by Application 2020 & 2033
- Table 98: Saudi Arabia Discount Brokerage Market Volume (Billion) Forecast, by Application 2020 & 2033
- Table 99: Rest of Middle East Discount Brokerage Market Revenue (Million) Forecast, by Application 2020 & 2033
- Table 100: Rest of Middle East Discount Brokerage Market Volume (Billion) Forecast, by Application 2020 & 2033
Frequently Asked Questions
1. What is the projected Compound Annual Growth Rate (CAGR) of the Discount Brokerage Market?
The projected CAGR is approximately 6.29%.
2. Which companies are prominent players in the Discount Brokerage Market?
Key companies in the market include Interactive Brokers, TD Ameritrade, Charles Schwab, ETrade, Fidelity Investments, Robinhood, Vanguard, Ally Invest, Firstrade, DEGIRO**List Not Exhaustive.
3. What are the main segments of the Discount Brokerage Market?
The market segments include Mode, Application, Services , Commission.
4. Can you provide details about the market size?
The market size is estimated to be USD 24.24 Million as of 2022.
5. What are some drivers contributing to market growth?
Low-cost Trading Fee is Driving the Market; Increasing Popularity of Self-directed Investing.
6. What are the notable trends driving market growth?
Increase in Enterprise Market is Fuelling the Market.
7. Are there any restraints impacting market growth?
Low-cost Trading Fee is Driving the Market; Increasing Popularity of Self-directed Investing.
8. Can you provide examples of recent developments in the market?
September 2023: HDFC Securities launched the discount brokerage platform Sky. Through a single fintech platform, the app provides users with a wide range of trading and investment possibilities, including global equities, IPOs, Indian stocks, ETFs, mutual funds, futures and options, currencies, and commodities.
9. What pricing options are available for accessing the report?
Pricing options include single-user, multi-user, and enterprise licenses priced at USD 4750, USD 5250, and USD 8750 respectively.
10. Is the market size provided in terms of value or volume?
The market size is provided in terms of value, measured in Million and volume, measured in Billion.
11. Are there any specific market keywords associated with the report?
Yes, the market keyword associated with the report is "Discount Brokerage Market," which aids in identifying and referencing the specific market segment covered.
12. How do I determine which pricing option suits my needs best?
The pricing options vary based on user requirements and access needs. Individual users may opt for single-user licenses, while businesses requiring broader access may choose multi-user or enterprise licenses for cost-effective access to the report.
13. Are there any additional resources or data provided in the Discount Brokerage Market report?
While the report offers comprehensive insights, it's advisable to review the specific contents or supplementary materials provided to ascertain if additional resources or data are available.
14. How can I stay updated on further developments or reports in the Discount Brokerage Market?
To stay informed about further developments, trends, and reports in the Discount Brokerage Market, consider subscribing to industry newsletters, following relevant companies and organizations, or regularly checking reputable industry news sources and publications.
Methodology
Step 1 - Identification of Relevant Samples Size from Population Database


Step 2 - Approaches for Defining Global Market Size (Value, Volume* & Price*)

Note*: In applicable scenarios
Step 3 - Data Sources
Primary Research
- Web Analytics
- Survey Reports
- Research Institute
- Latest Research Reports
- Opinion Leaders
Secondary Research
- Annual Reports
- White Paper
- Latest Press Release
- Industry Association
- Paid Database
- Investor Presentations

Step 4 - Data Triangulation
Involves using different sources of information in order to increase the validity of a study
These sources are likely to be stakeholders in a program - participants, other researchers, program staff, other community members, and so on.
Then we put all data in single framework & apply various statistical tools to find out the dynamic on the market.
During the analysis stage, feedback from the stakeholder groups would be compared to determine areas of agreement as well as areas of divergence