

Key Insights
The global Digital Graphic Printing market, valued at approximately $14.9 billion in 2025, is projected for significant expansion. The market is anticipated to grow at a Compound Annual Growth Rate (CAGR) of 1.7% from 2025 to 2033. This growth is propelled by escalating demand for personalized marketing collateral and high-quality packaging solutions across various industries. Inkjet printing technology is a primary driver, valued for its adaptability and superior image resolution on diverse substrates. The surge in e-commerce and on-demand printing services further amplifies the need for rapid turnaround and efficient production, solidifying digital graphic printing's role. The transactional printing segment, crucial for billing and essential documentation, also contributes to market expansion. Notably, security printing, essential for combating fraud and ensuring document integrity, is experiencing robust growth due to heightened concerns over counterfeit activities, driving the adoption of specialized digital printing solutions. Geographically, North America and Europe exhibit strong market performance, with Asia Pacific emerging as a rapidly developing region driven by rising disposable incomes and industrial advancements.
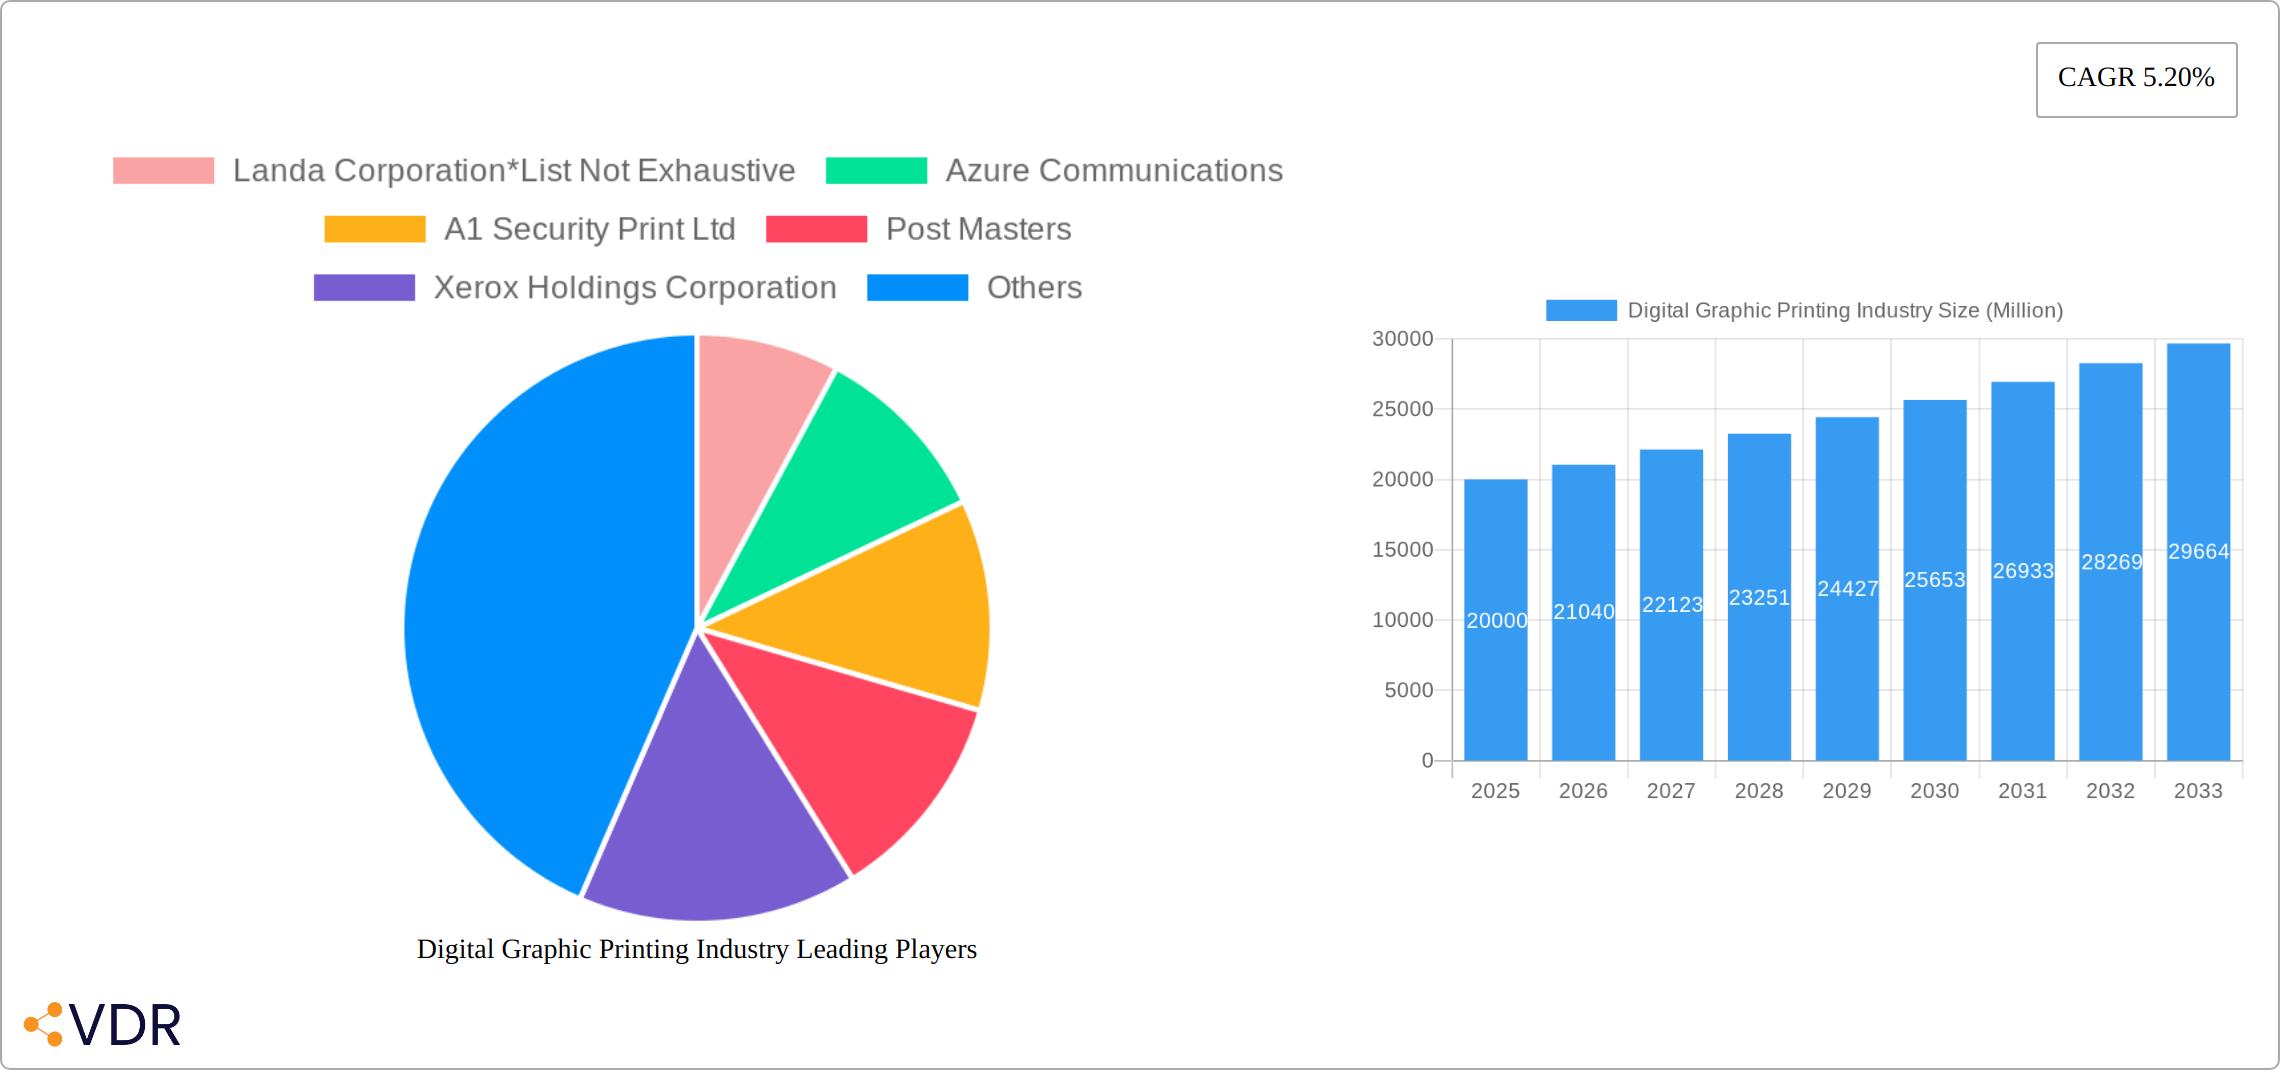
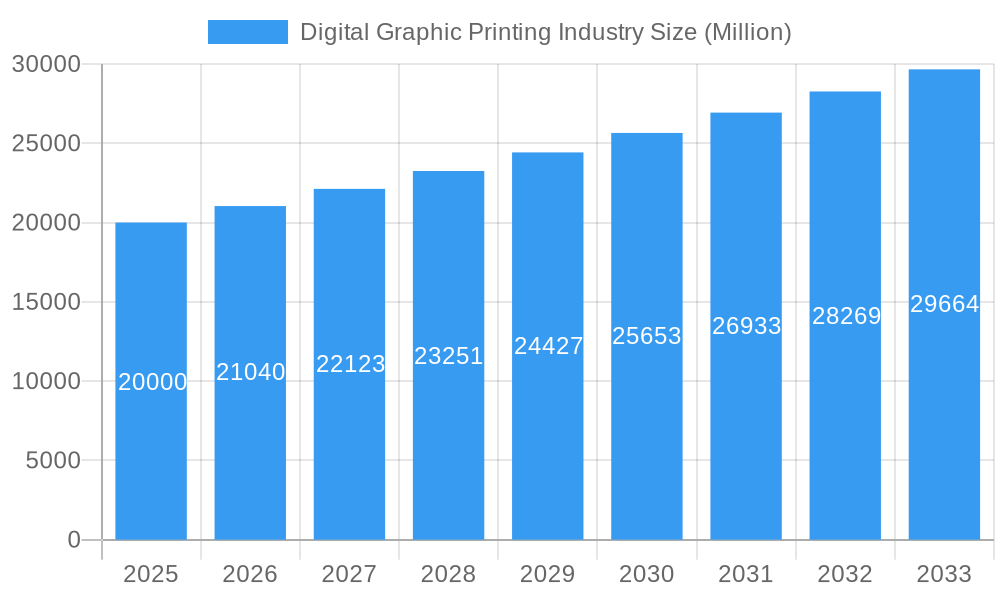
Digital Graphic Printing Industry Market Size (In Billion)
Despite positive growth trajectories, certain factors present challenges. The substantial initial capital investment required for advanced digital printing equipment can be a barrier for small and medium-sized enterprises. Competition from established offset printing, particularly for high-volume projects, continues to influence market dynamics. Furthermore, volatility in raw material costs and environmental considerations surrounding ink disposal and waste management necessitate the development of innovative solutions and collaborative industry efforts. Addressing these challenges through sustainable printing practices and cost-effective strategies will be pivotal for sustained growth and long-term industry viability. Market segmentation reveals substantial opportunities within advertising, general commercial, and security printing sectors. Key industry players like Landa Corporation, Xerox Holdings Corporation, and Giesecke+Devrient Currency Technology GmbH are actively influencing the competitive landscape through innovation and strategic alliances. The forecast period (2025-2033) indicates continued expansion fueled by technological innovation and evolving market requirements, positioning the digital graphic printing sector for sustained development.
Digital Graphic Printing Industry Company Market Share
Digital Graphic Printing Industry Market Report: 2019-2033
This comprehensive report provides a detailed analysis of the Digital Graphic Printing Industry, encompassing market dynamics, growth trends, regional dominance, product landscape, key players, and future outlook. The study period covers 2019-2033, with 2025 as the base and estimated year. The forecast period spans 2025-2033, and the historical period encompasses 2019-2024. The report segments the market by printing process (Inkjet, Electrophotography) and application (Advertising Print, Transactional Printing, Security Printing, General Commercial Print), providing granular insights into each segment's performance and growth trajectory. Market values are expressed in millions of units.
Digital Graphic Printing Industry Market Dynamics & Structure
The digital graphic printing market presents a dynamic landscape characterized by a blend of established industry leaders and a vibrant ecosystem of specialized firms. Technological innovation remains the bedrock of this industry, with relentless advancements in inkjet and electrophotography technologies consistently redefining the benchmarks for speed, unparalleled print quality, and cost-efficiency. Navigating this evolving terrain requires keen attention to stringent regulatory frameworks, particularly those governing environmental impact and data security, which shape operational strategies and influence market practices. The industry also contends with competitive substitutes, such as the pervasive influence of digital signage and online advertising, necessitating a strategic adaptation of print's value proposition. Furthermore, evolving end-user demographics, marked by an increasing reliance on digital media consumption, directly impact demand patterns for various print applications. Mergers and acquisitions (M&A) activity, while moderate, plays a crucial role in consolidating market share, expanding product portfolios, and extending geographic reach through strategic alliances.
- Market Concentration: The market exhibits moderate concentration, with a discernible presence of key players. While specific market share percentages are dynamic, the top tier of companies significantly influences market trends.
- Technological Innovation: Continuous and rapid advancements in inkjet and electrophotography technologies are pivotal. These innovations are instrumental in driving improvements in printing speed, resolution, color accuracy, and overall operational efficiency.
- Regulatory Frameworks: Stringent environmental regulations, encompassing aspects like waste management and the use of sustainable materials, alongside data privacy laws, exert a substantial influence on operational costs, product development, and strategic decision-making.
- Competitive Substitutes: The growth and prevalence of digital signage and online advertising present significant competitive pressures, particularly impacting traditional print applications in sectors like advertising and point-of-sale.
- End-User Demographics: A discernible shift in end-user preferences towards digital media consumption patterns influences demand for print. This trend necessitates a focus on personalized, on-demand, and highly targeted print solutions.
- M&A Activity: The digital graphic printing industry has witnessed strategic M&A activities, with a focus on acquiring complementary technologies, expanding market reach, and integrating innovative solutions to enhance competitive positioning.
Digital Graphic Printing Industry Growth Trends & Insights
The digital graphic printing market experienced significant growth during the historical period (2019-2024), driven by increasing demand for high-quality, personalized prints across various applications. The market size expanded from xx million units in 2019 to xx million units in 2024, exhibiting a CAGR of xx%. Adoption rates have steadily increased, particularly in sectors like transactional printing and advertising. Technological disruptions, such as the introduction of high-speed inkjet presses and improved electrophotography systems, have propelled market expansion. Consumer behavior shifts, including a growing preference for personalized marketing materials and on-demand printing, have also contributed to market growth. The forecast period (2025-2033) anticipates continued growth, driven by the increasing adoption of advanced printing technologies and the expanding use of digital printing in various sectors. Market penetration is expected to reach xx% by 2033.
Dominant Regions, Countries, or Segments in Digital Graphic Printing Industry
North America currently holds the largest market share in the digital graphic printing industry, followed by Europe and Asia-Pacific. Within printing processes, inkjet printing is experiencing faster growth compared to electrophotography, primarily driven by its versatility and ability to handle diverse substrates. In terms of application, transactional printing accounts for the largest market share due to consistent demand from financial institutions and government agencies.
- Key Drivers for North America: Strong economic growth, advanced infrastructure, and high adoption of digital technologies.
- Key Drivers for Inkjet Printing: Superior print quality on various substrates, high-speed printing capabilities, and cost-effectiveness for large-volume printing.
- Key Drivers for Transactional Printing: Consistent demand from banks, government agencies, and other organizations for personalized documents and statements.
- Growth Potential: Asia-Pacific is anticipated to witness substantial growth due to increasing industrialization and rising disposable incomes.
Digital Graphic Printing Industry Product Landscape
The digital graphic printing market boasts a comprehensive and ever-expanding product portfolio. This includes a wide array of solutions, from high-speed, industrial-grade inkjet printers designed for large-volume production, to sophisticated electrophotographic presses delivering exceptional quality for diverse applications, and a range of specialized finishing equipment that adds value and customization to printed outputs. Recent product innovations are heavily concentrated on elevating print quality to near-photographic levels, significantly enhancing printing speeds to meet demanding production schedules, and broadening the versatility to accommodate an ever-wider spectrum of substrates, from traditional papers to novel materials like textiles and plastics. Key unique selling propositions (USPs) that differentiate offerings include the integration of intelligent, automated workflow solutions that streamline production, the development and widespread adoption of eco-friendly inks and sustainable printing processes, and the implementation of robust cloud-based printing management systems that offer scalability and remote control capabilities. Underpinning these advancements are continuous technological breakthroughs in areas such as next-generation printhead technology, innovative ink formulations with enhanced durability and color gamut, and sophisticated image processing algorithms that contribute directly to superior overall performance metrics, including faster print times, higher resolutions, and a more favorable cost per print.
Key Drivers, Barriers & Challenges in Digital Graphic Printing Industry
Key Drivers:
- Technological advancements: High-speed inkjet, improved electrophotography.
- Growing demand for personalized marketing and packaging.
- Increasing adoption of digital printing in various sectors.
Key Challenges:
- Intense competition: Price wars and market share struggles.
- Supply chain disruptions: Raw material shortages and logistical bottlenecks impacting production.
- Regulatory hurdles: Environmental regulations and data privacy concerns.
- Economic downturns: Reduced marketing budgets impacting demand for advertising prints. An estimated xx% reduction in demand was observed during the 2020 economic downturn.
Emerging Opportunities in Digital Graphic Printing Industry
- Expansion into new markets: Significant untapped potential exists in rapidly developing economies and niche industries requiring specialized print solutions.
- Innovative applications: Growth is being fueled by the increasing demand for personalized packaging that enhances brand engagement, the burgeoning field of 3D printing for rapid prototyping and custom manufacturing, and the vibrant textile printing sector for fashion and interior design.
- Sustainable printing solutions: A strong and growing demand for environmentally conscious printing practices, including the use of biodegradable inks, recycled substrates, and energy-efficient printing processes.
- Integration of AI and automation: The strategic implementation of Artificial Intelligence (AI) and advanced automation technologies to optimize workflows, predict maintenance needs, improve color management, and enhance overall production efficiency.
- Personalization and Variable Data Printing (VDP): Leveraging digital capabilities to create highly personalized print materials for marketing, direct mail, and transactional documents, leading to increased engagement and ROI.
- Augmented Reality (AR) integration: Exploring opportunities to integrate AR experiences with printed materials, bridging the gap between the physical and digital worlds for enhanced customer interaction.
Growth Accelerators in the Digital Graphic Printing Industry
Technological breakthroughs, especially in inkjet technology and automation, are expected to be major growth accelerators. Strategic partnerships between printing equipment manufacturers and software developers will create integrated workflow solutions, enhancing efficiency and reducing costs. Market expansion into emerging economies and new applications like 3D printing and flexible substrates will further fuel industry growth.
Key Players Shaping the Digital Graphic Printing Industry Market
- Landa Corporation
- Azure Communications
- A1 Security Print Ltd
- Post Masters
- Xerox Holdings Corporation
- Giesecke+Devrient Currency Technology GmbH
- Madras Security Printers Pvt Ltd
- Swiss Post Solutions
Notable Milestones in Digital Graphic Printing Industry Sector
- 2020: The global pandemic spurred a significant acceleration in the adoption of contactless printing solutions and a heightened focus on hygiene-related printing applications.
- 2021: The market witnessed the introduction of several groundbreaking high-speed inkjet printers, boasting enhanced features, improved productivity, and expanded media handling capabilities.
- 2022: Substantial investments were channeled into research and development (R&D) initiatives, with a strong emphasis on advancing sustainable printing technologies and eco-friendly materials.
- 2023: The year was marked by a series of strategic mergers and acquisitions, aimed at consolidating market share, expanding product portfolios, and integrating innovative technologies to gain a competitive edge.
- Early 2024: Increased focus on developing integrated hardware and software solutions to offer end-to-end print management and workflow optimization.
In-Depth Digital Graphic Printing Industry Market Outlook
The future trajectory of the digital graphic printing market is exceptionally promising, propelled by a synergistic interplay of continuous technological advancements, the exploration of novel and expanding applications, and a growing consumer and business demand for personalized, on-demand, and inherently sustainable printing solutions. Strategic partnerships between technology providers, material suppliers, and end-users will be instrumental in fostering innovation and creating synergistic opportunities. Significant investments in research and development (R&D) are poised to unlock the potential for groundbreaking products and services that address evolving market needs. The market is projected to experience robust and sustained growth over the forthcoming forecast period, presenting substantial and diverse opportunities for both established industry leaders and agile new entrants alike. In an increasingly environmentally conscious world, the unwavering focus on developing and implementing sustainable and highly efficient printing solutions will be paramount for achieving long-term success, profitability, and a positive industry reputation.
Digital Graphic Printing Industry Segmentation
-
1. Printing Process
- 1.1. Inkjet
- 1.2. Electrophotography
-
2. Application
- 2.1. Advertising Print
- 2.2. Transactional Printing
- 2.3. Security Printing
- 2.4. General Commercial Print
Digital Graphic Printing Industry Segmentation By Geography
-
1. North America
- 1.1. United States
- 1.2. Canada
-
2. Europe
- 2.1. United kingdom
- 2.2. Germany
- 2.3. France
- 2.4. Spain
- 2.5. Italy
- 2.6. Poland
- 2.7. Netherlands
- 2.8. Rest of Europe
-
3. Asia Pacific
- 3.1. China
- 3.2. India
- 3.3. Japan
- 3.4. Rest of Asia Pacific
- 4. Latin America
- 5. Middle East and Africa
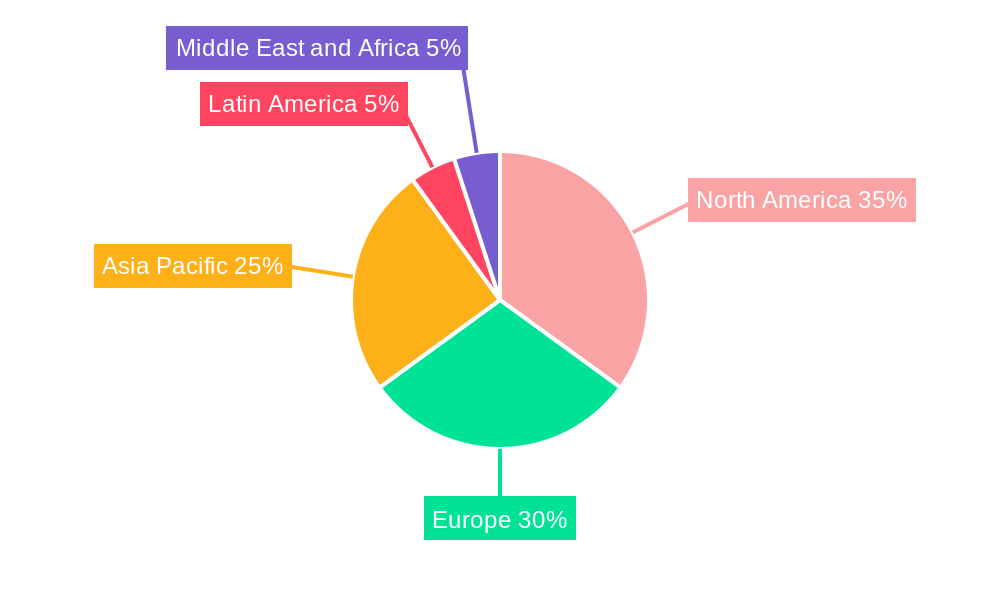
Digital Graphic Printing Industry Regional Market Share
Geographic Coverage of Digital Graphic Printing Industry
Digital Graphic Printing Industry REPORT HIGHLIGHTS
| Aspects | Details |
|---|---|
| Study Period | 2020-2034 |
| Base Year | 2025 |
| Estimated Year | 2026 |
| Forecast Period | 2026-2034 |
| Historical Period | 2020-2025 |
| Growth Rate | CAGR of 1.7% from 2020-2034 |
| Segmentation |
|
Table of Contents
- 1. Introduction
- 1.1. Research Scope
- 1.2. Market Segmentation
- 1.3. Research Objective
- 1.4. Definitions and Assumptions
- 2. Executive Summary
- 2.1. Market Snapshot
- 3. Market Dynamics
- 3.1. Market Drivers
- 3.2. Market Restrains
- 3.3. Market Trends
- 3.4. Market Opportunities
- 4. Market Factor Analysis
- 4.1. Porters Five Forces
- 4.1.1. Bargaining Power of Suppliers
- 4.1.2. Bargaining Power of Buyers
- 4.1.3. Threat of New Entrants
- 4.1.4. Threat of Substitutes
- 4.1.5. Competitive Rivalry
- 4.2. PESTEL analysis
- 4.3. BCG Analysis
- 4.3.1. Stars (High Growth, High Market Share)
- 4.3.2. Cash Cows (Low Growth, High Market Share)
- 4.3.3. Question Mark (High Growth, Low Market Share)
- 4.3.4. Dogs (Low Growth, Low Market Share)
- 4.4. Ansoff Matrix Analysis
- 4.5. Supply Chain Analysis
- 4.6. Regulatory Landscape
- 4.7. Current Market Potential and Opportunity Assessment (TAM–SAM–SOM Framework)
- 4.8. VDR Analyst Note
- 4.1. Porters Five Forces
- 5. Market Analysis, Insights and Forecast 2021-2033
- 5.1. Market Analysis, Insights and Forecast - by Printing Process
- 5.1.1. Inkjet
- 5.1.2. Electrophotography
- 5.2. Market Analysis, Insights and Forecast - by Application
- 5.2.1. Advertising Print
- 5.2.2. Transactional Printing
- 5.2.3. Security Printing
- 5.2.4. General Commercial Print
- 5.3. Market Analysis, Insights and Forecast - by Region
- 5.3.1. North America
- 5.3.2. Europe
- 5.3.3. Asia Pacific
- 5.3.4. Latin America
- 5.3.5. Middle East and Africa
- 5.1. Market Analysis, Insights and Forecast - by Printing Process
- 6. Global Digital Graphic Printing Industry Analysis, Insights and Forecast, 2021-2033
- 6.1. Market Analysis, Insights and Forecast - by Printing Process
- 6.1.1. Inkjet
- 6.1.2. Electrophotography
- 6.2. Market Analysis, Insights and Forecast - by Application
- 6.2.1. Advertising Print
- 6.2.2. Transactional Printing
- 6.2.3. Security Printing
- 6.2.4. General Commercial Print
- 6.1. Market Analysis, Insights and Forecast - by Printing Process
- 7. North America Digital Graphic Printing Industry Analysis, Insights and Forecast, 2021-2033
- 7.1. Market Analysis, Insights and Forecast - by Printing Process
- 7.1.1. Inkjet
- 7.1.2. Electrophotography
- 7.2. Market Analysis, Insights and Forecast - by Application
- 7.2.1. Advertising Print
- 7.2.2. Transactional Printing
- 7.2.3. Security Printing
- 7.2.4. General Commercial Print
- 7.1. Market Analysis, Insights and Forecast - by Printing Process
- 8. Europe Digital Graphic Printing Industry Analysis, Insights and Forecast, 2021-2033
- 8.1. Market Analysis, Insights and Forecast - by Printing Process
- 8.1.1. Inkjet
- 8.1.2. Electrophotography
- 8.2. Market Analysis, Insights and Forecast - by Application
- 8.2.1. Advertising Print
- 8.2.2. Transactional Printing
- 8.2.3. Security Printing
- 8.2.4. General Commercial Print
- 8.1. Market Analysis, Insights and Forecast - by Printing Process
- 9. Asia Pacific Digital Graphic Printing Industry Analysis, Insights and Forecast, 2021-2033
- 9.1. Market Analysis, Insights and Forecast - by Printing Process
- 9.1.1. Inkjet
- 9.1.2. Electrophotography
- 9.2. Market Analysis, Insights and Forecast - by Application
- 9.2.1. Advertising Print
- 9.2.2. Transactional Printing
- 9.2.3. Security Printing
- 9.2.4. General Commercial Print
- 9.1. Market Analysis, Insights and Forecast - by Printing Process
- 10. Latin America Digital Graphic Printing Industry Analysis, Insights and Forecast, 2021-2033
- 10.1. Market Analysis, Insights and Forecast - by Printing Process
- 10.1.1. Inkjet
- 10.1.2. Electrophotography
- 10.2. Market Analysis, Insights and Forecast - by Application
- 10.2.1. Advertising Print
- 10.2.2. Transactional Printing
- 10.2.3. Security Printing
- 10.2.4. General Commercial Print
- 10.1. Market Analysis, Insights and Forecast - by Printing Process
- 11. Middle East and Africa Digital Graphic Printing Industry Analysis, Insights and Forecast, 2021-2033
- 11.1. Market Analysis, Insights and Forecast - by Printing Process
- 11.1.1. Inkjet
- 11.1.2. Electrophotography
- 11.2. Market Analysis, Insights and Forecast - by Application
- 11.2.1. Advertising Print
- 11.2.2. Transactional Printing
- 11.2.3. Security Printing
- 11.2.4. General Commercial Print
- 11.1. Market Analysis, Insights and Forecast - by Printing Process
- 12. Competitive Analysis
- 12.1. Company Profiles
- 12.1.1 Landa Corporation*List Not Exhaustive
- 12.1.1.1. Company Overview
- 12.1.1.2. Products
- 12.1.1.3. Company Financials
- 12.1.1.4. SWOT Analysis
- 12.1.2 Azure Communications
- 12.1.2.1. Company Overview
- 12.1.2.2. Products
- 12.1.2.3. Company Financials
- 12.1.2.4. SWOT Analysis
- 12.1.3 A1 Security Print Ltd
- 12.1.3.1. Company Overview
- 12.1.3.2. Products
- 12.1.3.3. Company Financials
- 12.1.3.4. SWOT Analysis
- 12.1.4 Post Masters
- 12.1.4.1. Company Overview
- 12.1.4.2. Products
- 12.1.4.3. Company Financials
- 12.1.4.4. SWOT Analysis
- 12.1.5 Xerox Holdings Corporation
- 12.1.5.1. Company Overview
- 12.1.5.2. Products
- 12.1.5.3. Company Financials
- 12.1.5.4. SWOT Analysis
- 12.1.6 Giesecke+Devrient Currency Technology GmbH
- 12.1.6.1. Company Overview
- 12.1.6.2. Products
- 12.1.6.3. Company Financials
- 12.1.6.4. SWOT Analysis
- 12.1.7 Madras Security Printers Pvt Ltd
- 12.1.7.1. Company Overview
- 12.1.7.2. Products
- 12.1.7.3. Company Financials
- 12.1.7.4. SWOT Analysis
- 12.1.8 Swiss Post Solutions
- 12.1.8.1. Company Overview
- 12.1.8.2. Products
- 12.1.8.3. Company Financials
- 12.1.8.4. SWOT Analysis
- 12.1.1 Landa Corporation*List Not Exhaustive
- 12.2. Market Entropy
- 12.2.1 Company's Key Areas Served
- 12.2.2 Recent Developments
- 12.3. Company Market Share Analysis 2025
- 12.3.1 Top 5 Companies Market Share Analysis
- 12.3.2 Top 3 Companies Market Share Analysis
- 12.4. List of Potential Customers
- 13. Research Methodology
List of Figures
- Figure 1: Global Digital Graphic Printing Industry Revenue Breakdown (billion, %) by Region 2025 & 2033
- Figure 2: North America Digital Graphic Printing Industry Revenue (billion), by Printing Process 2025 & 2033
- Figure 3: North America Digital Graphic Printing Industry Revenue Share (%), by Printing Process 2025 & 2033
- Figure 4: North America Digital Graphic Printing Industry Revenue (billion), by Application 2025 & 2033
- Figure 5: North America Digital Graphic Printing Industry Revenue Share (%), by Application 2025 & 2033
- Figure 6: North America Digital Graphic Printing Industry Revenue (billion), by Country 2025 & 2033
- Figure 7: North America Digital Graphic Printing Industry Revenue Share (%), by Country 2025 & 2033
- Figure 8: Europe Digital Graphic Printing Industry Revenue (billion), by Printing Process 2025 & 2033
- Figure 9: Europe Digital Graphic Printing Industry Revenue Share (%), by Printing Process 2025 & 2033
- Figure 10: Europe Digital Graphic Printing Industry Revenue (billion), by Application 2025 & 2033
- Figure 11: Europe Digital Graphic Printing Industry Revenue Share (%), by Application 2025 & 2033
- Figure 12: Europe Digital Graphic Printing Industry Revenue (billion), by Country 2025 & 2033
- Figure 13: Europe Digital Graphic Printing Industry Revenue Share (%), by Country 2025 & 2033
- Figure 14: Asia Pacific Digital Graphic Printing Industry Revenue (billion), by Printing Process 2025 & 2033
- Figure 15: Asia Pacific Digital Graphic Printing Industry Revenue Share (%), by Printing Process 2025 & 2033
- Figure 16: Asia Pacific Digital Graphic Printing Industry Revenue (billion), by Application 2025 & 2033
- Figure 17: Asia Pacific Digital Graphic Printing Industry Revenue Share (%), by Application 2025 & 2033
- Figure 18: Asia Pacific Digital Graphic Printing Industry Revenue (billion), by Country 2025 & 2033
- Figure 19: Asia Pacific Digital Graphic Printing Industry Revenue Share (%), by Country 2025 & 2033
- Figure 20: Latin America Digital Graphic Printing Industry Revenue (billion), by Printing Process 2025 & 2033
- Figure 21: Latin America Digital Graphic Printing Industry Revenue Share (%), by Printing Process 2025 & 2033
- Figure 22: Latin America Digital Graphic Printing Industry Revenue (billion), by Application 2025 & 2033
- Figure 23: Latin America Digital Graphic Printing Industry Revenue Share (%), by Application 2025 & 2033
- Figure 24: Latin America Digital Graphic Printing Industry Revenue (billion), by Country 2025 & 2033
- Figure 25: Latin America Digital Graphic Printing Industry Revenue Share (%), by Country 2025 & 2033
- Figure 26: Middle East and Africa Digital Graphic Printing Industry Revenue (billion), by Printing Process 2025 & 2033
- Figure 27: Middle East and Africa Digital Graphic Printing Industry Revenue Share (%), by Printing Process 2025 & 2033
- Figure 28: Middle East and Africa Digital Graphic Printing Industry Revenue (billion), by Application 2025 & 2033
- Figure 29: Middle East and Africa Digital Graphic Printing Industry Revenue Share (%), by Application 2025 & 2033
- Figure 30: Middle East and Africa Digital Graphic Printing Industry Revenue (billion), by Country 2025 & 2033
- Figure 31: Middle East and Africa Digital Graphic Printing Industry Revenue Share (%), by Country 2025 & 2033
List of Tables
- Table 1: Global Digital Graphic Printing Industry Revenue billion Forecast, by Printing Process 2020 & 2033
- Table 2: Global Digital Graphic Printing Industry Revenue billion Forecast, by Application 2020 & 2033
- Table 3: Global Digital Graphic Printing Industry Revenue billion Forecast, by Region 2020 & 2033
- Table 4: Global Digital Graphic Printing Industry Revenue billion Forecast, by Printing Process 2020 & 2033
- Table 5: Global Digital Graphic Printing Industry Revenue billion Forecast, by Application 2020 & 2033
- Table 6: Global Digital Graphic Printing Industry Revenue billion Forecast, by Country 2020 & 2033
- Table 7: United States Digital Graphic Printing Industry Revenue (billion) Forecast, by Application 2020 & 2033
- Table 8: Canada Digital Graphic Printing Industry Revenue (billion) Forecast, by Application 2020 & 2033
- Table 9: Global Digital Graphic Printing Industry Revenue billion Forecast, by Printing Process 2020 & 2033
- Table 10: Global Digital Graphic Printing Industry Revenue billion Forecast, by Application 2020 & 2033
- Table 11: Global Digital Graphic Printing Industry Revenue billion Forecast, by Country 2020 & 2033
- Table 12: United kingdom Digital Graphic Printing Industry Revenue (billion) Forecast, by Application 2020 & 2033
- Table 13: Germany Digital Graphic Printing Industry Revenue (billion) Forecast, by Application 2020 & 2033
- Table 14: France Digital Graphic Printing Industry Revenue (billion) Forecast, by Application 2020 & 2033
- Table 15: Spain Digital Graphic Printing Industry Revenue (billion) Forecast, by Application 2020 & 2033
- Table 16: Italy Digital Graphic Printing Industry Revenue (billion) Forecast, by Application 2020 & 2033
- Table 17: Poland Digital Graphic Printing Industry Revenue (billion) Forecast, by Application 2020 & 2033
- Table 18: Netherlands Digital Graphic Printing Industry Revenue (billion) Forecast, by Application 2020 & 2033
- Table 19: Rest of Europe Digital Graphic Printing Industry Revenue (billion) Forecast, by Application 2020 & 2033
- Table 20: Global Digital Graphic Printing Industry Revenue billion Forecast, by Printing Process 2020 & 2033
- Table 21: Global Digital Graphic Printing Industry Revenue billion Forecast, by Application 2020 & 2033
- Table 22: Global Digital Graphic Printing Industry Revenue billion Forecast, by Country 2020 & 2033
- Table 23: China Digital Graphic Printing Industry Revenue (billion) Forecast, by Application 2020 & 2033
- Table 24: India Digital Graphic Printing Industry Revenue (billion) Forecast, by Application 2020 & 2033
- Table 25: Japan Digital Graphic Printing Industry Revenue (billion) Forecast, by Application 2020 & 2033
- Table 26: Rest of Asia Pacific Digital Graphic Printing Industry Revenue (billion) Forecast, by Application 2020 & 2033
- Table 27: Global Digital Graphic Printing Industry Revenue billion Forecast, by Printing Process 2020 & 2033
- Table 28: Global Digital Graphic Printing Industry Revenue billion Forecast, by Application 2020 & 2033
- Table 29: Global Digital Graphic Printing Industry Revenue billion Forecast, by Country 2020 & 2033
- Table 30: Global Digital Graphic Printing Industry Revenue billion Forecast, by Printing Process 2020 & 2033
- Table 31: Global Digital Graphic Printing Industry Revenue billion Forecast, by Application 2020 & 2033
- Table 32: Global Digital Graphic Printing Industry Revenue billion Forecast, by Country 2020 & 2033
Frequently Asked Questions
1. What is the projected Compound Annual Growth Rate (CAGR) of the Digital Graphic Printing Industry?
The projected CAGR is approximately 1.7%.
2. Which companies are prominent players in the Digital Graphic Printing Industry?
Key companies in the market include Landa Corporation*List Not Exhaustive, Azure Communications, A1 Security Print Ltd, Post Masters, Xerox Holdings Corporation, Giesecke+Devrient Currency Technology GmbH, Madras Security Printers Pvt Ltd, Swiss Post Solutions.
3. What are the main segments of the Digital Graphic Printing Industry?
The market segments include Printing Process, Application.
4. Can you provide details about the market size?
The market size is estimated to be USD 14.9 billion as of 2022.
5. What are some drivers contributing to market growth?
Glass containers for food and beverages are 100% recyclable and hence can be recycled endlessly without loss in quality or purity - something few food and beverage packaging options can claim. Manufacturers benefit from recycling in several ways: Recycled glass reduces emissions and consumption of raw materials. extends the life of plant equipment. such as furnaces. and saves energy.; The growth in population in the country in the recent years has led to a rise in the building & construction sector where soda-lime-silica-based glass is used in windowpanes. owing to their hardness and ease of workability..
6. What are the notable trends driving market growth?
Inkjet Printing Process is Expected to Hold a Significant Share in the Market Over the Forecast Period.
7. Are there any restraints impacting market growth?
However. container glass is manufactured by a process called annealing in which different air polluting compounds such as nitrogen oxides. sulfur dioxides. and other harmful particulates are released. Exposure to these harmful compounds at high concentrations can cause severe respiratory diseases such as asthma. chronic bronchitis. mucus secretion. and lung cancer..
8. Can you provide examples of recent developments in the market?
N/A
9. What pricing options are available for accessing the report?
Pricing options include single-user, multi-user, and enterprise licenses priced at USD 4750, USD 5250, and USD 8750 respectively.
10. Is the market size provided in terms of value or volume?
The market size is provided in terms of value, measured in billion.
11. Are there any specific market keywords associated with the report?
Yes, the market keyword associated with the report is "Digital Graphic Printing Industry," which aids in identifying and referencing the specific market segment covered.
12. How do I determine which pricing option suits my needs best?
The pricing options vary based on user requirements and access needs. Individual users may opt for single-user licenses, while businesses requiring broader access may choose multi-user or enterprise licenses for cost-effective access to the report.
13. Are there any additional resources or data provided in the Digital Graphic Printing Industry report?
While the report offers comprehensive insights, it's advisable to review the specific contents or supplementary materials provided to ascertain if additional resources or data are available.
14. How can I stay updated on further developments or reports in the Digital Graphic Printing Industry?
To stay informed about further developments, trends, and reports in the Digital Graphic Printing Industry, consider subscribing to industry newsletters, following relevant companies and organizations, or regularly checking reputable industry news sources and publications.
Methodology
Step 1 - Identification of Relevant Samples Size from Population Database


Step 2 - Approaches for Defining Global Market Size (Value, Volume* & Price*)

Note*: In applicable scenarios
Step 3 - Data Sources
Primary Research
- Web Analytics
- Survey Reports
- Research Institute
- Latest Research Reports
- Opinion Leaders
Secondary Research
- Annual Reports
- White Paper
- Latest Press Release
- Industry Association
- Paid Database
- Investor Presentations

Step 4 - Data Triangulation
Involves using different sources of information in order to increase the validity of a study
These sources are likely to be stakeholders in a program - participants, other researchers, program staff, other community members, and so on.
Then we put all data in single framework & apply various statistical tools to find out the dynamic on the market.
During the analysis stage, feedback from the stakeholder groups would be compared to determine areas of agreement as well as areas of divergence