
Key Insights
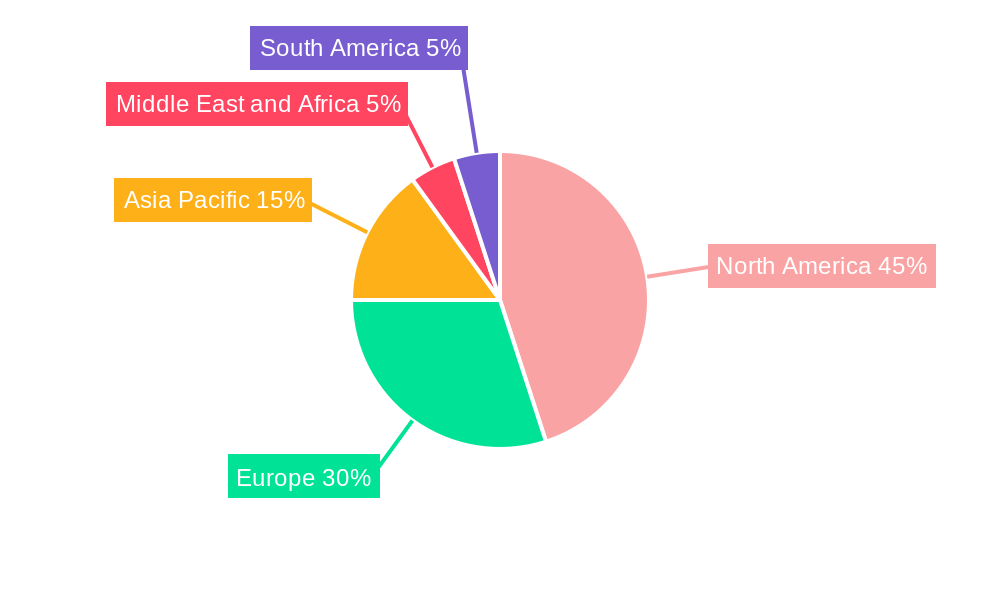
The digital biomarkers market is experiencing robust growth, driven by the increasing prevalence of chronic diseases, advancements in wearable technology, and the rising adoption of telehealth. The market's compound annual growth rate (CAGR) of 20.50% from 2019 to 2024 indicates significant expansion. This growth is fueled by several key factors: the ability of digital biomarkers to provide earlier and more accurate diagnoses, leading to improved patient outcomes and reduced healthcare costs; the increasing availability of sophisticated data collection and integration tools that facilitate the efficient processing and analysis of large datasets; and the expanding regulatory landscape, which encourages the development and validation of digital biomarkers. The pharmaceutical and healthcare sectors are major drivers, actively integrating digital biomarkers into clinical trials and personalized medicine initiatives. Different therapeutic areas, such as cardiovascular and metabolic disorders, are significantly adopting this technology due to the potential for improved disease management and treatment efficacy. Segmentation by end-user (pharmaceutical companies, healthcare providers, payers) and by type of tool (data collection, integration) showcases the diversity and opportunities within the market. The North American region currently holds a substantial market share, owing to its advanced healthcare infrastructure and early adoption of digital health technologies, followed by Europe and the Asia-Pacific region.
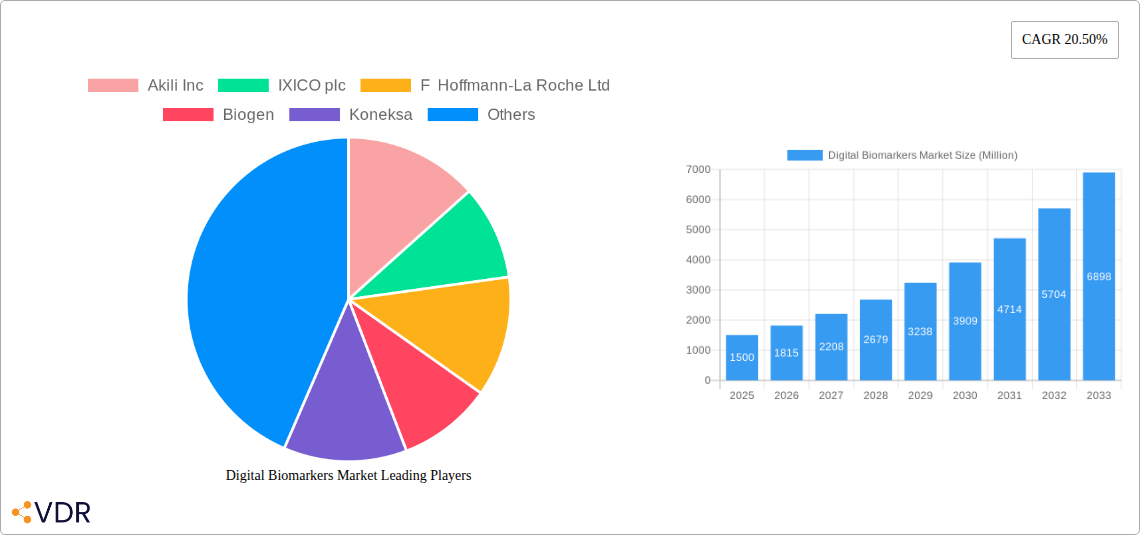
Looking ahead to 2033, the market is projected to continue its strong trajectory, with ongoing technological innovation and expanding applications across various therapeutic areas expected to fuel further growth. However, challenges remain, including data privacy and security concerns, regulatory hurdles related to the validation and approval of digital biomarkers, and the need for standardization and interoperability across different platforms. Despite these challenges, the market's substantial growth potential is undeniable, driven by the increasing demand for efficient and cost-effective healthcare solutions and the potential for revolutionizing disease management through personalized medicine. Companies such as Akili Inc, IXICO plc, and Roche are at the forefront of innovation, leading the development and commercialization of digital biomarker technologies.
Digital Biomarkers Market: A Comprehensive Report (2019-2033)
This in-depth report provides a comprehensive analysis of the Digital Biomarkers Market, encompassing market dynamics, growth trends, regional segmentation, product landscape, key players, and future outlook. The study period covers 2019-2033, with 2025 as the base year and a forecast period of 2025-2033. This report is essential for pharmaceutical companies, healthcare providers, payers, technology developers, and investors seeking to understand and capitalize on the rapidly evolving digital biomarkers landscape. The parent market is the broader healthcare technology sector, while the child market focuses specifically on digital tools for biomarker analysis. The market size is projected to reach xx Million by 2033.
Digital Biomarkers Market Dynamics & Structure
The Digital Biomarkers Market is characterized by a moderately concentrated landscape, with key players such as Akili Inc, IXICO plc, F. Hoffmann-La Roche Ltd, and Biogen holding significant market share. Technological innovation, particularly in AI and machine learning for data analysis, is a major driver. Regulatory frameworks, including those surrounding data privacy and clinical validation, play a crucial role. Competition from traditional biomarker methods and the emergence of new technologies represent key challenges. Mergers and acquisitions (M&A) activity is expected to increase, driven by the need for companies to expand their product portfolios and market reach.
- Market Concentration: Moderately concentrated, with top 5 players holding approximately xx% market share in 2025.
- Technological Innovation: AI, machine learning, and wearable sensor technology are key innovation drivers.
- Regulatory Landscape: Stringent regulations regarding data privacy (GDPR, HIPAA) and clinical validation pose challenges.
- Competitive Substitutes: Traditional laboratory-based biomarker testing remains a competitive substitute.
- M&A Activity: Increasing M&A activity is predicted, with an estimated xx deals expected in the forecast period.
- End-User Demographics: Pharmaceutical companies are the largest end-users, followed by healthcare providers and payers.
Digital Biomarkers Market Growth Trends & Insights
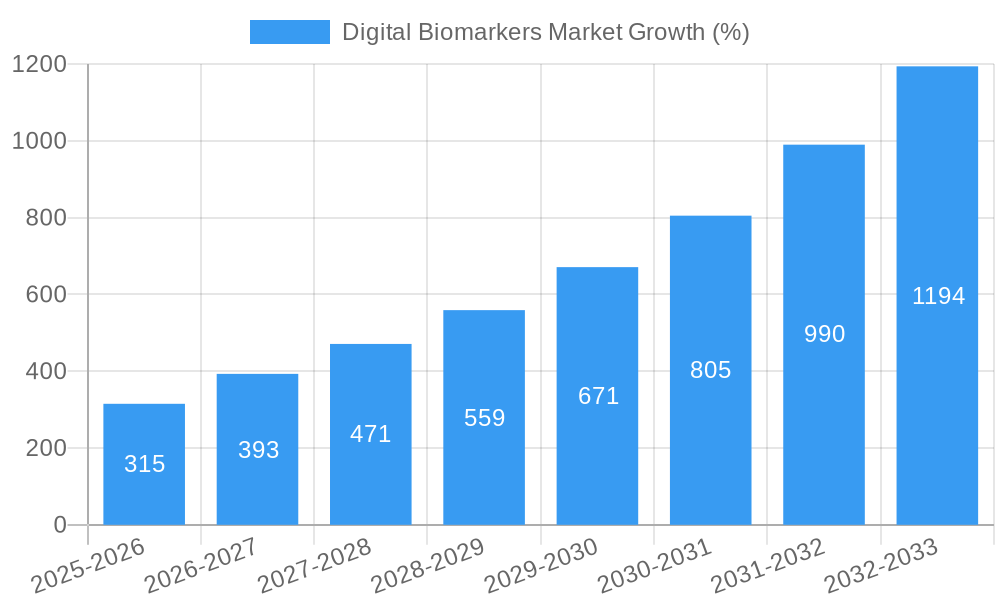
The Digital Biomarkers Market is experiencing robust growth, driven by increasing adoption of digital health technologies, rising prevalence of chronic diseases, and the need for more efficient and cost-effective diagnostic and monitoring tools. The market is expected to exhibit a CAGR of xx% during the forecast period (2025-2033), reaching an estimated market size of xx Million by 2033. This growth is fueled by technological advancements in data collection, analysis, and interpretation, leading to improved diagnostic accuracy, personalized medicine, and remote patient monitoring. Consumer behavior shifts towards proactive health management and the growing acceptance of telehealth are also contributing factors. Market penetration of digital biomarkers is expected to increase from xx% in 2025 to xx% by 2033.
Dominant Regions, Countries, or Segments in Digital Biomarkers Market
North America currently dominates the Digital Biomarkers Market, driven by advanced healthcare infrastructure, high adoption rates of digital technologies, and substantial investments in research and development. Within North America, the United States holds the largest market share. Europe is a significant market, with strong growth expected in Western Europe due to increasing healthcare spending and the adoption of digital health initiatives. Asia-Pacific is projected to experience the fastest growth rate in the forecast period, fueled by rising healthcare expenditure, expanding digital infrastructure, and increasing prevalence of chronic diseases.
- Dominant Region: North America (United States)
- Key Drivers (North America): Advanced healthcare infrastructure, high technological adoption, substantial R&D investments.
- Key Drivers (Europe): Increasing healthcare spending, digital health initiatives.
- Key Drivers (Asia-Pacific): Rising healthcare expenditure, expanding digital infrastructure, increasing prevalence of chronic diseases.
- High-Growth Segment: Predictive and Prognostic Digital Biomarkers, driven by the potential for early disease detection and personalized treatment.
Digital Biomarkers Market Product Landscape
The Digital Biomarkers Market encompasses a range of products, including data collection tools (wearable sensors, mobile apps), data integration tools (software platforms for data analysis), and clinical practice solutions (diagnostic, monitoring, predictive, and prognostic applications). Innovation focuses on improving data accuracy, reducing costs, and enhancing user experience. Unique selling propositions often involve integration with Electronic Health Records (EHRs) and the provision of actionable insights for clinical decision-making. Advances in AI and machine learning are enhancing the analytical capabilities of these products.
Key Drivers, Barriers & Challenges in Digital Biomarkers Market
Key Drivers:
- Increasing prevalence of chronic diseases.
- Growing demand for personalized medicine.
- Advancements in sensor technology and data analytics.
- Rising adoption of telehealth and remote patient monitoring.
Key Barriers and Challenges:
- High initial investment costs for technology and infrastructure.
- Data privacy and security concerns.
- Lack of standardization and interoperability across different platforms.
- Regulatory hurdles and clinical validation requirements. Approximately xx% of new digital biomarkers fail to obtain regulatory approval.
Emerging Opportunities in Digital Biomarkers Market
- Expanding applications in preventative care and wellness.
- Integration with other digital health technologies (e.g., AI-powered diagnostics).
- Development of digital biomarkers for rare diseases.
- Expansion into emerging markets with growing healthcare needs.
- The development of point-of-care diagnostics using digital biomarkers.
Growth Accelerators in the Digital Biomarkers Market Industry
Technological breakthroughs in AI and machine learning, coupled with strategic partnerships between technology companies and healthcare providers, are accelerating market growth. Expansion strategies that focus on integrating digital biomarkers into existing clinical workflows and expanding into untapped markets (such as preventative care) are also driving growth. Furthermore, increased funding for research and development in this field promises to further accelerate the market's expansion.
Key Players Shaping the Digital Biomarkers Market Market
- Akili Inc
- IXICO plc
- F Hoffmann-La Roche Ltd
- Biogen
- Koneksa
- Huma
- Fitbit Health Solutions
- AliveCor Inc
- ActiGraph LLC
- Empatica Inc
Notable Milestones in Digital Biomarkers Market Sector
- October 2022: Koneksa announced the launch of its clinical pipeline including biomarkers in neuroscience, oncology, respiratory, and other therapeutic areas.
- October 2022: Spren secured more than USD 11 million in seed capital to launch a camera-enabled biomarker platform.
In-Depth Digital Biomarkers Market Market Outlook
The Digital Biomarkers Market is poised for significant growth, driven by continued technological innovation, increasing adoption of digital health technologies, and the growing need for personalized and preventative healthcare solutions. Strategic partnerships, expansion into new therapeutic areas, and the development of new data analytics capabilities will further accelerate market growth. The market presents significant opportunities for companies that can effectively address the challenges related to data privacy, regulatory compliance, and clinical validation. The focus on proactive healthcare and the potential for early disease detection will continue to drive demand in the coming years.
Digital Biomarkers Market Segmentation
-
1. Type
- 1.1. Data Collection Tools
- 1.2. Data Integration Tools
-
2. Clinical Practice
- 2.1. Monitoring Digital Biomarkers
- 2.2. Diagnostic Digital Biomarkers
- 2.3. Predictive and Prognostic Digital Biomarkers
- 2.4. Others
-
3. Therapeutic Area
- 3.1. Cardiovascular and Metabolic Disorders
- 3.2. Respiratory Disorders
- 3.3. Neurological Disorders
- 3.4. Musculoskeletal Disorders
- 3.5. Others
-
4. End User
- 4.1. Pharmaceutical Companies
- 4.2. Healthcare Providers
- 4.3. Payers
- 4.4. Others
Digital Biomarkers Market Segmentation By Geography
-
1. North America
- 1.1. United States
- 1.2. Canada
- 1.3. Mexico
-
2. Europe
- 2.1. Germany
- 2.2. United Kingdom
- 2.3. France
- 2.4. Italy
- 2.5. Spain
- 2.6. Rest of Europe
-
3. Asia Pacific
- 3.1. China
- 3.2. Japan
- 3.3. India
- 3.4. Australia
- 3.5. South Korea
- 3.6. Rest of Asia Pacific
-
4. Middle East and Africa
- 4.1. GCC
- 4.2. South Africa
- 4.3. Rest of Middle East and Africa
-
5. South America
- 5.1. Brazil
- 5.2. Argentina
- 5.3. Rest of South America
Digital Biomarkers Market REPORT HIGHLIGHTS
| Aspects | Details |
|---|---|
| Study Period | 2019-2033 |
| Base Year | 2024 |
| Estimated Year | 2025 |
| Forecast Period | 2025-2033 |
| Historical Period | 2019-2024 |
| Growth Rate | CAGR of 20.50% from 2019-2033 |
| Segmentation |
|
Table of Contents
- 1. Introduction
- 1.1. Research Scope
- 1.2. Market Segmentation
- 1.3. Research Methodology
- 1.4. Definitions and Assumptions
- 2. Executive Summary
- 2.1. Introduction
- 3. Market Dynamics
- 3.1. Introduction
- 3.2. Market Drivers
- 3.2.1. Increasing Prevalence of Chronic Diseases; Growing Number of Clinical Trials; Technological Advancements in Digital Biomarkers
- 3.3. Market Restrains
- 3.3.1. High Product Cost; Data Security Concerns
- 3.4. Market Trends
- 3.4.1. Monitoring Digital Biomarkers Segment is Anticipated to Show Significant Growth Over the Forecast Period
- 4. Market Factor Analysis
- 4.1. Porters Five Forces
- 4.2. Supply/Value Chain
- 4.3. PESTEL analysis
- 4.4. Market Entropy
- 4.5. Patent/Trademark Analysis
- 5. Global Digital Biomarkers Market Analysis, Insights and Forecast, 2019-2031
- 5.1. Market Analysis, Insights and Forecast - by Type
- 5.1.1. Data Collection Tools
- 5.1.2. Data Integration Tools
- 5.2. Market Analysis, Insights and Forecast - by Clinical Practice
- 5.2.1. Monitoring Digital Biomarkers
- 5.2.2. Diagnostic Digital Biomarkers
- 5.2.3. Predictive and Prognostic Digital Biomarkers
- 5.2.4. Others
- 5.3. Market Analysis, Insights and Forecast - by Therapeutic Area
- 5.3.1. Cardiovascular and Metabolic Disorders
- 5.3.2. Respiratory Disorders
- 5.3.3. Neurological Disorders
- 5.3.4. Musculoskeletal Disorders
- 5.3.5. Others
- 5.4. Market Analysis, Insights and Forecast - by End User
- 5.4.1. Pharmaceutical Companies
- 5.4.2. Healthcare Providers
- 5.4.3. Payers
- 5.4.4. Others
- 5.5. Market Analysis, Insights and Forecast - by Region
- 5.5.1. North America
- 5.5.2. Europe
- 5.5.3. Asia Pacific
- 5.5.4. Middle East and Africa
- 5.5.5. South America
- 5.1. Market Analysis, Insights and Forecast - by Type
- 6. North America Digital Biomarkers Market Analysis, Insights and Forecast, 2019-2031
- 6.1. Market Analysis, Insights and Forecast - by Type
- 6.1.1. Data Collection Tools
- 6.1.2. Data Integration Tools
- 6.2. Market Analysis, Insights and Forecast - by Clinical Practice
- 6.2.1. Monitoring Digital Biomarkers
- 6.2.2. Diagnostic Digital Biomarkers
- 6.2.3. Predictive and Prognostic Digital Biomarkers
- 6.2.4. Others
- 6.3. Market Analysis, Insights and Forecast - by Therapeutic Area
- 6.3.1. Cardiovascular and Metabolic Disorders
- 6.3.2. Respiratory Disorders
- 6.3.3. Neurological Disorders
- 6.3.4. Musculoskeletal Disorders
- 6.3.5. Others
- 6.4. Market Analysis, Insights and Forecast - by End User
- 6.4.1. Pharmaceutical Companies
- 6.4.2. Healthcare Providers
- 6.4.3. Payers
- 6.4.4. Others
- 6.1. Market Analysis, Insights and Forecast - by Type
- 7. Europe Digital Biomarkers Market Analysis, Insights and Forecast, 2019-2031
- 7.1. Market Analysis, Insights and Forecast - by Type
- 7.1.1. Data Collection Tools
- 7.1.2. Data Integration Tools
- 7.2. Market Analysis, Insights and Forecast - by Clinical Practice
- 7.2.1. Monitoring Digital Biomarkers
- 7.2.2. Diagnostic Digital Biomarkers
- 7.2.3. Predictive and Prognostic Digital Biomarkers
- 7.2.4. Others
- 7.3. Market Analysis, Insights and Forecast - by Therapeutic Area
- 7.3.1. Cardiovascular and Metabolic Disorders
- 7.3.2. Respiratory Disorders
- 7.3.3. Neurological Disorders
- 7.3.4. Musculoskeletal Disorders
- 7.3.5. Others
- 7.4. Market Analysis, Insights and Forecast - by End User
- 7.4.1. Pharmaceutical Companies
- 7.4.2. Healthcare Providers
- 7.4.3. Payers
- 7.4.4. Others
- 7.1. Market Analysis, Insights and Forecast - by Type
- 8. Asia Pacific Digital Biomarkers Market Analysis, Insights and Forecast, 2019-2031
- 8.1. Market Analysis, Insights and Forecast - by Type
- 8.1.1. Data Collection Tools
- 8.1.2. Data Integration Tools
- 8.2. Market Analysis, Insights and Forecast - by Clinical Practice
- 8.2.1. Monitoring Digital Biomarkers
- 8.2.2. Diagnostic Digital Biomarkers
- 8.2.3. Predictive and Prognostic Digital Biomarkers
- 8.2.4. Others
- 8.3. Market Analysis, Insights and Forecast - by Therapeutic Area
- 8.3.1. Cardiovascular and Metabolic Disorders
- 8.3.2. Respiratory Disorders
- 8.3.3. Neurological Disorders
- 8.3.4. Musculoskeletal Disorders
- 8.3.5. Others
- 8.4. Market Analysis, Insights and Forecast - by End User
- 8.4.1. Pharmaceutical Companies
- 8.4.2. Healthcare Providers
- 8.4.3. Payers
- 8.4.4. Others
- 8.1. Market Analysis, Insights and Forecast - by Type
- 9. Middle East and Africa Digital Biomarkers Market Analysis, Insights and Forecast, 2019-2031
- 9.1. Market Analysis, Insights and Forecast - by Type
- 9.1.1. Data Collection Tools
- 9.1.2. Data Integration Tools
- 9.2. Market Analysis, Insights and Forecast - by Clinical Practice
- 9.2.1. Monitoring Digital Biomarkers
- 9.2.2. Diagnostic Digital Biomarkers
- 9.2.3. Predictive and Prognostic Digital Biomarkers
- 9.2.4. Others
- 9.3. Market Analysis, Insights and Forecast - by Therapeutic Area
- 9.3.1. Cardiovascular and Metabolic Disorders
- 9.3.2. Respiratory Disorders
- 9.3.3. Neurological Disorders
- 9.3.4. Musculoskeletal Disorders
- 9.3.5. Others
- 9.4. Market Analysis, Insights and Forecast - by End User
- 9.4.1. Pharmaceutical Companies
- 9.4.2. Healthcare Providers
- 9.4.3. Payers
- 9.4.4. Others
- 9.1. Market Analysis, Insights and Forecast - by Type
- 10. South America Digital Biomarkers Market Analysis, Insights and Forecast, 2019-2031
- 10.1. Market Analysis, Insights and Forecast - by Type
- 10.1.1. Data Collection Tools
- 10.1.2. Data Integration Tools
- 10.2. Market Analysis, Insights and Forecast - by Clinical Practice
- 10.2.1. Monitoring Digital Biomarkers
- 10.2.2. Diagnostic Digital Biomarkers
- 10.2.3. Predictive and Prognostic Digital Biomarkers
- 10.2.4. Others
- 10.3. Market Analysis, Insights and Forecast - by Therapeutic Area
- 10.3.1. Cardiovascular and Metabolic Disorders
- 10.3.2. Respiratory Disorders
- 10.3.3. Neurological Disorders
- 10.3.4. Musculoskeletal Disorders
- 10.3.5. Others
- 10.4. Market Analysis, Insights and Forecast - by End User
- 10.4.1. Pharmaceutical Companies
- 10.4.2. Healthcare Providers
- 10.4.3. Payers
- 10.4.4. Others
- 10.1. Market Analysis, Insights and Forecast - by Type
- 11. North America Digital Biomarkers Market Analysis, Insights and Forecast, 2019-2031
- 11.1. Market Analysis, Insights and Forecast - By Country/Sub-region
- 11.1.1. undefined
- 12. Europe Digital Biomarkers Market Analysis, Insights and Forecast, 2019-2031
- 12.1. Market Analysis, Insights and Forecast - By Country/Sub-region
- 12.1.1. undefined
- 13. Asia Pacific Digital Biomarkers Market Analysis, Insights and Forecast, 2019-2031
- 13.1. Market Analysis, Insights and Forecast - By Country/Sub-region
- 13.1.1. undefined
- 14. Middle East and Africa Digital Biomarkers Market Analysis, Insights and Forecast, 2019-2031
- 14.1. Market Analysis, Insights and Forecast - By Country/Sub-region
- 14.1.1. undefined
- 15. South America Digital Biomarkers Market Analysis, Insights and Forecast, 2019-2031
- 15.1. Market Analysis, Insights and Forecast - By Country/Sub-region
- 15.1.1. undefined
- 16. Competitive Analysis
- 16.1. Global Market Share Analysis 2024
- 16.2. Company Profiles
- 16.2.1 Akili Inc
- 16.2.1.1. Overview
- 16.2.1.2. Products
- 16.2.1.3. SWOT Analysis
- 16.2.1.4. Recent Developments
- 16.2.1.5. Financials (Based on Availability)
- 16.2.2 IXICO plc
- 16.2.2.1. Overview
- 16.2.2.2. Products
- 16.2.2.3. SWOT Analysis
- 16.2.2.4. Recent Developments
- 16.2.2.5. Financials (Based on Availability)
- 16.2.3 F Hoffmann-La Roche Ltd
- 16.2.3.1. Overview
- 16.2.3.2. Products
- 16.2.3.3. SWOT Analysis
- 16.2.3.4. Recent Developments
- 16.2.3.5. Financials (Based on Availability)
- 16.2.4 Biogen
- 16.2.4.1. Overview
- 16.2.4.2. Products
- 16.2.4.3. SWOT Analysis
- 16.2.4.4. Recent Developments
- 16.2.4.5. Financials (Based on Availability)
- 16.2.5 Koneksa
- 16.2.5.1. Overview
- 16.2.5.2. Products
- 16.2.5.3. SWOT Analysis
- 16.2.5.4. Recent Developments
- 16.2.5.5. Financials (Based on Availability)
- 16.2.6 Huma
- 16.2.6.1. Overview
- 16.2.6.2. Products
- 16.2.6.3. SWOT Analysis
- 16.2.6.4. Recent Developments
- 16.2.6.5. Financials (Based on Availability)
- 16.2.7 Fitbit Health Solutions
- 16.2.7.1. Overview
- 16.2.7.2. Products
- 16.2.7.3. SWOT Analysis
- 16.2.7.4. Recent Developments
- 16.2.7.5. Financials (Based on Availability)
- 16.2.8 AliveCor Inc
- 16.2.8.1. Overview
- 16.2.8.2. Products
- 16.2.8.3. SWOT Analysis
- 16.2.8.4. Recent Developments
- 16.2.8.5. Financials (Based on Availability)
- 16.2.9 ActiGraph LLC
- 16.2.9.1. Overview
- 16.2.9.2. Products
- 16.2.9.3. SWOT Analysis
- 16.2.9.4. Recent Developments
- 16.2.9.5. Financials (Based on Availability)
- 16.2.10 Empatica Inc
- 16.2.10.1. Overview
- 16.2.10.2. Products
- 16.2.10.3. SWOT Analysis
- 16.2.10.4. Recent Developments
- 16.2.10.5. Financials (Based on Availability)
- 16.2.1 Akili Inc
List of Figures
- Figure 1: Global Digital Biomarkers Market Revenue Breakdown (Million, %) by Region 2024 & 2032
- Figure 2: Global Digital Biomarkers Market Volume Breakdown (K Unit, %) by Region 2024 & 2032
- Figure 3: North America Digital Biomarkers Market Revenue (Million), by Country 2024 & 2032
- Figure 4: North America Digital Biomarkers Market Volume (K Unit), by Country 2024 & 2032
- Figure 5: North America Digital Biomarkers Market Revenue Share (%), by Country 2024 & 2032
- Figure 6: North America Digital Biomarkers Market Volume Share (%), by Country 2024 & 2032
- Figure 7: Europe Digital Biomarkers Market Revenue (Million), by Country 2024 & 2032
- Figure 8: Europe Digital Biomarkers Market Volume (K Unit), by Country 2024 & 2032
- Figure 9: Europe Digital Biomarkers Market Revenue Share (%), by Country 2024 & 2032
- Figure 10: Europe Digital Biomarkers Market Volume Share (%), by Country 2024 & 2032
- Figure 11: Asia Pacific Digital Biomarkers Market Revenue (Million), by Country 2024 & 2032
- Figure 12: Asia Pacific Digital Biomarkers Market Volume (K Unit), by Country 2024 & 2032
- Figure 13: Asia Pacific Digital Biomarkers Market Revenue Share (%), by Country 2024 & 2032
- Figure 14: Asia Pacific Digital Biomarkers Market Volume Share (%), by Country 2024 & 2032
- Figure 15: Middle East and Africa Digital Biomarkers Market Revenue (Million), by Country 2024 & 2032
- Figure 16: Middle East and Africa Digital Biomarkers Market Volume (K Unit), by Country 2024 & 2032
- Figure 17: Middle East and Africa Digital Biomarkers Market Revenue Share (%), by Country 2024 & 2032
- Figure 18: Middle East and Africa Digital Biomarkers Market Volume Share (%), by Country 2024 & 2032
- Figure 19: South America Digital Biomarkers Market Revenue (Million), by Country 2024 & 2032
- Figure 20: South America Digital Biomarkers Market Volume (K Unit), by Country 2024 & 2032
- Figure 21: South America Digital Biomarkers Market Revenue Share (%), by Country 2024 & 2032
- Figure 22: South America Digital Biomarkers Market Volume Share (%), by Country 2024 & 2032
- Figure 23: North America Digital Biomarkers Market Revenue (Million), by Type 2024 & 2032
- Figure 24: North America Digital Biomarkers Market Volume (K Unit), by Type 2024 & 2032
- Figure 25: North America Digital Biomarkers Market Revenue Share (%), by Type 2024 & 2032
- Figure 26: North America Digital Biomarkers Market Volume Share (%), by Type 2024 & 2032
- Figure 27: North America Digital Biomarkers Market Revenue (Million), by Clinical Practice 2024 & 2032
- Figure 28: North America Digital Biomarkers Market Volume (K Unit), by Clinical Practice 2024 & 2032
- Figure 29: North America Digital Biomarkers Market Revenue Share (%), by Clinical Practice 2024 & 2032
- Figure 30: North America Digital Biomarkers Market Volume Share (%), by Clinical Practice 2024 & 2032
- Figure 31: North America Digital Biomarkers Market Revenue (Million), by Therapeutic Area 2024 & 2032
- Figure 32: North America Digital Biomarkers Market Volume (K Unit), by Therapeutic Area 2024 & 2032
- Figure 33: North America Digital Biomarkers Market Revenue Share (%), by Therapeutic Area 2024 & 2032
- Figure 34: North America Digital Biomarkers Market Volume Share (%), by Therapeutic Area 2024 & 2032
- Figure 35: North America Digital Biomarkers Market Revenue (Million), by End User 2024 & 2032
- Figure 36: North America Digital Biomarkers Market Volume (K Unit), by End User 2024 & 2032
- Figure 37: North America Digital Biomarkers Market Revenue Share (%), by End User 2024 & 2032
- Figure 38: North America Digital Biomarkers Market Volume Share (%), by End User 2024 & 2032
- Figure 39: North America Digital Biomarkers Market Revenue (Million), by Country 2024 & 2032
- Figure 40: North America Digital Biomarkers Market Volume (K Unit), by Country 2024 & 2032
- Figure 41: North America Digital Biomarkers Market Revenue Share (%), by Country 2024 & 2032
- Figure 42: North America Digital Biomarkers Market Volume Share (%), by Country 2024 & 2032
- Figure 43: Europe Digital Biomarkers Market Revenue (Million), by Type 2024 & 2032
- Figure 44: Europe Digital Biomarkers Market Volume (K Unit), by Type 2024 & 2032
- Figure 45: Europe Digital Biomarkers Market Revenue Share (%), by Type 2024 & 2032
- Figure 46: Europe Digital Biomarkers Market Volume Share (%), by Type 2024 & 2032
- Figure 47: Europe Digital Biomarkers Market Revenue (Million), by Clinical Practice 2024 & 2032
- Figure 48: Europe Digital Biomarkers Market Volume (K Unit), by Clinical Practice 2024 & 2032
- Figure 49: Europe Digital Biomarkers Market Revenue Share (%), by Clinical Practice 2024 & 2032
- Figure 50: Europe Digital Biomarkers Market Volume Share (%), by Clinical Practice 2024 & 2032
- Figure 51: Europe Digital Biomarkers Market Revenue (Million), by Therapeutic Area 2024 & 2032
- Figure 52: Europe Digital Biomarkers Market Volume (K Unit), by Therapeutic Area 2024 & 2032
- Figure 53: Europe Digital Biomarkers Market Revenue Share (%), by Therapeutic Area 2024 & 2032
- Figure 54: Europe Digital Biomarkers Market Volume Share (%), by Therapeutic Area 2024 & 2032
- Figure 55: Europe Digital Biomarkers Market Revenue (Million), by End User 2024 & 2032
- Figure 56: Europe Digital Biomarkers Market Volume (K Unit), by End User 2024 & 2032
- Figure 57: Europe Digital Biomarkers Market Revenue Share (%), by End User 2024 & 2032
- Figure 58: Europe Digital Biomarkers Market Volume Share (%), by End User 2024 & 2032
- Figure 59: Europe Digital Biomarkers Market Revenue (Million), by Country 2024 & 2032
- Figure 60: Europe Digital Biomarkers Market Volume (K Unit), by Country 2024 & 2032
- Figure 61: Europe Digital Biomarkers Market Revenue Share (%), by Country 2024 & 2032
- Figure 62: Europe Digital Biomarkers Market Volume Share (%), by Country 2024 & 2032
- Figure 63: Asia Pacific Digital Biomarkers Market Revenue (Million), by Type 2024 & 2032
- Figure 64: Asia Pacific Digital Biomarkers Market Volume (K Unit), by Type 2024 & 2032
- Figure 65: Asia Pacific Digital Biomarkers Market Revenue Share (%), by Type 2024 & 2032
- Figure 66: Asia Pacific Digital Biomarkers Market Volume Share (%), by Type 2024 & 2032
- Figure 67: Asia Pacific Digital Biomarkers Market Revenue (Million), by Clinical Practice 2024 & 2032
- Figure 68: Asia Pacific Digital Biomarkers Market Volume (K Unit), by Clinical Practice 2024 & 2032
- Figure 69: Asia Pacific Digital Biomarkers Market Revenue Share (%), by Clinical Practice 2024 & 2032
- Figure 70: Asia Pacific Digital Biomarkers Market Volume Share (%), by Clinical Practice 2024 & 2032
- Figure 71: Asia Pacific Digital Biomarkers Market Revenue (Million), by Therapeutic Area 2024 & 2032
- Figure 72: Asia Pacific Digital Biomarkers Market Volume (K Unit), by Therapeutic Area 2024 & 2032
- Figure 73: Asia Pacific Digital Biomarkers Market Revenue Share (%), by Therapeutic Area 2024 & 2032
- Figure 74: Asia Pacific Digital Biomarkers Market Volume Share (%), by Therapeutic Area 2024 & 2032
- Figure 75: Asia Pacific Digital Biomarkers Market Revenue (Million), by End User 2024 & 2032
- Figure 76: Asia Pacific Digital Biomarkers Market Volume (K Unit), by End User 2024 & 2032
- Figure 77: Asia Pacific Digital Biomarkers Market Revenue Share (%), by End User 2024 & 2032
- Figure 78: Asia Pacific Digital Biomarkers Market Volume Share (%), by End User 2024 & 2032
- Figure 79: Asia Pacific Digital Biomarkers Market Revenue (Million), by Country 2024 & 2032
- Figure 80: Asia Pacific Digital Biomarkers Market Volume (K Unit), by Country 2024 & 2032
- Figure 81: Asia Pacific Digital Biomarkers Market Revenue Share (%), by Country 2024 & 2032
- Figure 82: Asia Pacific Digital Biomarkers Market Volume Share (%), by Country 2024 & 2032
- Figure 83: Middle East and Africa Digital Biomarkers Market Revenue (Million), by Type 2024 & 2032
- Figure 84: Middle East and Africa Digital Biomarkers Market Volume (K Unit), by Type 2024 & 2032
- Figure 85: Middle East and Africa Digital Biomarkers Market Revenue Share (%), by Type 2024 & 2032
- Figure 86: Middle East and Africa Digital Biomarkers Market Volume Share (%), by Type 2024 & 2032
- Figure 87: Middle East and Africa Digital Biomarkers Market Revenue (Million), by Clinical Practice 2024 & 2032
- Figure 88: Middle East and Africa Digital Biomarkers Market Volume (K Unit), by Clinical Practice 2024 & 2032
- Figure 89: Middle East and Africa Digital Biomarkers Market Revenue Share (%), by Clinical Practice 2024 & 2032
- Figure 90: Middle East and Africa Digital Biomarkers Market Volume Share (%), by Clinical Practice 2024 & 2032
- Figure 91: Middle East and Africa Digital Biomarkers Market Revenue (Million), by Therapeutic Area 2024 & 2032
- Figure 92: Middle East and Africa Digital Biomarkers Market Volume (K Unit), by Therapeutic Area 2024 & 2032
- Figure 93: Middle East and Africa Digital Biomarkers Market Revenue Share (%), by Therapeutic Area 2024 & 2032
- Figure 94: Middle East and Africa Digital Biomarkers Market Volume Share (%), by Therapeutic Area 2024 & 2032
- Figure 95: Middle East and Africa Digital Biomarkers Market Revenue (Million), by End User 2024 & 2032
- Figure 96: Middle East and Africa Digital Biomarkers Market Volume (K Unit), by End User 2024 & 2032
- Figure 97: Middle East and Africa Digital Biomarkers Market Revenue Share (%), by End User 2024 & 2032
- Figure 98: Middle East and Africa Digital Biomarkers Market Volume Share (%), by End User 2024 & 2032
- Figure 99: Middle East and Africa Digital Biomarkers Market Revenue (Million), by Country 2024 & 2032
- Figure 100: Middle East and Africa Digital Biomarkers Market Volume (K Unit), by Country 2024 & 2032
- Figure 101: Middle East and Africa Digital Biomarkers Market Revenue Share (%), by Country 2024 & 2032
- Figure 102: Middle East and Africa Digital Biomarkers Market Volume Share (%), by Country 2024 & 2032
- Figure 103: South America Digital Biomarkers Market Revenue (Million), by Type 2024 & 2032
- Figure 104: South America Digital Biomarkers Market Volume (K Unit), by Type 2024 & 2032
- Figure 105: South America Digital Biomarkers Market Revenue Share (%), by Type 2024 & 2032
- Figure 106: South America Digital Biomarkers Market Volume Share (%), by Type 2024 & 2032
- Figure 107: South America Digital Biomarkers Market Revenue (Million), by Clinical Practice 2024 & 2032
- Figure 108: South America Digital Biomarkers Market Volume (K Unit), by Clinical Practice 2024 & 2032
- Figure 109: South America Digital Biomarkers Market Revenue Share (%), by Clinical Practice 2024 & 2032
- Figure 110: South America Digital Biomarkers Market Volume Share (%), by Clinical Practice 2024 & 2032
- Figure 111: South America Digital Biomarkers Market Revenue (Million), by Therapeutic Area 2024 & 2032
- Figure 112: South America Digital Biomarkers Market Volume (K Unit), by Therapeutic Area 2024 & 2032
- Figure 113: South America Digital Biomarkers Market Revenue Share (%), by Therapeutic Area 2024 & 2032
- Figure 114: South America Digital Biomarkers Market Volume Share (%), by Therapeutic Area 2024 & 2032
- Figure 115: South America Digital Biomarkers Market Revenue (Million), by End User 2024 & 2032
- Figure 116: South America Digital Biomarkers Market Volume (K Unit), by End User 2024 & 2032
- Figure 117: South America Digital Biomarkers Market Revenue Share (%), by End User 2024 & 2032
- Figure 118: South America Digital Biomarkers Market Volume Share (%), by End User 2024 & 2032
- Figure 119: South America Digital Biomarkers Market Revenue (Million), by Country 2024 & 2032
- Figure 120: South America Digital Biomarkers Market Volume (K Unit), by Country 2024 & 2032
- Figure 121: South America Digital Biomarkers Market Revenue Share (%), by Country 2024 & 2032
- Figure 122: South America Digital Biomarkers Market Volume Share (%), by Country 2024 & 2032
List of Tables
- Table 1: Global Digital Biomarkers Market Revenue Million Forecast, by Region 2019 & 2032
- Table 2: Global Digital Biomarkers Market Volume K Unit Forecast, by Region 2019 & 2032
- Table 3: Global Digital Biomarkers Market Revenue Million Forecast, by Type 2019 & 2032
- Table 4: Global Digital Biomarkers Market Volume K Unit Forecast, by Type 2019 & 2032
- Table 5: Global Digital Biomarkers Market Revenue Million Forecast, by Clinical Practice 2019 & 2032
- Table 6: Global Digital Biomarkers Market Volume K Unit Forecast, by Clinical Practice 2019 & 2032
- Table 7: Global Digital Biomarkers Market Revenue Million Forecast, by Therapeutic Area 2019 & 2032
- Table 8: Global Digital Biomarkers Market Volume K Unit Forecast, by Therapeutic Area 2019 & 2032
- Table 9: Global Digital Biomarkers Market Revenue Million Forecast, by End User 2019 & 2032
- Table 10: Global Digital Biomarkers Market Volume K Unit Forecast, by End User 2019 & 2032
- Table 11: Global Digital Biomarkers Market Revenue Million Forecast, by Region 2019 & 2032
- Table 12: Global Digital Biomarkers Market Volume K Unit Forecast, by Region 2019 & 2032
- Table 13: Global Digital Biomarkers Market Revenue Million Forecast, by Country 2019 & 2032
- Table 14: Global Digital Biomarkers Market Volume K Unit Forecast, by Country 2019 & 2032
- Table 15: Global Digital Biomarkers Market Revenue Million Forecast, by Country 2019 & 2032
- Table 16: Global Digital Biomarkers Market Volume K Unit Forecast, by Country 2019 & 2032
- Table 17: Global Digital Biomarkers Market Revenue Million Forecast, by Country 2019 & 2032
- Table 18: Global Digital Biomarkers Market Volume K Unit Forecast, by Country 2019 & 2032
- Table 19: Global Digital Biomarkers Market Revenue Million Forecast, by Country 2019 & 2032
- Table 20: Global Digital Biomarkers Market Volume K Unit Forecast, by Country 2019 & 2032
- Table 21: Global Digital Biomarkers Market Revenue Million Forecast, by Country 2019 & 2032
- Table 22: Global Digital Biomarkers Market Volume K Unit Forecast, by Country 2019 & 2032
- Table 23: Global Digital Biomarkers Market Revenue Million Forecast, by Type 2019 & 2032
- Table 24: Global Digital Biomarkers Market Volume K Unit Forecast, by Type 2019 & 2032
- Table 25: Global Digital Biomarkers Market Revenue Million Forecast, by Clinical Practice 2019 & 2032
- Table 26: Global Digital Biomarkers Market Volume K Unit Forecast, by Clinical Practice 2019 & 2032
- Table 27: Global Digital Biomarkers Market Revenue Million Forecast, by Therapeutic Area 2019 & 2032
- Table 28: Global Digital Biomarkers Market Volume K Unit Forecast, by Therapeutic Area 2019 & 2032
- Table 29: Global Digital Biomarkers Market Revenue Million Forecast, by End User 2019 & 2032
- Table 30: Global Digital Biomarkers Market Volume K Unit Forecast, by End User 2019 & 2032
- Table 31: Global Digital Biomarkers Market Revenue Million Forecast, by Country 2019 & 2032
- Table 32: Global Digital Biomarkers Market Volume K Unit Forecast, by Country 2019 & 2032
- Table 33: United States Digital Biomarkers Market Revenue (Million) Forecast, by Application 2019 & 2032
- Table 34: United States Digital Biomarkers Market Volume (K Unit) Forecast, by Application 2019 & 2032
- Table 35: Canada Digital Biomarkers Market Revenue (Million) Forecast, by Application 2019 & 2032
- Table 36: Canada Digital Biomarkers Market Volume (K Unit) Forecast, by Application 2019 & 2032
- Table 37: Mexico Digital Biomarkers Market Revenue (Million) Forecast, by Application 2019 & 2032
- Table 38: Mexico Digital Biomarkers Market Volume (K Unit) Forecast, by Application 2019 & 2032
- Table 39: Global Digital Biomarkers Market Revenue Million Forecast, by Type 2019 & 2032
- Table 40: Global Digital Biomarkers Market Volume K Unit Forecast, by Type 2019 & 2032
- Table 41: Global Digital Biomarkers Market Revenue Million Forecast, by Clinical Practice 2019 & 2032
- Table 42: Global Digital Biomarkers Market Volume K Unit Forecast, by Clinical Practice 2019 & 2032
- Table 43: Global Digital Biomarkers Market Revenue Million Forecast, by Therapeutic Area 2019 & 2032
- Table 44: Global Digital Biomarkers Market Volume K Unit Forecast, by Therapeutic Area 2019 & 2032
- Table 45: Global Digital Biomarkers Market Revenue Million Forecast, by End User 2019 & 2032
- Table 46: Global Digital Biomarkers Market Volume K Unit Forecast, by End User 2019 & 2032
- Table 47: Global Digital Biomarkers Market Revenue Million Forecast, by Country 2019 & 2032
- Table 48: Global Digital Biomarkers Market Volume K Unit Forecast, by Country 2019 & 2032
- Table 49: Germany Digital Biomarkers Market Revenue (Million) Forecast, by Application 2019 & 2032
- Table 50: Germany Digital Biomarkers Market Volume (K Unit) Forecast, by Application 2019 & 2032
- Table 51: United Kingdom Digital Biomarkers Market Revenue (Million) Forecast, by Application 2019 & 2032
- Table 52: United Kingdom Digital Biomarkers Market Volume (K Unit) Forecast, by Application 2019 & 2032
- Table 53: France Digital Biomarkers Market Revenue (Million) Forecast, by Application 2019 & 2032
- Table 54: France Digital Biomarkers Market Volume (K Unit) Forecast, by Application 2019 & 2032
- Table 55: Italy Digital Biomarkers Market Revenue (Million) Forecast, by Application 2019 & 2032
- Table 56: Italy Digital Biomarkers Market Volume (K Unit) Forecast, by Application 2019 & 2032
- Table 57: Spain Digital Biomarkers Market Revenue (Million) Forecast, by Application 2019 & 2032
- Table 58: Spain Digital Biomarkers Market Volume (K Unit) Forecast, by Application 2019 & 2032
- Table 59: Rest of Europe Digital Biomarkers Market Revenue (Million) Forecast, by Application 2019 & 2032
- Table 60: Rest of Europe Digital Biomarkers Market Volume (K Unit) Forecast, by Application 2019 & 2032
- Table 61: Global Digital Biomarkers Market Revenue Million Forecast, by Type 2019 & 2032
- Table 62: Global Digital Biomarkers Market Volume K Unit Forecast, by Type 2019 & 2032
- Table 63: Global Digital Biomarkers Market Revenue Million Forecast, by Clinical Practice 2019 & 2032
- Table 64: Global Digital Biomarkers Market Volume K Unit Forecast, by Clinical Practice 2019 & 2032
- Table 65: Global Digital Biomarkers Market Revenue Million Forecast, by Therapeutic Area 2019 & 2032
- Table 66: Global Digital Biomarkers Market Volume K Unit Forecast, by Therapeutic Area 2019 & 2032
- Table 67: Global Digital Biomarkers Market Revenue Million Forecast, by End User 2019 & 2032
- Table 68: Global Digital Biomarkers Market Volume K Unit Forecast, by End User 2019 & 2032
- Table 69: Global Digital Biomarkers Market Revenue Million Forecast, by Country 2019 & 2032
- Table 70: Global Digital Biomarkers Market Volume K Unit Forecast, by Country 2019 & 2032
- Table 71: China Digital Biomarkers Market Revenue (Million) Forecast, by Application 2019 & 2032
- Table 72: China Digital Biomarkers Market Volume (K Unit) Forecast, by Application 2019 & 2032
- Table 73: Japan Digital Biomarkers Market Revenue (Million) Forecast, by Application 2019 & 2032
- Table 74: Japan Digital Biomarkers Market Volume (K Unit) Forecast, by Application 2019 & 2032
- Table 75: India Digital Biomarkers Market Revenue (Million) Forecast, by Application 2019 & 2032
- Table 76: India Digital Biomarkers Market Volume (K Unit) Forecast, by Application 2019 & 2032
- Table 77: Australia Digital Biomarkers Market Revenue (Million) Forecast, by Application 2019 & 2032
- Table 78: Australia Digital Biomarkers Market Volume (K Unit) Forecast, by Application 2019 & 2032
- Table 79: South Korea Digital Biomarkers Market Revenue (Million) Forecast, by Application 2019 & 2032
- Table 80: South Korea Digital Biomarkers Market Volume (K Unit) Forecast, by Application 2019 & 2032
- Table 81: Rest of Asia Pacific Digital Biomarkers Market Revenue (Million) Forecast, by Application 2019 & 2032
- Table 82: Rest of Asia Pacific Digital Biomarkers Market Volume (K Unit) Forecast, by Application 2019 & 2032
- Table 83: Global Digital Biomarkers Market Revenue Million Forecast, by Type 2019 & 2032
- Table 84: Global Digital Biomarkers Market Volume K Unit Forecast, by Type 2019 & 2032
- Table 85: Global Digital Biomarkers Market Revenue Million Forecast, by Clinical Practice 2019 & 2032
- Table 86: Global Digital Biomarkers Market Volume K Unit Forecast, by Clinical Practice 2019 & 2032
- Table 87: Global Digital Biomarkers Market Revenue Million Forecast, by Therapeutic Area 2019 & 2032
- Table 88: Global Digital Biomarkers Market Volume K Unit Forecast, by Therapeutic Area 2019 & 2032
- Table 89: Global Digital Biomarkers Market Revenue Million Forecast, by End User 2019 & 2032
- Table 90: Global Digital Biomarkers Market Volume K Unit Forecast, by End User 2019 & 2032
- Table 91: Global Digital Biomarkers Market Revenue Million Forecast, by Country 2019 & 2032
- Table 92: Global Digital Biomarkers Market Volume K Unit Forecast, by Country 2019 & 2032
- Table 93: GCC Digital Biomarkers Market Revenue (Million) Forecast, by Application 2019 & 2032
- Table 94: GCC Digital Biomarkers Market Volume (K Unit) Forecast, by Application 2019 & 2032
- Table 95: South Africa Digital Biomarkers Market Revenue (Million) Forecast, by Application 2019 & 2032
- Table 96: South Africa Digital Biomarkers Market Volume (K Unit) Forecast, by Application 2019 & 2032
- Table 97: Rest of Middle East and Africa Digital Biomarkers Market Revenue (Million) Forecast, by Application 2019 & 2032
- Table 98: Rest of Middle East and Africa Digital Biomarkers Market Volume (K Unit) Forecast, by Application 2019 & 2032
- Table 99: Global Digital Biomarkers Market Revenue Million Forecast, by Type 2019 & 2032
- Table 100: Global Digital Biomarkers Market Volume K Unit Forecast, by Type 2019 & 2032
- Table 101: Global Digital Biomarkers Market Revenue Million Forecast, by Clinical Practice 2019 & 2032
- Table 102: Global Digital Biomarkers Market Volume K Unit Forecast, by Clinical Practice 2019 & 2032
- Table 103: Global Digital Biomarkers Market Revenue Million Forecast, by Therapeutic Area 2019 & 2032
- Table 104: Global Digital Biomarkers Market Volume K Unit Forecast, by Therapeutic Area 2019 & 2032
- Table 105: Global Digital Biomarkers Market Revenue Million Forecast, by End User 2019 & 2032
- Table 106: Global Digital Biomarkers Market Volume K Unit Forecast, by End User 2019 & 2032
- Table 107: Global Digital Biomarkers Market Revenue Million Forecast, by Country 2019 & 2032
- Table 108: Global Digital Biomarkers Market Volume K Unit Forecast, by Country 2019 & 2032
- Table 109: Brazil Digital Biomarkers Market Revenue (Million) Forecast, by Application 2019 & 2032
- Table 110: Brazil Digital Biomarkers Market Volume (K Unit) Forecast, by Application 2019 & 2032
- Table 111: Argentina Digital Biomarkers Market Revenue (Million) Forecast, by Application 2019 & 2032
- Table 112: Argentina Digital Biomarkers Market Volume (K Unit) Forecast, by Application 2019 & 2032
- Table 113: Rest of South America Digital Biomarkers Market Revenue (Million) Forecast, by Application 2019 & 2032
- Table 114: Rest of South America Digital Biomarkers Market Volume (K Unit) Forecast, by Application 2019 & 2032
Frequently Asked Questions
1. What is the projected Compound Annual Growth Rate (CAGR) of the Digital Biomarkers Market?
The projected CAGR is approximately 20.50%.
2. Which companies are prominent players in the Digital Biomarkers Market?
Key companies in the market include Akili Inc, IXICO plc, F Hoffmann-La Roche Ltd, Biogen, Koneksa, Huma, Fitbit Health Solutions, AliveCor Inc, ActiGraph LLC, Empatica Inc.
3. What are the main segments of the Digital Biomarkers Market?
The market segments include Type, Clinical Practice, Therapeutic Area, End User.
4. Can you provide details about the market size?
The market size is estimated to be USD XX Million as of 2022.
5. What are some drivers contributing to market growth?
Increasing Prevalence of Chronic Diseases; Growing Number of Clinical Trials; Technological Advancements in Digital Biomarkers.
6. What are the notable trends driving market growth?
Monitoring Digital Biomarkers Segment is Anticipated to Show Significant Growth Over the Forecast Period.
7. Are there any restraints impacting market growth?
High Product Cost; Data Security Concerns.
8. Can you provide examples of recent developments in the market?
In October 2022, Koneksa announced the launch of its clinical pipeline including biomarkers in neuroscience, oncology, respiratory, and other therapeutic areas.
9. What pricing options are available for accessing the report?
Pricing options include single-user, multi-user, and enterprise licenses priced at USD 4750, USD 5250, and USD 8750 respectively.
10. Is the market size provided in terms of value or volume?
The market size is provided in terms of value, measured in Million and volume, measured in K Unit.
11. Are there any specific market keywords associated with the report?
Yes, the market keyword associated with the report is "Digital Biomarkers Market," which aids in identifying and referencing the specific market segment covered.
12. How do I determine which pricing option suits my needs best?
The pricing options vary based on user requirements and access needs. Individual users may opt for single-user licenses, while businesses requiring broader access may choose multi-user or enterprise licenses for cost-effective access to the report.
13. Are there any additional resources or data provided in the Digital Biomarkers Market report?
While the report offers comprehensive insights, it's advisable to review the specific contents or supplementary materials provided to ascertain if additional resources or data are available.
14. How can I stay updated on further developments or reports in the Digital Biomarkers Market?
To stay informed about further developments, trends, and reports in the Digital Biomarkers Market, consider subscribing to industry newsletters, following relevant companies and organizations, or regularly checking reputable industry news sources and publications.
Methodology
Step 1 - Identification of Relevant Samples Size from Population Database


Step 2 - Approaches for Defining Global Market Size (Value, Volume* & Price*)

Note*: In applicable scenarios
Step 3 - Data Sources
Primary Research
- Web Analytics
- Survey Reports
- Research Institute
- Latest Research Reports
- Opinion Leaders
Secondary Research
- Annual Reports
- White Paper
- Latest Press Release
- Industry Association
- Paid Database
- Investor Presentations

Step 4 - Data Triangulation
Involves using different sources of information in order to increase the validity of a study
These sources are likely to be stakeholders in a program - participants, other researchers, program staff, other community members, and so on.
Then we put all data in single framework & apply various statistical tools to find out the dynamic on the market.
During the analysis stage, feedback from the stakeholder groups would be compared to determine areas of agreement as well as areas of divergence


