

Key Insights
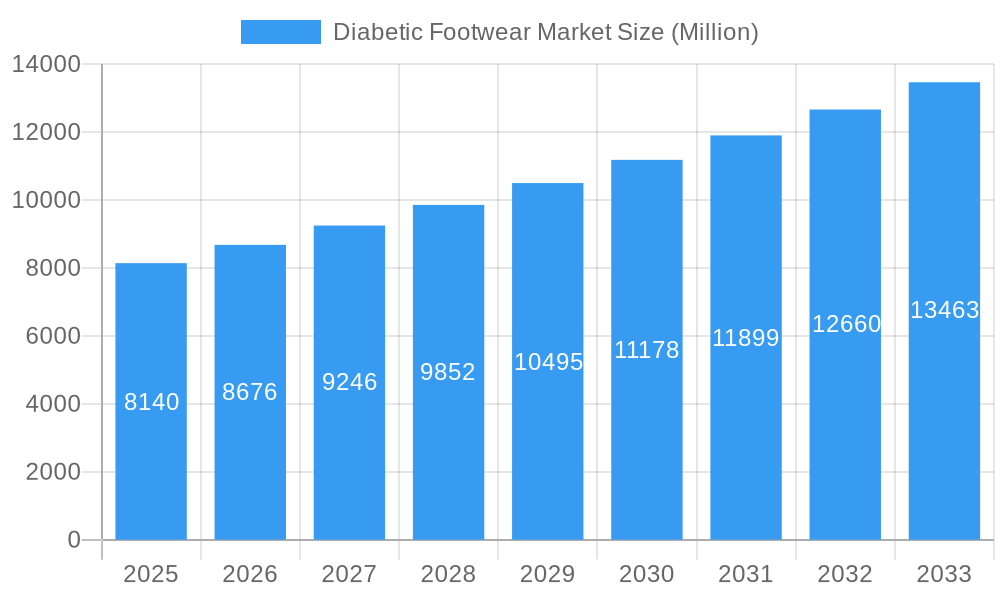
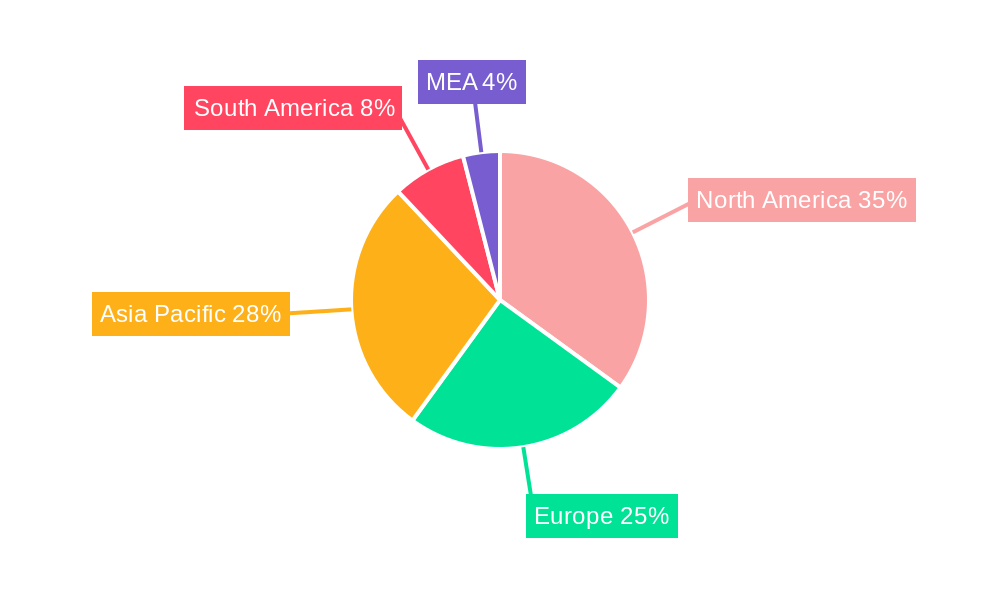
The global diabetic footwear market, valued at $8.14 billion in 2025, is projected to experience robust growth, driven by the rising prevalence of diabetes and its associated complications, particularly diabetic neuropathy. This condition necessitates specialized footwear to alleviate foot pain, prevent injuries, and improve overall comfort for individuals with diabetes. Increased awareness about the importance of preventive foot care among diabetics is further fueling market expansion. The market is segmented by end-user (men and women), distribution channel (offline and online retail stores), and product type (shoes, sandals, and slippers). The online retail segment is witnessing significant growth due to the convenience and wider selection offered by e-commerce platforms. Technological advancements in footwear design and materials, leading to improved comfort, durability, and therapeutic benefits, contribute to the market's upward trajectory. North America currently holds a substantial market share, owing to high diabetes prevalence and robust healthcare infrastructure. However, Asia-Pacific is expected to exhibit significant growth potential in the coming years driven by increasing diabetes cases and rising disposable incomes. Competitive forces are shaping the market, with established players like Orthofeet Inc. and Propét USA Inc. facing competition from emerging brands and innovative product offerings.
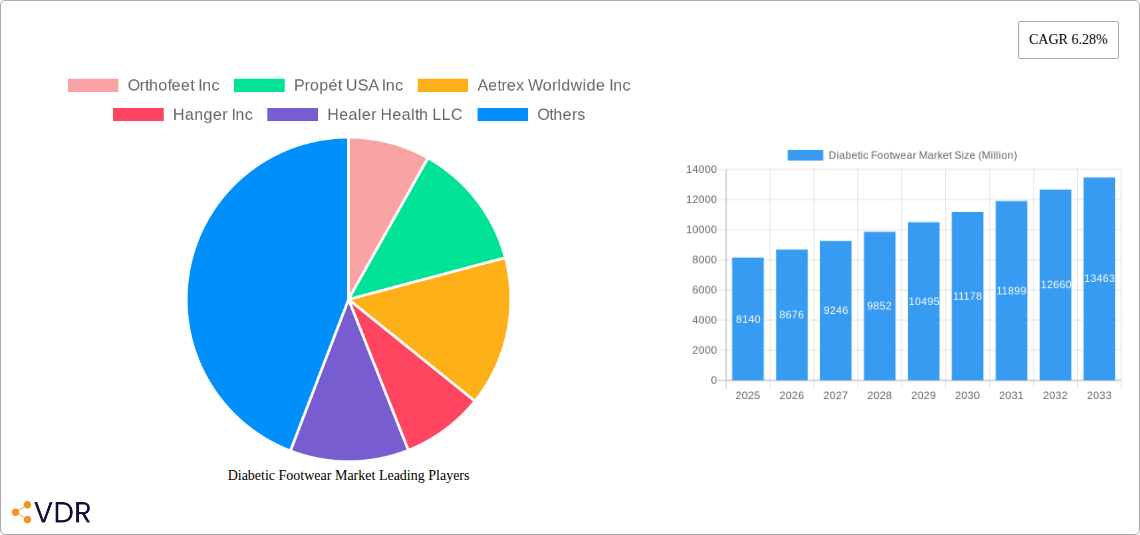
Diabetic Footwear Market Market Size (In Billion)
The market's CAGR of 6.28% from 2025 to 2033 suggests a steady and sustainable growth pattern. However, certain restraints may impact the market's trajectory. These include the high cost of diabetic footwear, potentially limiting accessibility for some patients, and the need for consistent education and awareness campaigns to ensure proper utilization of specialized footwear. Nonetheless, the considerable unmet needs and the escalating global diabetes burden are expected to outweigh these challenges, ensuring continued market expansion over the forecast period. Future market developments will likely focus on personalized footwear solutions leveraging advanced technologies to cater to individual foot conditions and preferences, expanding market opportunities further.
Diabetic Footwear Market Company Market Share
Diabetic Footwear Market: A Comprehensive Report (2019-2033)
This in-depth report provides a comprehensive analysis of the Diabetic Footwear Market, encompassing market dynamics, growth trends, regional dominance, product landscape, key players, and future outlook. The study period covers 2019-2033, with 2025 as the base and estimated year. This report is invaluable for industry professionals, investors, and strategic decision-makers seeking to understand and capitalize on opportunities within this crucial sector of the healthcare market. The parent market is the broader footwear industry, while the child market focuses specifically on footwear designed for individuals with diabetes. The market size is predicted to reach xx Million units by 2033.
Diabetic Footwear Market Market Dynamics & Structure
The Diabetic Footwear Market is characterized by a moderately concentrated landscape, with several key players vying for market share. Technological innovation, driven by advancements in materials science and 3D printing, is a key driver of market growth. Stringent regulatory frameworks regarding medical device classification and safety standards significantly influence product development and market entry. Competitive product substitutes, such as customized orthotics, pose a challenge. The end-user demographic is primarily comprised of aging populations with a high prevalence of diabetes, exhibiting a skewed gender distribution. Mergers and acquisitions (M&A) activity in the sector has been moderate, reflecting consolidation efforts amongst key players.
- Market Concentration: Moderately concentrated, with the top 5 players holding approximately xx% of the market share in 2024.
- Technological Innovation: Advancements in materials (e.g., breathable, antimicrobial fabrics) and 3D printing for customized footwear are key drivers.
- Regulatory Framework: Stringent FDA regulations (in the US) and equivalent regulations in other regions significantly impact product development and market access.
- Competitive Substitutes: Custom orthotics and other supportive footwear options pose competitive pressure.
- End-User Demographics: Predominantly older adults (55+), with a higher proportion of men compared to women. (Men: xx Million units, Women: xx Million units in 2024)
- M&A Activity: An average of xx M&A deals per year during the historical period (2019-2024).
Diabetic Footwear Market Growth Trends & Insights
The Diabetic Footwear Market is experiencing robust growth, fueled by rising diabetes prevalence globally and increasing awareness regarding the importance of preventative foot care. Market size expanded from xx Million units in 2019 to xx Million units in 2024, exhibiting a CAGR of xx% during this period. Technological disruptions, such as the adoption of 3D-printed footwear and personalized fitting technologies, are driving increased adoption rates. Consumer behavior is shifting toward greater preference for comfort, style, and customized solutions, influencing product development strategies. The market penetration rate for diabetic-specific footwear is expected to reach xx% by 2033.
Dominant Regions, Countries, or Segments in Diabetic Footwear Market
North America currently dominates the Diabetic Footwear Market, driven by high diabetes prevalence, advanced healthcare infrastructure, and strong consumer demand for specialized footwear. Within North America, the United States holds the largest market share. The online retail channel is exhibiting faster growth compared to offline retail stores, reflecting evolving consumer preferences and increased online accessibility. The "Shoes" segment represents the largest product category, followed by Sandals and Slippers. The men's segment is slightly larger than the women's segment.
- Leading Region: North America (xx% market share in 2024).
- Leading Country: United States
- Leading Distribution Channel: Offline retail stores (xx% market share in 2024), with online retail showing significant growth.
- Leading Product Type: Shoes (xx% market share in 2024)
- Leading End-User Segment: Men (xx% market share in 2024)
Key drivers include increasing government initiatives to raise awareness about diabetes prevention and management, robust healthcare infrastructure, and rising disposable incomes.
Diabetic Footwear Market Product Landscape
The Diabetic Footwear Market offers a diverse range of products, including therapeutic shoes, sandals, and slippers, designed to accommodate various foot conditions associated with diabetes. Products incorporate features such as extra depth, wider fitting, adjustable closures, seamless interiors, and specialized cushioning to minimize pressure points and prevent ulceration. Technological advancements focus on improved comfort, breathability, and antimicrobial properties, leveraging innovative materials and manufacturing processes. Unique selling propositions emphasize enhanced comfort, prevention of foot complications, and improved overall health outcomes.
Key Drivers, Barriers & Challenges in Diabetic Footwear Market
Key Drivers:
- Rising prevalence of diabetes worldwide.
- Increasing awareness of diabetic foot complications.
- Technological advancements leading to improved product features.
- Growing demand for comfortable and stylish diabetic footwear.
Key Challenges & Restraints:
- High manufacturing costs for specialized footwear.
- Limited market awareness in certain regions.
- Competition from generic footwear options.
- Stringent regulatory requirements.
- Supply chain disruptions impacting material availability and production.
Emerging Opportunities in Diabetic Footwear Market
Emerging opportunities include expansion into untapped markets in developing economies with high diabetes prevalence, the development of smart footwear integrating sensor technology for remote monitoring of foot health, personalized footwear solutions leveraging 3D scanning and printing technologies, and an increasing demand for sustainable and eco-friendly materials in diabetic footwear manufacturing.
Growth Accelerators in the Diabetic Footwear Market Industry
Long-term growth in the Diabetic Footwear Market will be driven by technological breakthroughs enabling greater personalization and improved comfort, strategic partnerships between footwear manufacturers and healthcare providers to expand market reach, and expansion into new geographic markets with high diabetes prevalence.
Key Players Shaping the Diabetic Footwear Market Market
- Orthofeet Inc
- Propét USA Inc
- Aetrex Worldwide Inc
- Hanger Inc
- Healer Health LLC
- Pilgrim Shoes
- Drew Shoe Corporation
- DJO Global Inc
- Dr Zen Products Inc
- Podartis srl Unipersonale
Notable Milestones in Diabetic Footwear Market Sector
- November 2023: Aetrex launched FitStarter, a personalized footwear recommendation platform aimed at improving shoe fitting services and reducing returns for retailers.
- November 2023: Fyous secured a GBP 1.4 million grant to expand its 3D-scanned, custom-fit diabetic footwear using polymorphic molding technology.
- February 2022: The American Diabetes Association partnered with Dr. Comfort to enhance diabetes foot care prevention and treatment.
In-Depth Diabetic Footwear Market Market Outlook
The Diabetic Footwear Market is poised for sustained growth, driven by the factors discussed above. Future market potential is significant, especially in developing countries. Strategic partnerships, innovative product development, and increased market penetration will be crucial for success. Companies focusing on personalized solutions, advanced technologies, and strong distribution channels are best positioned to capture market share and drive long-term growth.
Diabetic Footwear Market Segmentation
-
1. Product Type
- 1.1. Shoes
- 1.2. Sandals
- 1.3. Slippers
-
2. End-User
- 2.1. Men
- 2.2. Women
-
3. Distribution Channel
- 3.1. Offline Retail Stores
- 3.2. Online Retail Stores
Diabetic Footwear Market Segmentation By Geography
-
1. North America
- 1.1. United States
- 1.2. Canada
- 1.3. Mexico
- 1.4. Rest of North America
-
2. Europe
- 2.1. United Kingdom
- 2.2. Germany
- 2.3. France
- 2.4. Italy
- 2.5. Spain
- 2.6. Russia
- 2.7. Rest of Europe
-
3. Asia Pacific
- 3.1. China
- 3.2. Japan
- 3.3. India
- 3.4. Australia
- 3.5. Rest of Asia Pacific
-
4. Rest of the World
- 4.1. South America
- 4.2. Middle East and Africa
Diabetic Footwear Market Regional Market Share
Geographic Coverage of Diabetic Footwear Market
Diabetic Footwear Market REPORT HIGHLIGHTS
| Aspects | Details |
|---|---|
| Study Period | 2020-2034 |
| Base Year | 2025 |
| Estimated Year | 2026 |
| Forecast Period | 2026-2034 |
| Historical Period | 2020-2025 |
| Growth Rate | CAGR of 6.28% from 2020-2034 |
| Segmentation |
|
Table of Contents
- 1. Introduction
- 1.1. Research Scope
- 1.2. Market Segmentation
- 1.3. Research Objective
- 1.4. Definitions and Assumptions
- 2. Executive Summary
- 2.1. Market Snapshot
- 3. Market Dynamics
- 3.1. Market Drivers
- 3.2. Market Restrains
- 3.3. Market Trends
- 3.4. Market Opportunities
- 4. Market Factor Analysis
- 4.1. Porters Five Forces
- 4.1.1. Bargaining Power of Suppliers
- 4.1.2. Bargaining Power of Buyers
- 4.1.3. Threat of New Entrants
- 4.1.4. Threat of Substitutes
- 4.1.5. Competitive Rivalry
- 4.2. PESTEL analysis
- 4.3. BCG Analysis
- 4.3.1. Stars (High Growth, High Market Share)
- 4.3.2. Cash Cows (Low Growth, High Market Share)
- 4.3.3. Question Mark (High Growth, Low Market Share)
- 4.3.4. Dogs (Low Growth, Low Market Share)
- 4.4. Ansoff Matrix Analysis
- 4.5. Supply Chain Analysis
- 4.6. Regulatory Landscape
- 4.7. Current Market Potential and Opportunity Assessment (TAM–SAM–SOM Framework)
- 4.8. VDR Analyst Note
- 4.1. Porters Five Forces
- 5. Market Analysis, Insights and Forecast 2021-2033
- 5.1. Market Analysis, Insights and Forecast - by Product Type
- 5.1.1. Shoes
- 5.1.2. Sandals
- 5.1.3. Slippers
- 5.2. Market Analysis, Insights and Forecast - by End-User
- 5.2.1. Men
- 5.2.2. Women
- 5.3. Market Analysis, Insights and Forecast - by Distribution Channel
- 5.3.1. Offline Retail Stores
- 5.3.2. Online Retail Stores
- 5.4. Market Analysis, Insights and Forecast - by Region
- 5.4.1. North America
- 5.4.2. Europe
- 5.4.3. Asia Pacific
- 5.4.4. Rest of the World
- 5.1. Market Analysis, Insights and Forecast - by Product Type
- 6. Global Diabetic Footwear Market Analysis, Insights and Forecast, 2021-2033
- 6.1. Market Analysis, Insights and Forecast - by Product Type
- 6.1.1. Shoes
- 6.1.2. Sandals
- 6.1.3. Slippers
- 6.2. Market Analysis, Insights and Forecast - by End-User
- 6.2.1. Men
- 6.2.2. Women
- 6.3. Market Analysis, Insights and Forecast - by Distribution Channel
- 6.3.1. Offline Retail Stores
- 6.3.2. Online Retail Stores
- 6.1. Market Analysis, Insights and Forecast - by Product Type
- 7. North America Diabetic Footwear Market Analysis, Insights and Forecast, 2021-2033
- 7.1. Market Analysis, Insights and Forecast - by Product Type
- 7.1.1. Shoes
- 7.1.2. Sandals
- 7.1.3. Slippers
- 7.2. Market Analysis, Insights and Forecast - by End-User
- 7.2.1. Men
- 7.2.2. Women
- 7.3. Market Analysis, Insights and Forecast - by Distribution Channel
- 7.3.1. Offline Retail Stores
- 7.3.2. Online Retail Stores
- 7.1. Market Analysis, Insights and Forecast - by Product Type
- 8. Europe Diabetic Footwear Market Analysis, Insights and Forecast, 2021-2033
- 8.1. Market Analysis, Insights and Forecast - by Product Type
- 8.1.1. Shoes
- 8.1.2. Sandals
- 8.1.3. Slippers
- 8.2. Market Analysis, Insights and Forecast - by End-User
- 8.2.1. Men
- 8.2.2. Women
- 8.3. Market Analysis, Insights and Forecast - by Distribution Channel
- 8.3.1. Offline Retail Stores
- 8.3.2. Online Retail Stores
- 8.1. Market Analysis, Insights and Forecast - by Product Type
- 9. Asia Pacific Diabetic Footwear Market Analysis, Insights and Forecast, 2021-2033
- 9.1. Market Analysis, Insights and Forecast - by Product Type
- 9.1.1. Shoes
- 9.1.2. Sandals
- 9.1.3. Slippers
- 9.2. Market Analysis, Insights and Forecast - by End-User
- 9.2.1. Men
- 9.2.2. Women
- 9.3. Market Analysis, Insights and Forecast - by Distribution Channel
- 9.3.1. Offline Retail Stores
- 9.3.2. Online Retail Stores
- 9.1. Market Analysis, Insights and Forecast - by Product Type
- 10. Rest of the World Diabetic Footwear Market Analysis, Insights and Forecast, 2021-2033
- 10.1. Market Analysis, Insights and Forecast - by Product Type
- 10.1.1. Shoes
- 10.1.2. Sandals
- 10.1.3. Slippers
- 10.2. Market Analysis, Insights and Forecast - by End-User
- 10.2.1. Men
- 10.2.2. Women
- 10.3. Market Analysis, Insights and Forecast - by Distribution Channel
- 10.3.1. Offline Retail Stores
- 10.3.2. Online Retail Stores
- 10.1. Market Analysis, Insights and Forecast - by Product Type
- 11. Competitive Analysis
- 11.1. Company Profiles
- 11.1.1 Orthofeet Inc
- 11.1.1.1. Company Overview
- 11.1.1.2. Products
- 11.1.1.3. Company Financials
- 11.1.1.4. SWOT Analysis
- 11.1.2 Propét USA Inc
- 11.1.2.1. Company Overview
- 11.1.2.2. Products
- 11.1.2.3. Company Financials
- 11.1.2.4. SWOT Analysis
- 11.1.3 Aetrex Worldwide Inc
- 11.1.3.1. Company Overview
- 11.1.3.2. Products
- 11.1.3.3. Company Financials
- 11.1.3.4. SWOT Analysis
- 11.1.4 Hanger Inc
- 11.1.4.1. Company Overview
- 11.1.4.2. Products
- 11.1.4.3. Company Financials
- 11.1.4.4. SWOT Analysis
- 11.1.5 Healer Health LLC
- 11.1.5.1. Company Overview
- 11.1.5.2. Products
- 11.1.5.3. Company Financials
- 11.1.5.4. SWOT Analysis
- 11.1.6 Pilgrim Shoes*List Not Exhaustive
- 11.1.6.1. Company Overview
- 11.1.6.2. Products
- 11.1.6.3. Company Financials
- 11.1.6.4. SWOT Analysis
- 11.1.7 Drew Shoe Corporation
- 11.1.7.1. Company Overview
- 11.1.7.2. Products
- 11.1.7.3. Company Financials
- 11.1.7.4. SWOT Analysis
- 11.1.8 DJO Global Inc
- 11.1.8.1. Company Overview
- 11.1.8.2. Products
- 11.1.8.3. Company Financials
- 11.1.8.4. SWOT Analysis
- 11.1.9 Dr Zen Products Inc
- 11.1.9.1. Company Overview
- 11.1.9.2. Products
- 11.1.9.3. Company Financials
- 11.1.9.4. SWOT Analysis
- 11.1.10 Podartis srl Unipersonale
- 11.1.10.1. Company Overview
- 11.1.10.2. Products
- 11.1.10.3. Company Financials
- 11.1.10.4. SWOT Analysis
- 11.1.1 Orthofeet Inc
- 11.2. Market Entropy
- 11.2.1 Company's Key Areas Served
- 11.2.2 Recent Developments
- 11.3. Company Market Share Analysis 2025
- 11.3.1 Top 5 Companies Market Share Analysis
- 11.3.2 Top 3 Companies Market Share Analysis
- 11.4. List of Potential Customers
- 12. Research Methodology
List of Figures
- Figure 1: Global Diabetic Footwear Market Revenue Breakdown (Million, %) by Region 2025 & 2033
- Figure 2: Global Diabetic Footwear Market Volume Breakdown (K Units, %) by Region 2025 & 2033
- Figure 3: North America Diabetic Footwear Market Revenue (Million), by Product Type 2025 & 2033
- Figure 4: North America Diabetic Footwear Market Volume (K Units), by Product Type 2025 & 2033
- Figure 5: North America Diabetic Footwear Market Revenue Share (%), by Product Type 2025 & 2033
- Figure 6: North America Diabetic Footwear Market Volume Share (%), by Product Type 2025 & 2033
- Figure 7: North America Diabetic Footwear Market Revenue (Million), by End-User 2025 & 2033
- Figure 8: North America Diabetic Footwear Market Volume (K Units), by End-User 2025 & 2033
- Figure 9: North America Diabetic Footwear Market Revenue Share (%), by End-User 2025 & 2033
- Figure 10: North America Diabetic Footwear Market Volume Share (%), by End-User 2025 & 2033
- Figure 11: North America Diabetic Footwear Market Revenue (Million), by Distribution Channel 2025 & 2033
- Figure 12: North America Diabetic Footwear Market Volume (K Units), by Distribution Channel 2025 & 2033
- Figure 13: North America Diabetic Footwear Market Revenue Share (%), by Distribution Channel 2025 & 2033
- Figure 14: North America Diabetic Footwear Market Volume Share (%), by Distribution Channel 2025 & 2033
- Figure 15: North America Diabetic Footwear Market Revenue (Million), by Country 2025 & 2033
- Figure 16: North America Diabetic Footwear Market Volume (K Units), by Country 2025 & 2033
- Figure 17: North America Diabetic Footwear Market Revenue Share (%), by Country 2025 & 2033
- Figure 18: North America Diabetic Footwear Market Volume Share (%), by Country 2025 & 2033
- Figure 19: Europe Diabetic Footwear Market Revenue (Million), by Product Type 2025 & 2033
- Figure 20: Europe Diabetic Footwear Market Volume (K Units), by Product Type 2025 & 2033
- Figure 21: Europe Diabetic Footwear Market Revenue Share (%), by Product Type 2025 & 2033
- Figure 22: Europe Diabetic Footwear Market Volume Share (%), by Product Type 2025 & 2033
- Figure 23: Europe Diabetic Footwear Market Revenue (Million), by End-User 2025 & 2033
- Figure 24: Europe Diabetic Footwear Market Volume (K Units), by End-User 2025 & 2033
- Figure 25: Europe Diabetic Footwear Market Revenue Share (%), by End-User 2025 & 2033
- Figure 26: Europe Diabetic Footwear Market Volume Share (%), by End-User 2025 & 2033
- Figure 27: Europe Diabetic Footwear Market Revenue (Million), by Distribution Channel 2025 & 2033
- Figure 28: Europe Diabetic Footwear Market Volume (K Units), by Distribution Channel 2025 & 2033
- Figure 29: Europe Diabetic Footwear Market Revenue Share (%), by Distribution Channel 2025 & 2033
- Figure 30: Europe Diabetic Footwear Market Volume Share (%), by Distribution Channel 2025 & 2033
- Figure 31: Europe Diabetic Footwear Market Revenue (Million), by Country 2025 & 2033
- Figure 32: Europe Diabetic Footwear Market Volume (K Units), by Country 2025 & 2033
- Figure 33: Europe Diabetic Footwear Market Revenue Share (%), by Country 2025 & 2033
- Figure 34: Europe Diabetic Footwear Market Volume Share (%), by Country 2025 & 2033
- Figure 35: Asia Pacific Diabetic Footwear Market Revenue (Million), by Product Type 2025 & 2033
- Figure 36: Asia Pacific Diabetic Footwear Market Volume (K Units), by Product Type 2025 & 2033
- Figure 37: Asia Pacific Diabetic Footwear Market Revenue Share (%), by Product Type 2025 & 2033
- Figure 38: Asia Pacific Diabetic Footwear Market Volume Share (%), by Product Type 2025 & 2033
- Figure 39: Asia Pacific Diabetic Footwear Market Revenue (Million), by End-User 2025 & 2033
- Figure 40: Asia Pacific Diabetic Footwear Market Volume (K Units), by End-User 2025 & 2033
- Figure 41: Asia Pacific Diabetic Footwear Market Revenue Share (%), by End-User 2025 & 2033
- Figure 42: Asia Pacific Diabetic Footwear Market Volume Share (%), by End-User 2025 & 2033
- Figure 43: Asia Pacific Diabetic Footwear Market Revenue (Million), by Distribution Channel 2025 & 2033
- Figure 44: Asia Pacific Diabetic Footwear Market Volume (K Units), by Distribution Channel 2025 & 2033
- Figure 45: Asia Pacific Diabetic Footwear Market Revenue Share (%), by Distribution Channel 2025 & 2033
- Figure 46: Asia Pacific Diabetic Footwear Market Volume Share (%), by Distribution Channel 2025 & 2033
- Figure 47: Asia Pacific Diabetic Footwear Market Revenue (Million), by Country 2025 & 2033
- Figure 48: Asia Pacific Diabetic Footwear Market Volume (K Units), by Country 2025 & 2033
- Figure 49: Asia Pacific Diabetic Footwear Market Revenue Share (%), by Country 2025 & 2033
- Figure 50: Asia Pacific Diabetic Footwear Market Volume Share (%), by Country 2025 & 2033
- Figure 51: Rest of the World Diabetic Footwear Market Revenue (Million), by Product Type 2025 & 2033
- Figure 52: Rest of the World Diabetic Footwear Market Volume (K Units), by Product Type 2025 & 2033
- Figure 53: Rest of the World Diabetic Footwear Market Revenue Share (%), by Product Type 2025 & 2033
- Figure 54: Rest of the World Diabetic Footwear Market Volume Share (%), by Product Type 2025 & 2033
- Figure 55: Rest of the World Diabetic Footwear Market Revenue (Million), by End-User 2025 & 2033
- Figure 56: Rest of the World Diabetic Footwear Market Volume (K Units), by End-User 2025 & 2033
- Figure 57: Rest of the World Diabetic Footwear Market Revenue Share (%), by End-User 2025 & 2033
- Figure 58: Rest of the World Diabetic Footwear Market Volume Share (%), by End-User 2025 & 2033
- Figure 59: Rest of the World Diabetic Footwear Market Revenue (Million), by Distribution Channel 2025 & 2033
- Figure 60: Rest of the World Diabetic Footwear Market Volume (K Units), by Distribution Channel 2025 & 2033
- Figure 61: Rest of the World Diabetic Footwear Market Revenue Share (%), by Distribution Channel 2025 & 2033
- Figure 62: Rest of the World Diabetic Footwear Market Volume Share (%), by Distribution Channel 2025 & 2033
- Figure 63: Rest of the World Diabetic Footwear Market Revenue (Million), by Country 2025 & 2033
- Figure 64: Rest of the World Diabetic Footwear Market Volume (K Units), by Country 2025 & 2033
- Figure 65: Rest of the World Diabetic Footwear Market Revenue Share (%), by Country 2025 & 2033
- Figure 66: Rest of the World Diabetic Footwear Market Volume Share (%), by Country 2025 & 2033
List of Tables
- Table 1: Global Diabetic Footwear Market Revenue Million Forecast, by Product Type 2020 & 2033
- Table 2: Global Diabetic Footwear Market Volume K Units Forecast, by Product Type 2020 & 2033
- Table 3: Global Diabetic Footwear Market Revenue Million Forecast, by End-User 2020 & 2033
- Table 4: Global Diabetic Footwear Market Volume K Units Forecast, by End-User 2020 & 2033
- Table 5: Global Diabetic Footwear Market Revenue Million Forecast, by Distribution Channel 2020 & 2033
- Table 6: Global Diabetic Footwear Market Volume K Units Forecast, by Distribution Channel 2020 & 2033
- Table 7: Global Diabetic Footwear Market Revenue Million Forecast, by Region 2020 & 2033
- Table 8: Global Diabetic Footwear Market Volume K Units Forecast, by Region 2020 & 2033
- Table 9: Global Diabetic Footwear Market Revenue Million Forecast, by Product Type 2020 & 2033
- Table 10: Global Diabetic Footwear Market Volume K Units Forecast, by Product Type 2020 & 2033
- Table 11: Global Diabetic Footwear Market Revenue Million Forecast, by End-User 2020 & 2033
- Table 12: Global Diabetic Footwear Market Volume K Units Forecast, by End-User 2020 & 2033
- Table 13: Global Diabetic Footwear Market Revenue Million Forecast, by Distribution Channel 2020 & 2033
- Table 14: Global Diabetic Footwear Market Volume K Units Forecast, by Distribution Channel 2020 & 2033
- Table 15: Global Diabetic Footwear Market Revenue Million Forecast, by Country 2020 & 2033
- Table 16: Global Diabetic Footwear Market Volume K Units Forecast, by Country 2020 & 2033
- Table 17: United States Diabetic Footwear Market Revenue (Million) Forecast, by Application 2020 & 2033
- Table 18: United States Diabetic Footwear Market Volume (K Units) Forecast, by Application 2020 & 2033
- Table 19: Canada Diabetic Footwear Market Revenue (Million) Forecast, by Application 2020 & 2033
- Table 20: Canada Diabetic Footwear Market Volume (K Units) Forecast, by Application 2020 & 2033
- Table 21: Mexico Diabetic Footwear Market Revenue (Million) Forecast, by Application 2020 & 2033
- Table 22: Mexico Diabetic Footwear Market Volume (K Units) Forecast, by Application 2020 & 2033
- Table 23: Rest of North America Diabetic Footwear Market Revenue (Million) Forecast, by Application 2020 & 2033
- Table 24: Rest of North America Diabetic Footwear Market Volume (K Units) Forecast, by Application 2020 & 2033
- Table 25: Global Diabetic Footwear Market Revenue Million Forecast, by Product Type 2020 & 2033
- Table 26: Global Diabetic Footwear Market Volume K Units Forecast, by Product Type 2020 & 2033
- Table 27: Global Diabetic Footwear Market Revenue Million Forecast, by End-User 2020 & 2033
- Table 28: Global Diabetic Footwear Market Volume K Units Forecast, by End-User 2020 & 2033
- Table 29: Global Diabetic Footwear Market Revenue Million Forecast, by Distribution Channel 2020 & 2033
- Table 30: Global Diabetic Footwear Market Volume K Units Forecast, by Distribution Channel 2020 & 2033
- Table 31: Global Diabetic Footwear Market Revenue Million Forecast, by Country 2020 & 2033
- Table 32: Global Diabetic Footwear Market Volume K Units Forecast, by Country 2020 & 2033
- Table 33: United Kingdom Diabetic Footwear Market Revenue (Million) Forecast, by Application 2020 & 2033
- Table 34: United Kingdom Diabetic Footwear Market Volume (K Units) Forecast, by Application 2020 & 2033
- Table 35: Germany Diabetic Footwear Market Revenue (Million) Forecast, by Application 2020 & 2033
- Table 36: Germany Diabetic Footwear Market Volume (K Units) Forecast, by Application 2020 & 2033
- Table 37: France Diabetic Footwear Market Revenue (Million) Forecast, by Application 2020 & 2033
- Table 38: France Diabetic Footwear Market Volume (K Units) Forecast, by Application 2020 & 2033
- Table 39: Italy Diabetic Footwear Market Revenue (Million) Forecast, by Application 2020 & 2033
- Table 40: Italy Diabetic Footwear Market Volume (K Units) Forecast, by Application 2020 & 2033
- Table 41: Spain Diabetic Footwear Market Revenue (Million) Forecast, by Application 2020 & 2033
- Table 42: Spain Diabetic Footwear Market Volume (K Units) Forecast, by Application 2020 & 2033
- Table 43: Russia Diabetic Footwear Market Revenue (Million) Forecast, by Application 2020 & 2033
- Table 44: Russia Diabetic Footwear Market Volume (K Units) Forecast, by Application 2020 & 2033
- Table 45: Rest of Europe Diabetic Footwear Market Revenue (Million) Forecast, by Application 2020 & 2033
- Table 46: Rest of Europe Diabetic Footwear Market Volume (K Units) Forecast, by Application 2020 & 2033
- Table 47: Global Diabetic Footwear Market Revenue Million Forecast, by Product Type 2020 & 2033
- Table 48: Global Diabetic Footwear Market Volume K Units Forecast, by Product Type 2020 & 2033
- Table 49: Global Diabetic Footwear Market Revenue Million Forecast, by End-User 2020 & 2033
- Table 50: Global Diabetic Footwear Market Volume K Units Forecast, by End-User 2020 & 2033
- Table 51: Global Diabetic Footwear Market Revenue Million Forecast, by Distribution Channel 2020 & 2033
- Table 52: Global Diabetic Footwear Market Volume K Units Forecast, by Distribution Channel 2020 & 2033
- Table 53: Global Diabetic Footwear Market Revenue Million Forecast, by Country 2020 & 2033
- Table 54: Global Diabetic Footwear Market Volume K Units Forecast, by Country 2020 & 2033
- Table 55: China Diabetic Footwear Market Revenue (Million) Forecast, by Application 2020 & 2033
- Table 56: China Diabetic Footwear Market Volume (K Units) Forecast, by Application 2020 & 2033
- Table 57: Japan Diabetic Footwear Market Revenue (Million) Forecast, by Application 2020 & 2033
- Table 58: Japan Diabetic Footwear Market Volume (K Units) Forecast, by Application 2020 & 2033
- Table 59: India Diabetic Footwear Market Revenue (Million) Forecast, by Application 2020 & 2033
- Table 60: India Diabetic Footwear Market Volume (K Units) Forecast, by Application 2020 & 2033
- Table 61: Australia Diabetic Footwear Market Revenue (Million) Forecast, by Application 2020 & 2033
- Table 62: Australia Diabetic Footwear Market Volume (K Units) Forecast, by Application 2020 & 2033
- Table 63: Rest of Asia Pacific Diabetic Footwear Market Revenue (Million) Forecast, by Application 2020 & 2033
- Table 64: Rest of Asia Pacific Diabetic Footwear Market Volume (K Units) Forecast, by Application 2020 & 2033
- Table 65: Global Diabetic Footwear Market Revenue Million Forecast, by Product Type 2020 & 2033
- Table 66: Global Diabetic Footwear Market Volume K Units Forecast, by Product Type 2020 & 2033
- Table 67: Global Diabetic Footwear Market Revenue Million Forecast, by End-User 2020 & 2033
- Table 68: Global Diabetic Footwear Market Volume K Units Forecast, by End-User 2020 & 2033
- Table 69: Global Diabetic Footwear Market Revenue Million Forecast, by Distribution Channel 2020 & 2033
- Table 70: Global Diabetic Footwear Market Volume K Units Forecast, by Distribution Channel 2020 & 2033
- Table 71: Global Diabetic Footwear Market Revenue Million Forecast, by Country 2020 & 2033
- Table 72: Global Diabetic Footwear Market Volume K Units Forecast, by Country 2020 & 2033
- Table 73: South America Diabetic Footwear Market Revenue (Million) Forecast, by Application 2020 & 2033
- Table 74: South America Diabetic Footwear Market Volume (K Units) Forecast, by Application 2020 & 2033
- Table 75: Middle East and Africa Diabetic Footwear Market Revenue (Million) Forecast, by Application 2020 & 2033
- Table 76: Middle East and Africa Diabetic Footwear Market Volume (K Units) Forecast, by Application 2020 & 2033
Frequently Asked Questions
1. What is the projected Compound Annual Growth Rate (CAGR) of the Diabetic Footwear Market?
The projected CAGR is approximately 6.28%.
2. Which companies are prominent players in the Diabetic Footwear Market?
Key companies in the market include Orthofeet Inc, Propét USA Inc, Aetrex Worldwide Inc, Hanger Inc, Healer Health LLC, Pilgrim Shoes*List Not Exhaustive, Drew Shoe Corporation, DJO Global Inc, Dr Zen Products Inc, Podartis srl Unipersonale.
3. What are the main segments of the Diabetic Footwear Market?
The market segments include Product Type, End-User, Distribution Channel.
4. Can you provide details about the market size?
The market size is estimated to be USD 8.14 Million as of 2022.
5. What are some drivers contributing to market growth?
Rising Diabetic Population Across the Globe; Innovative and Fashionable Footwear.
6. What are the notable trends driving market growth?
Diabetic Shoes Are the Most Popular Footwear Type.
7. Are there any restraints impacting market growth?
Enhanced Presence of Counterfeit and Poor-Quality Products.
8. Can you provide examples of recent developments in the market?
November 2023: Aetrex launched a new personalized footwear recommendation platform – FitStarter, developed with shoe fit testing company Heeluxe, to help retailers improve their shoe fitting service for shoppers, reduce returns, and increase customer satisfaction.
9. What pricing options are available for accessing the report?
Pricing options include single-user, multi-user, and enterprise licenses priced at USD 4750, USD 5250, and USD 8750 respectively.
10. Is the market size provided in terms of value or volume?
The market size is provided in terms of value, measured in Million and volume, measured in K Units.
11. Are there any specific market keywords associated with the report?
Yes, the market keyword associated with the report is "Diabetic Footwear Market," which aids in identifying and referencing the specific market segment covered.
12. How do I determine which pricing option suits my needs best?
The pricing options vary based on user requirements and access needs. Individual users may opt for single-user licenses, while businesses requiring broader access may choose multi-user or enterprise licenses for cost-effective access to the report.
13. Are there any additional resources or data provided in the Diabetic Footwear Market report?
While the report offers comprehensive insights, it's advisable to review the specific contents or supplementary materials provided to ascertain if additional resources or data are available.
14. How can I stay updated on further developments or reports in the Diabetic Footwear Market?
To stay informed about further developments, trends, and reports in the Diabetic Footwear Market, consider subscribing to industry newsletters, following relevant companies and organizations, or regularly checking reputable industry news sources and publications.
Methodology
Step 1 - Identification of Relevant Samples Size from Population Database


Step 2 - Approaches for Defining Global Market Size (Value, Volume* & Price*)

Note*: In applicable scenarios
Step 3 - Data Sources
Primary Research
- Web Analytics
- Survey Reports
- Research Institute
- Latest Research Reports
- Opinion Leaders
Secondary Research
- Annual Reports
- White Paper
- Latest Press Release
- Industry Association
- Paid Database
- Investor Presentations

Step 4 - Data Triangulation
Involves using different sources of information in order to increase the validity of a study
These sources are likely to be stakeholders in a program - participants, other researchers, program staff, other community members, and so on.
Then we put all data in single framework & apply various statistical tools to find out the dynamic on the market.
During the analysis stage, feedback from the stakeholder groups would be compared to determine areas of agreement as well as areas of divergence