
Key Insights
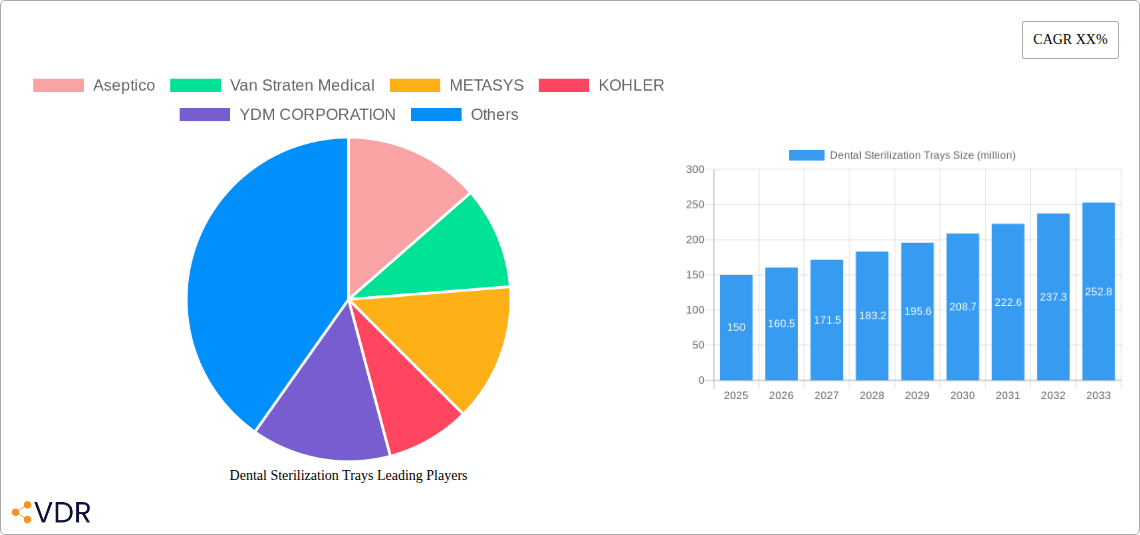
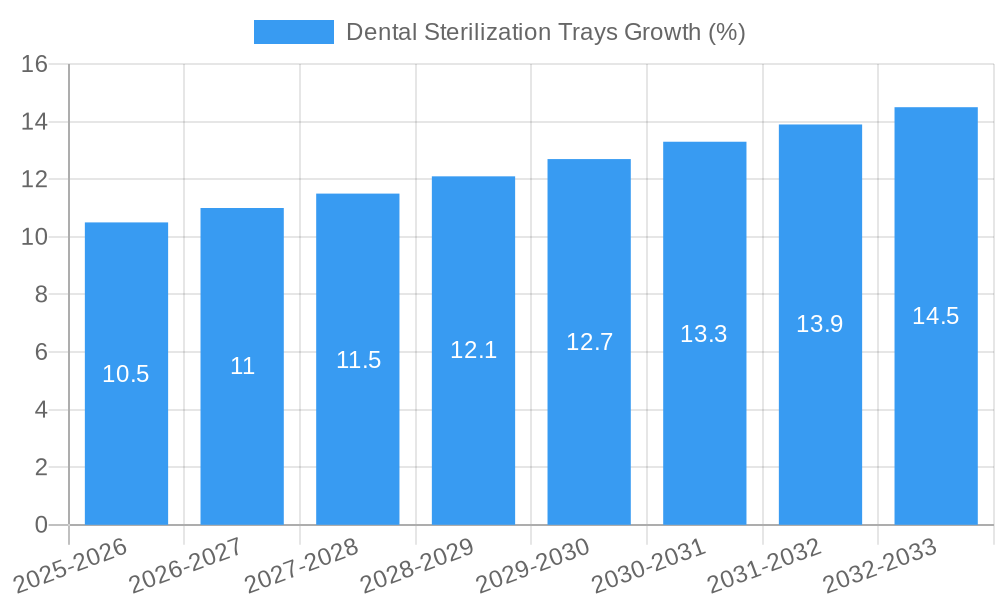
The global market for dental sterilization trays is experiencing robust growth, driven by increasing dental procedures, stringent infection control regulations, and a rising awareness of hygiene protocols within dental practices. The market, estimated at $150 million in 2025, is projected to exhibit a Compound Annual Growth Rate (CAGR) of 7% from 2025 to 2033, reaching an estimated value of $275 million by 2033. This expansion is fueled by several key factors: the adoption of advanced sterilization techniques, a growing preference for single-use trays to mitigate cross-contamination risks, and technological advancements leading to more efficient and durable sterilization trays. Furthermore, the expansion of dental clinics globally, particularly in emerging economies, is contributing significantly to market growth. However, factors such as high initial investment costs associated with advanced sterilization equipment and the potential for price fluctuations in raw materials pose some constraints.
The market is segmented based on material type (stainless steel, plastic, others), tray size, and end-user (dental clinics, hospitals, laboratories). Key players like Aseptico, Van Straten Medical, and METASYS are driving innovation through product diversification and strategic partnerships. Regional analysis reveals a strong market presence in North America and Europe, primarily due to higher adoption rates of advanced sterilization technologies and robust healthcare infrastructure. However, Asia-Pacific is expected to witness significant growth in the coming years, driven by rising disposable incomes, expanding dental tourism, and increasing investments in healthcare facilities. The forecast period (2025-2033) presents considerable opportunities for market players to capitalize on the rising demand for high-quality, efficient, and safe dental sterilization trays.
Dental Sterilization Trays Market Report: 2019-2033
This comprehensive report provides a detailed analysis of the Dental Sterilization Trays market, encompassing market dynamics, growth trends, regional dominance, product landscape, key players, and future outlook. The study period spans 2019-2033, with 2025 serving as the base and estimated year. The forecast period covers 2025-2033, while the historical period analyzed is 2019-2024. The market is segmented by type (e.g., reusable, disposable) and end-user (dental clinics, hospitals). The parent market is the dental consumables market (valued at xx million units in 2025), and the child market is sterilization equipment within dental practices.
Dental Sterilization Trays Market Dynamics & Structure
This section analyzes the competitive landscape, technological advancements, regulatory influences, and market trends impacting the dental sterilization trays market. The market is moderately concentrated, with the top five players holding approximately xx% market share in 2025.
- Market Concentration: Moderate, with top 5 players holding approximately xx% market share in 2025.
- Technological Innovation: Focus on improving sterilization efficacy, material durability, and ease of use. Innovation barriers include high R&D costs and stringent regulatory approvals.
- Regulatory Frameworks: Stringent regulations governing medical device sterilization and safety significantly impact market dynamics. Compliance costs can be a barrier for smaller players. FDA and other regional regulations are key factors.
- Competitive Product Substitutes: Limited direct substitutes exist; however, alternative sterilization methods (e.g., autoclaves) present indirect competition.
- End-User Demographics: Primarily dental clinics and hospitals, with growth driven by increasing dental procedures and stricter infection control protocols.
- M&A Trends: A moderate number of M&A activities (xx deals) were observed between 2019-2024, primarily focused on expanding product portfolios and geographical reach. Deal value totaled approximately xx million USD.
Dental Sterilization Trays Growth Trends & Insights
The global dental sterilization trays market is experiencing robust growth, driven by factors such as rising dental tourism, increasing geriatric population, and growing awareness about infection control. The market size was valued at xx million units in 2024 and is projected to reach xx million units by 2033, exhibiting a CAGR of xx% during the forecast period. This growth is fueled by the increasing adoption of disposable trays and the rising demand for advanced sterilization technologies. Consumer behavior shifts towards greater hygiene awareness and preference for single-use products are also impacting market dynamics. Technological disruptions, such as the introduction of innovative materials and sterilization methods, are driving further market expansion. Market penetration remains relatively high in developed regions but offers significant potential in emerging economies.
Dominant Regions, Countries, or Segments in Dental Sterilization Trays
North America currently dominates the global dental sterilization trays market, holding approximately xx% market share in 2025, followed by Europe (xx%) and Asia-Pacific (xx%).
- North America Dominance: Driven by high dental treatment rates, advanced healthcare infrastructure, and strong regulatory frameworks.
- European Market: Characterized by a mature market with established players and stringent regulatory compliance requirements.
- Asia-Pacific Growth: Promising growth potential due to rising disposable incomes, increasing dental awareness, and expanding healthcare infrastructure. China and India are key growth drivers.
- Key Drivers: High prevalence of dental diseases, increasing dental tourism, stringent infection control protocols, rising disposable incomes (especially in APAC), and government initiatives promoting oral healthcare.
Dental Sterilization Trays Product Landscape
Dental sterilization trays are available in various materials (e.g., stainless steel, polypropylene) and designs, catering to diverse sterilization methods and dental procedures. Recent innovations focus on improving tray durability, reducing costs, and enhancing sterilization efficiency. Unique selling propositions include features like improved sterilization efficacy, enhanced material resistance, and ergonomic designs for ease of use. Technological advancements include the incorporation of antimicrobial materials and improved tray designs for optimal instrument placement.
Key Drivers, Barriers & Challenges in Dental Sterilization Trays
Key Drivers:
- Rising prevalence of dental diseases globally.
- Stringent infection control protocols in healthcare settings.
- Increasing demand for disposable sterilization trays.
- Technological advancements in sterilization methods and materials.
Challenges & Restraints:
- High initial investment costs for advanced sterilization equipment.
- Stringent regulatory compliance requirements.
- Competition from alternative sterilization methods.
- Potential supply chain disruptions impacting raw material availability and pricing. This factor led to a xx% increase in costs in 2022.
Emerging Opportunities in Dental Sterilization Trays
- Expansion into emerging markets with growing dental care infrastructure.
- Development of eco-friendly and sustainable sterilization trays.
- Integration of smart technologies for automated sterilization tracking and management.
- Customization of trays for specific dental procedures and instruments.
Growth Accelerators in the Dental Sterilization Trays Industry
Technological breakthroughs, particularly in sterilization techniques and materials, are key growth accelerators. Strategic partnerships between tray manufacturers and dental equipment suppliers are also driving market expansion. Expanding into new geographical markets and offering customized solutions tailored to specific dental practices further fuel market growth.
Key Players Shaping the Dental Sterilization Trays Market
- Aseptico
- Van Straten Medical
- METASYS
- KOHLER
- YDM CORPORATION
- DiaDent
- AIP Médical
- Zirc
- A. Schweickhardt
- Medesy
- AR Instrumed Deutschland
Notable Milestones in Dental Sterilization Trays Sector
- 2021: Introduction of a new eco-friendly, biodegradable sterilization tray by Aseptico.
- 2022: Merger between two key players, resulting in expanded market reach. (Company names not publicly available)
- 2023: Launch of a new high-capacity sterilization tray by YDM CORPORATION.
In-Depth Dental Sterilization Trays Market Outlook
The dental sterilization trays market is poised for continued growth, driven by technological innovations, expanding healthcare infrastructure, and rising awareness of infection control protocols. Strategic partnerships, market expansion into emerging economies, and the development of sustainable sterilization solutions will shape future market dynamics. The market presents significant opportunities for established players and new entrants alike. The projected market size in 2033 suggests substantial potential for growth and investment.
Dental Sterilization Trays Segmentation
-
1. Application
- 1.1. Hospital
- 1.2. Dental Clinic
- 1.3. Others
-
2. Types
- 2.1. Normal Tray
- 2.2. Mesh Tray
Dental Sterilization Trays Segmentation By Geography
-
1. North America
- 1.1. United States
- 1.2. Canada
- 1.3. Mexico
-
2. South America
- 2.1. Brazil
- 2.2. Argentina
- 2.3. Rest of South America
-
3. Europe
- 3.1. United Kingdom
- 3.2. Germany
- 3.3. France
- 3.4. Italy
- 3.5. Spain
- 3.6. Russia
- 3.7. Benelux
- 3.8. Nordics
- 3.9. Rest of Europe
-
4. Middle East & Africa
- 4.1. Turkey
- 4.2. Israel
- 4.3. GCC
- 4.4. North Africa
- 4.5. South Africa
- 4.6. Rest of Middle East & Africa
-
5. Asia Pacific
- 5.1. China
- 5.2. India
- 5.3. Japan
- 5.4. South Korea
- 5.5. ASEAN
- 5.6. Oceania
- 5.7. Rest of Asia Pacific

Dental Sterilization Trays REPORT HIGHLIGHTS
| Aspects | Details |
|---|---|
| Study Period | 2019-2033 |
| Base Year | 2024 |
| Estimated Year | 2025 |
| Forecast Period | 2025-2033 |
| Historical Period | 2019-2024 |
| Growth Rate | CAGR of XX% from 2019-2033 |
| Segmentation |
|
Table of Contents
- 1. Introduction
- 1.1. Research Scope
- 1.2. Market Segmentation
- 1.3. Research Methodology
- 1.4. Definitions and Assumptions
- 2. Executive Summary
- 2.1. Introduction
- 3. Market Dynamics
- 3.1. Introduction
- 3.2. Market Drivers
- 3.3. Market Restrains
- 3.4. Market Trends
- 4. Market Factor Analysis
- 4.1. Porters Five Forces
- 4.2. Supply/Value Chain
- 4.3. PESTEL analysis
- 4.4. Market Entropy
- 4.5. Patent/Trademark Analysis
- 5. Global Dental Sterilization Trays Analysis, Insights and Forecast, 2019-2031
- 5.1. Market Analysis, Insights and Forecast - by Application
- 5.1.1. Hospital
- 5.1.2. Dental Clinic
- 5.1.3. Others
- 5.2. Market Analysis, Insights and Forecast - by Types
- 5.2.1. Normal Tray
- 5.2.2. Mesh Tray
- 5.3. Market Analysis, Insights and Forecast - by Region
- 5.3.1. North America
- 5.3.2. South America
- 5.3.3. Europe
- 5.3.4. Middle East & Africa
- 5.3.5. Asia Pacific
- 5.1. Market Analysis, Insights and Forecast - by Application
- 6. North America Dental Sterilization Trays Analysis, Insights and Forecast, 2019-2031
- 6.1. Market Analysis, Insights and Forecast - by Application
- 6.1.1. Hospital
- 6.1.2. Dental Clinic
- 6.1.3. Others
- 6.2. Market Analysis, Insights and Forecast - by Types
- 6.2.1. Normal Tray
- 6.2.2. Mesh Tray
- 6.1. Market Analysis, Insights and Forecast - by Application
- 7. South America Dental Sterilization Trays Analysis, Insights and Forecast, 2019-2031
- 7.1. Market Analysis, Insights and Forecast - by Application
- 7.1.1. Hospital
- 7.1.2. Dental Clinic
- 7.1.3. Others
- 7.2. Market Analysis, Insights and Forecast - by Types
- 7.2.1. Normal Tray
- 7.2.2. Mesh Tray
- 7.1. Market Analysis, Insights and Forecast - by Application
- 8. Europe Dental Sterilization Trays Analysis, Insights and Forecast, 2019-2031
- 8.1. Market Analysis, Insights and Forecast - by Application
- 8.1.1. Hospital
- 8.1.2. Dental Clinic
- 8.1.3. Others
- 8.2. Market Analysis, Insights and Forecast - by Types
- 8.2.1. Normal Tray
- 8.2.2. Mesh Tray
- 8.1. Market Analysis, Insights and Forecast - by Application
- 9. Middle East & Africa Dental Sterilization Trays Analysis, Insights and Forecast, 2019-2031
- 9.1. Market Analysis, Insights and Forecast - by Application
- 9.1.1. Hospital
- 9.1.2. Dental Clinic
- 9.1.3. Others
- 9.2. Market Analysis, Insights and Forecast - by Types
- 9.2.1. Normal Tray
- 9.2.2. Mesh Tray
- 9.1. Market Analysis, Insights and Forecast - by Application
- 10. Asia Pacific Dental Sterilization Trays Analysis, Insights and Forecast, 2019-2031
- 10.1. Market Analysis, Insights and Forecast - by Application
- 10.1.1. Hospital
- 10.1.2. Dental Clinic
- 10.1.3. Others
- 10.2. Market Analysis, Insights and Forecast - by Types
- 10.2.1. Normal Tray
- 10.2.2. Mesh Tray
- 10.1. Market Analysis, Insights and Forecast - by Application
- 11. Competitive Analysis
- 11.1. Global Market Share Analysis 2024
- 11.2. Company Profiles
- 11.2.1 Aseptico
- 11.2.1.1. Overview
- 11.2.1.2. Products
- 11.2.1.3. SWOT Analysis
- 11.2.1.4. Recent Developments
- 11.2.1.5. Financials (Based on Availability)
- 11.2.2 Van Straten Medical
- 11.2.2.1. Overview
- 11.2.2.2. Products
- 11.2.2.3. SWOT Analysis
- 11.2.2.4. Recent Developments
- 11.2.2.5. Financials (Based on Availability)
- 11.2.3 METASYS
- 11.2.3.1. Overview
- 11.2.3.2. Products
- 11.2.3.3. SWOT Analysis
- 11.2.3.4. Recent Developments
- 11.2.3.5. Financials (Based on Availability)
- 11.2.4 KOHLER
- 11.2.4.1. Overview
- 11.2.4.2. Products
- 11.2.4.3. SWOT Analysis
- 11.2.4.4. Recent Developments
- 11.2.4.5. Financials (Based on Availability)
- 11.2.5 YDM CORPORATION
- 11.2.5.1. Overview
- 11.2.5.2. Products
- 11.2.5.3. SWOT Analysis
- 11.2.5.4. Recent Developments
- 11.2.5.5. Financials (Based on Availability)
- 11.2.6 DiaDent
- 11.2.6.1. Overview
- 11.2.6.2. Products
- 11.2.6.3. SWOT Analysis
- 11.2.6.4. Recent Developments
- 11.2.6.5. Financials (Based on Availability)
- 11.2.7 AIP Médical
- 11.2.7.1. Overview
- 11.2.7.2. Products
- 11.2.7.3. SWOT Analysis
- 11.2.7.4. Recent Developments
- 11.2.7.5. Financials (Based on Availability)
- 11.2.8 Zirc
- 11.2.8.1. Overview
- 11.2.8.2. Products
- 11.2.8.3. SWOT Analysis
- 11.2.8.4. Recent Developments
- 11.2.8.5. Financials (Based on Availability)
- 11.2.9 A. Schweickhardt
- 11.2.9.1. Overview
- 11.2.9.2. Products
- 11.2.9.3. SWOT Analysis
- 11.2.9.4. Recent Developments
- 11.2.9.5. Financials (Based on Availability)
- 11.2.10 Medesy
- 11.2.10.1. Overview
- 11.2.10.2. Products
- 11.2.10.3. SWOT Analysis
- 11.2.10.4. Recent Developments
- 11.2.10.5. Financials (Based on Availability)
- 11.2.11 AR Instrumed Deutschland
- 11.2.11.1. Overview
- 11.2.11.2. Products
- 11.2.11.3. SWOT Analysis
- 11.2.11.4. Recent Developments
- 11.2.11.5. Financials (Based on Availability)
- 11.2.1 Aseptico
List of Figures
- Figure 1: Global Dental Sterilization Trays Revenue Breakdown (million, %) by Region 2024 & 2032
- Figure 2: Global Dental Sterilization Trays Volume Breakdown (K, %) by Region 2024 & 2032
- Figure 3: North America Dental Sterilization Trays Revenue (million), by Application 2024 & 2032
- Figure 4: North America Dental Sterilization Trays Volume (K), by Application 2024 & 2032
- Figure 5: North America Dental Sterilization Trays Revenue Share (%), by Application 2024 & 2032
- Figure 6: North America Dental Sterilization Trays Volume Share (%), by Application 2024 & 2032
- Figure 7: North America Dental Sterilization Trays Revenue (million), by Types 2024 & 2032
- Figure 8: North America Dental Sterilization Trays Volume (K), by Types 2024 & 2032
- Figure 9: North America Dental Sterilization Trays Revenue Share (%), by Types 2024 & 2032
- Figure 10: North America Dental Sterilization Trays Volume Share (%), by Types 2024 & 2032
- Figure 11: North America Dental Sterilization Trays Revenue (million), by Country 2024 & 2032
- Figure 12: North America Dental Sterilization Trays Volume (K), by Country 2024 & 2032
- Figure 13: North America Dental Sterilization Trays Revenue Share (%), by Country 2024 & 2032
- Figure 14: North America Dental Sterilization Trays Volume Share (%), by Country 2024 & 2032
- Figure 15: South America Dental Sterilization Trays Revenue (million), by Application 2024 & 2032
- Figure 16: South America Dental Sterilization Trays Volume (K), by Application 2024 & 2032
- Figure 17: South America Dental Sterilization Trays Revenue Share (%), by Application 2024 & 2032
- Figure 18: South America Dental Sterilization Trays Volume Share (%), by Application 2024 & 2032
- Figure 19: South America Dental Sterilization Trays Revenue (million), by Types 2024 & 2032
- Figure 20: South America Dental Sterilization Trays Volume (K), by Types 2024 & 2032
- Figure 21: South America Dental Sterilization Trays Revenue Share (%), by Types 2024 & 2032
- Figure 22: South America Dental Sterilization Trays Volume Share (%), by Types 2024 & 2032
- Figure 23: South America Dental Sterilization Trays Revenue (million), by Country 2024 & 2032
- Figure 24: South America Dental Sterilization Trays Volume (K), by Country 2024 & 2032
- Figure 25: South America Dental Sterilization Trays Revenue Share (%), by Country 2024 & 2032
- Figure 26: South America Dental Sterilization Trays Volume Share (%), by Country 2024 & 2032
- Figure 27: Europe Dental Sterilization Trays Revenue (million), by Application 2024 & 2032
- Figure 28: Europe Dental Sterilization Trays Volume (K), by Application 2024 & 2032
- Figure 29: Europe Dental Sterilization Trays Revenue Share (%), by Application 2024 & 2032
- Figure 30: Europe Dental Sterilization Trays Volume Share (%), by Application 2024 & 2032
- Figure 31: Europe Dental Sterilization Trays Revenue (million), by Types 2024 & 2032
- Figure 32: Europe Dental Sterilization Trays Volume (K), by Types 2024 & 2032
- Figure 33: Europe Dental Sterilization Trays Revenue Share (%), by Types 2024 & 2032
- Figure 34: Europe Dental Sterilization Trays Volume Share (%), by Types 2024 & 2032
- Figure 35: Europe Dental Sterilization Trays Revenue (million), by Country 2024 & 2032
- Figure 36: Europe Dental Sterilization Trays Volume (K), by Country 2024 & 2032
- Figure 37: Europe Dental Sterilization Trays Revenue Share (%), by Country 2024 & 2032
- Figure 38: Europe Dental Sterilization Trays Volume Share (%), by Country 2024 & 2032
- Figure 39: Middle East & Africa Dental Sterilization Trays Revenue (million), by Application 2024 & 2032
- Figure 40: Middle East & Africa Dental Sterilization Trays Volume (K), by Application 2024 & 2032
- Figure 41: Middle East & Africa Dental Sterilization Trays Revenue Share (%), by Application 2024 & 2032
- Figure 42: Middle East & Africa Dental Sterilization Trays Volume Share (%), by Application 2024 & 2032
- Figure 43: Middle East & Africa Dental Sterilization Trays Revenue (million), by Types 2024 & 2032
- Figure 44: Middle East & Africa Dental Sterilization Trays Volume (K), by Types 2024 & 2032
- Figure 45: Middle East & Africa Dental Sterilization Trays Revenue Share (%), by Types 2024 & 2032
- Figure 46: Middle East & Africa Dental Sterilization Trays Volume Share (%), by Types 2024 & 2032
- Figure 47: Middle East & Africa Dental Sterilization Trays Revenue (million), by Country 2024 & 2032
- Figure 48: Middle East & Africa Dental Sterilization Trays Volume (K), by Country 2024 & 2032
- Figure 49: Middle East & Africa Dental Sterilization Trays Revenue Share (%), by Country 2024 & 2032
- Figure 50: Middle East & Africa Dental Sterilization Trays Volume Share (%), by Country 2024 & 2032
- Figure 51: Asia Pacific Dental Sterilization Trays Revenue (million), by Application 2024 & 2032
- Figure 52: Asia Pacific Dental Sterilization Trays Volume (K), by Application 2024 & 2032
- Figure 53: Asia Pacific Dental Sterilization Trays Revenue Share (%), by Application 2024 & 2032
- Figure 54: Asia Pacific Dental Sterilization Trays Volume Share (%), by Application 2024 & 2032
- Figure 55: Asia Pacific Dental Sterilization Trays Revenue (million), by Types 2024 & 2032
- Figure 56: Asia Pacific Dental Sterilization Trays Volume (K), by Types 2024 & 2032
- Figure 57: Asia Pacific Dental Sterilization Trays Revenue Share (%), by Types 2024 & 2032
- Figure 58: Asia Pacific Dental Sterilization Trays Volume Share (%), by Types 2024 & 2032
- Figure 59: Asia Pacific Dental Sterilization Trays Revenue (million), by Country 2024 & 2032
- Figure 60: Asia Pacific Dental Sterilization Trays Volume (K), by Country 2024 & 2032
- Figure 61: Asia Pacific Dental Sterilization Trays Revenue Share (%), by Country 2024 & 2032
- Figure 62: Asia Pacific Dental Sterilization Trays Volume Share (%), by Country 2024 & 2032
List of Tables
- Table 1: Global Dental Sterilization Trays Revenue million Forecast, by Region 2019 & 2032
- Table 2: Global Dental Sterilization Trays Volume K Forecast, by Region 2019 & 2032
- Table 3: Global Dental Sterilization Trays Revenue million Forecast, by Application 2019 & 2032
- Table 4: Global Dental Sterilization Trays Volume K Forecast, by Application 2019 & 2032
- Table 5: Global Dental Sterilization Trays Revenue million Forecast, by Types 2019 & 2032
- Table 6: Global Dental Sterilization Trays Volume K Forecast, by Types 2019 & 2032
- Table 7: Global Dental Sterilization Trays Revenue million Forecast, by Region 2019 & 2032
- Table 8: Global Dental Sterilization Trays Volume K Forecast, by Region 2019 & 2032
- Table 9: Global Dental Sterilization Trays Revenue million Forecast, by Application 2019 & 2032
- Table 10: Global Dental Sterilization Trays Volume K Forecast, by Application 2019 & 2032
- Table 11: Global Dental Sterilization Trays Revenue million Forecast, by Types 2019 & 2032
- Table 12: Global Dental Sterilization Trays Volume K Forecast, by Types 2019 & 2032
- Table 13: Global Dental Sterilization Trays Revenue million Forecast, by Country 2019 & 2032
- Table 14: Global Dental Sterilization Trays Volume K Forecast, by Country 2019 & 2032
- Table 15: United States Dental Sterilization Trays Revenue (million) Forecast, by Application 2019 & 2032
- Table 16: United States Dental Sterilization Trays Volume (K) Forecast, by Application 2019 & 2032
- Table 17: Canada Dental Sterilization Trays Revenue (million) Forecast, by Application 2019 & 2032
- Table 18: Canada Dental Sterilization Trays Volume (K) Forecast, by Application 2019 & 2032
- Table 19: Mexico Dental Sterilization Trays Revenue (million) Forecast, by Application 2019 & 2032
- Table 20: Mexico Dental Sterilization Trays Volume (K) Forecast, by Application 2019 & 2032
- Table 21: Global Dental Sterilization Trays Revenue million Forecast, by Application 2019 & 2032
- Table 22: Global Dental Sterilization Trays Volume K Forecast, by Application 2019 & 2032
- Table 23: Global Dental Sterilization Trays Revenue million Forecast, by Types 2019 & 2032
- Table 24: Global Dental Sterilization Trays Volume K Forecast, by Types 2019 & 2032
- Table 25: Global Dental Sterilization Trays Revenue million Forecast, by Country 2019 & 2032
- Table 26: Global Dental Sterilization Trays Volume K Forecast, by Country 2019 & 2032
- Table 27: Brazil Dental Sterilization Trays Revenue (million) Forecast, by Application 2019 & 2032
- Table 28: Brazil Dental Sterilization Trays Volume (K) Forecast, by Application 2019 & 2032
- Table 29: Argentina Dental Sterilization Trays Revenue (million) Forecast, by Application 2019 & 2032
- Table 30: Argentina Dental Sterilization Trays Volume (K) Forecast, by Application 2019 & 2032
- Table 31: Rest of South America Dental Sterilization Trays Revenue (million) Forecast, by Application 2019 & 2032
- Table 32: Rest of South America Dental Sterilization Trays Volume (K) Forecast, by Application 2019 & 2032
- Table 33: Global Dental Sterilization Trays Revenue million Forecast, by Application 2019 & 2032
- Table 34: Global Dental Sterilization Trays Volume K Forecast, by Application 2019 & 2032
- Table 35: Global Dental Sterilization Trays Revenue million Forecast, by Types 2019 & 2032
- Table 36: Global Dental Sterilization Trays Volume K Forecast, by Types 2019 & 2032
- Table 37: Global Dental Sterilization Trays Revenue million Forecast, by Country 2019 & 2032
- Table 38: Global Dental Sterilization Trays Volume K Forecast, by Country 2019 & 2032
- Table 39: United Kingdom Dental Sterilization Trays Revenue (million) Forecast, by Application 2019 & 2032
- Table 40: United Kingdom Dental Sterilization Trays Volume (K) Forecast, by Application 2019 & 2032
- Table 41: Germany Dental Sterilization Trays Revenue (million) Forecast, by Application 2019 & 2032
- Table 42: Germany Dental Sterilization Trays Volume (K) Forecast, by Application 2019 & 2032
- Table 43: France Dental Sterilization Trays Revenue (million) Forecast, by Application 2019 & 2032
- Table 44: France Dental Sterilization Trays Volume (K) Forecast, by Application 2019 & 2032
- Table 45: Italy Dental Sterilization Trays Revenue (million) Forecast, by Application 2019 & 2032
- Table 46: Italy Dental Sterilization Trays Volume (K) Forecast, by Application 2019 & 2032
- Table 47: Spain Dental Sterilization Trays Revenue (million) Forecast, by Application 2019 & 2032
- Table 48: Spain Dental Sterilization Trays Volume (K) Forecast, by Application 2019 & 2032
- Table 49: Russia Dental Sterilization Trays Revenue (million) Forecast, by Application 2019 & 2032
- Table 50: Russia Dental Sterilization Trays Volume (K) Forecast, by Application 2019 & 2032
- Table 51: Benelux Dental Sterilization Trays Revenue (million) Forecast, by Application 2019 & 2032
- Table 52: Benelux Dental Sterilization Trays Volume (K) Forecast, by Application 2019 & 2032
- Table 53: Nordics Dental Sterilization Trays Revenue (million) Forecast, by Application 2019 & 2032
- Table 54: Nordics Dental Sterilization Trays Volume (K) Forecast, by Application 2019 & 2032
- Table 55: Rest of Europe Dental Sterilization Trays Revenue (million) Forecast, by Application 2019 & 2032
- Table 56: Rest of Europe Dental Sterilization Trays Volume (K) Forecast, by Application 2019 & 2032
- Table 57: Global Dental Sterilization Trays Revenue million Forecast, by Application 2019 & 2032
- Table 58: Global Dental Sterilization Trays Volume K Forecast, by Application 2019 & 2032
- Table 59: Global Dental Sterilization Trays Revenue million Forecast, by Types 2019 & 2032
- Table 60: Global Dental Sterilization Trays Volume K Forecast, by Types 2019 & 2032
- Table 61: Global Dental Sterilization Trays Revenue million Forecast, by Country 2019 & 2032
- Table 62: Global Dental Sterilization Trays Volume K Forecast, by Country 2019 & 2032
- Table 63: Turkey Dental Sterilization Trays Revenue (million) Forecast, by Application 2019 & 2032
- Table 64: Turkey Dental Sterilization Trays Volume (K) Forecast, by Application 2019 & 2032
- Table 65: Israel Dental Sterilization Trays Revenue (million) Forecast, by Application 2019 & 2032
- Table 66: Israel Dental Sterilization Trays Volume (K) Forecast, by Application 2019 & 2032
- Table 67: GCC Dental Sterilization Trays Revenue (million) Forecast, by Application 2019 & 2032
- Table 68: GCC Dental Sterilization Trays Volume (K) Forecast, by Application 2019 & 2032
- Table 69: North Africa Dental Sterilization Trays Revenue (million) Forecast, by Application 2019 & 2032
- Table 70: North Africa Dental Sterilization Trays Volume (K) Forecast, by Application 2019 & 2032
- Table 71: South Africa Dental Sterilization Trays Revenue (million) Forecast, by Application 2019 & 2032
- Table 72: South Africa Dental Sterilization Trays Volume (K) Forecast, by Application 2019 & 2032
- Table 73: Rest of Middle East & Africa Dental Sterilization Trays Revenue (million) Forecast, by Application 2019 & 2032
- Table 74: Rest of Middle East & Africa Dental Sterilization Trays Volume (K) Forecast, by Application 2019 & 2032
- Table 75: Global Dental Sterilization Trays Revenue million Forecast, by Application 2019 & 2032
- Table 76: Global Dental Sterilization Trays Volume K Forecast, by Application 2019 & 2032
- Table 77: Global Dental Sterilization Trays Revenue million Forecast, by Types 2019 & 2032
- Table 78: Global Dental Sterilization Trays Volume K Forecast, by Types 2019 & 2032
- Table 79: Global Dental Sterilization Trays Revenue million Forecast, by Country 2019 & 2032
- Table 80: Global Dental Sterilization Trays Volume K Forecast, by Country 2019 & 2032
- Table 81: China Dental Sterilization Trays Revenue (million) Forecast, by Application 2019 & 2032
- Table 82: China Dental Sterilization Trays Volume (K) Forecast, by Application 2019 & 2032
- Table 83: India Dental Sterilization Trays Revenue (million) Forecast, by Application 2019 & 2032
- Table 84: India Dental Sterilization Trays Volume (K) Forecast, by Application 2019 & 2032
- Table 85: Japan Dental Sterilization Trays Revenue (million) Forecast, by Application 2019 & 2032
- Table 86: Japan Dental Sterilization Trays Volume (K) Forecast, by Application 2019 & 2032
- Table 87: South Korea Dental Sterilization Trays Revenue (million) Forecast, by Application 2019 & 2032
- Table 88: South Korea Dental Sterilization Trays Volume (K) Forecast, by Application 2019 & 2032
- Table 89: ASEAN Dental Sterilization Trays Revenue (million) Forecast, by Application 2019 & 2032
- Table 90: ASEAN Dental Sterilization Trays Volume (K) Forecast, by Application 2019 & 2032
- Table 91: Oceania Dental Sterilization Trays Revenue (million) Forecast, by Application 2019 & 2032
- Table 92: Oceania Dental Sterilization Trays Volume (K) Forecast, by Application 2019 & 2032
- Table 93: Rest of Asia Pacific Dental Sterilization Trays Revenue (million) Forecast, by Application 2019 & 2032
- Table 94: Rest of Asia Pacific Dental Sterilization Trays Volume (K) Forecast, by Application 2019 & 2032
Frequently Asked Questions
1. What is the projected Compound Annual Growth Rate (CAGR) of the Dental Sterilization Trays?
The projected CAGR is approximately XX%.
2. Which companies are prominent players in the Dental Sterilization Trays?
Key companies in the market include Aseptico, Van Straten Medical, METASYS, KOHLER, YDM CORPORATION, DiaDent, AIP Médical, Zirc, A. Schweickhardt, Medesy, AR Instrumed Deutschland.
3. What are the main segments of the Dental Sterilization Trays?
The market segments include Application, Types.
4. Can you provide details about the market size?
The market size is estimated to be USD XXX million as of 2022.
5. What are some drivers contributing to market growth?
N/A
6. What are the notable trends driving market growth?
N/A
7. Are there any restraints impacting market growth?
N/A
8. Can you provide examples of recent developments in the market?
N/A
9. What pricing options are available for accessing the report?
Pricing options include single-user, multi-user, and enterprise licenses priced at USD 4350.00, USD 6525.00, and USD 8700.00 respectively.
10. Is the market size provided in terms of value or volume?
The market size is provided in terms of value, measured in million and volume, measured in K.
11. Are there any specific market keywords associated with the report?
Yes, the market keyword associated with the report is "Dental Sterilization Trays," which aids in identifying and referencing the specific market segment covered.
12. How do I determine which pricing option suits my needs best?
The pricing options vary based on user requirements and access needs. Individual users may opt for single-user licenses, while businesses requiring broader access may choose multi-user or enterprise licenses for cost-effective access to the report.
13. Are there any additional resources or data provided in the Dental Sterilization Trays report?
While the report offers comprehensive insights, it's advisable to review the specific contents or supplementary materials provided to ascertain if additional resources or data are available.
14. How can I stay updated on further developments or reports in the Dental Sterilization Trays?
To stay informed about further developments, trends, and reports in the Dental Sterilization Trays, consider subscribing to industry newsletters, following relevant companies and organizations, or regularly checking reputable industry news sources and publications.
Methodology
Step 1 - Identification of Relevant Samples Size from Population Database


Step 2 - Approaches for Defining Global Market Size (Value, Volume* & Price*)

Note*: In applicable scenarios
Step 3 - Data Sources
Primary Research
- Web Analytics
- Survey Reports
- Research Institute
- Latest Research Reports
- Opinion Leaders
Secondary Research
- Annual Reports
- White Paper
- Latest Press Release
- Industry Association
- Paid Database
- Investor Presentations

Step 4 - Data Triangulation
Involves using different sources of information in order to increase the validity of a study
These sources are likely to be stakeholders in a program - participants, other researchers, program staff, other community members, and so on.
Then we put all data in single framework & apply various statistical tools to find out the dynamic on the market.
During the analysis stage, feedback from the stakeholder groups would be compared to determine areas of agreement as well as areas of divergence


