

Key Insights
The Deep Brain Stimulation (DBS) Systems market is experiencing robust growth, projected to reach a significant size driven by increasing prevalence of neurological disorders like Parkinson's disease, essential tremor, and dystonia. The market's Compound Annual Growth Rate (CAGR) of 12.50% from 2019 to 2024 indicates strong and consistent expansion. This growth is fueled by advancements in DBS technology, leading to improved treatment outcomes and a wider range of applications. The availability of advanced single-channel and dual-channel DBS systems, coupled with minimally invasive surgical techniques, is contributing to increased adoption. Hospitals and ambulatory surgical centers represent the largest end-user segments, reflecting the specialized infrastructure required for implantation and subsequent patient management. Geographical distribution shows North America and Europe currently holding substantial market shares, however, Asia-Pacific is poised for significant growth due to rising healthcare spending and increased awareness of DBS therapy. Technological innovation focusing on closed-loop DBS systems and personalized treatment approaches will further propel market expansion in the coming years. Market restraints include high procedure costs, potential side effects, and limited accessibility in developing countries.
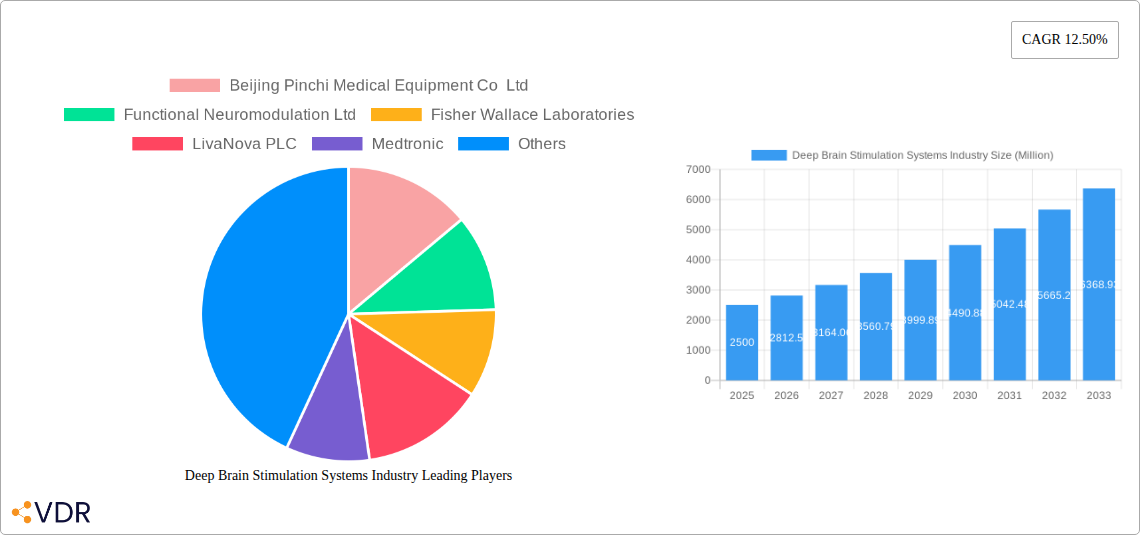
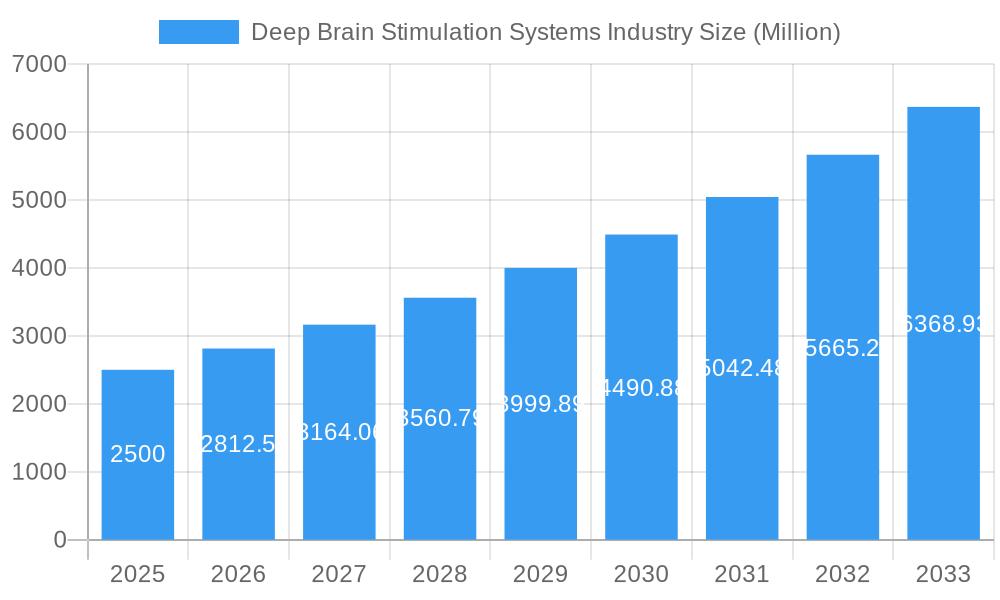
Deep Brain Stimulation Systems Industry Market Size (In Billion)
The competitive landscape is characterized by a mix of established players like Medtronic, Boston Scientific, and Abbott Laboratories, alongside emerging companies focused on innovation and niche applications. These companies are actively involved in research and development to improve DBS technology, aiming to enhance efficacy, reduce side effects, and expand the therapeutic indications. Future growth will likely be driven by a combination of factors including the development of new and improved devices, expansion into new markets, and ongoing advancements in surgical techniques. The increased focus on personalized medicine and targeted therapies will further contribute to the market's sustained expansion throughout the forecast period (2025-2033). A strategic focus on improving affordability and accessibility of DBS systems in underserved regions will be crucial for future market penetration and social impact.
Deep Brain Stimulation Systems Industry Company Market Share
Deep Brain Stimulation Systems Industry Market Report: 2019-2033
This comprehensive report provides a detailed analysis of the Deep Brain Stimulation (DBS) Systems market, encompassing market dynamics, growth trends, regional segmentation, product landscape, key players, and future outlook. The study period covers 2019-2033, with 2025 as the base and estimated year. The report utilizes a robust methodology, incorporating both qualitative and quantitative data to offer actionable insights for industry professionals, investors, and researchers. The parent market is the Neurostimulation Devices market and the child market is the Deep Brain Stimulation Systems market.
Deep Brain Stimulation Systems Industry Market Dynamics & Structure
The Deep Brain Stimulation (DBS) Systems market, valued at xx Million units in 2025, exhibits a moderately concentrated structure. Key players like Medtronic, Boston Scientific Corporation, and Abbott Laboratories hold significant market share, while smaller companies like Beijing Pinchi Medical Equipment Co Ltd and Aleva Neurotherapeutics S A contribute to a competitive landscape. Technological innovation, driven by advancements in closed-loop systems and improved electrode designs, is a major growth driver. Stringent regulatory frameworks and ethical considerations influence market entry and product approvals. The emergence of less invasive surgical techniques and advancements in personalized medicine present growth opportunities. Competitive substitutes include pharmaceuticals and other neuromodulation therapies, impacting market penetration. The end-user demographic primarily comprises patients with neurological disorders, predominantly aging populations in developed nations. M&A activity in the sector has been moderate, with a few significant deals in recent years; approximately xx deals were recorded between 2019 and 2024, representing a xx% increase compared to the previous five-year period.
- Market Concentration: Moderately concentrated, with top players holding xx% market share in 2025.
- Technological Innovation: Closed-loop DBS systems, improved electrode designs, and minimally invasive surgical techniques drive growth.
- Regulatory Framework: Stringent FDA and other international regulatory approvals impact market entry.
- Competitive Substitutes: Pharmaceuticals and other neuromodulation therapies pose competition.
- End-User Demographics: Aging population and increasing prevalence of neurological disorders fuel demand.
- M&A Trends: Moderate M&A activity, with xx deals recorded between 2019 and 2024.
Deep Brain Stimulation Systems Industry Growth Trends & Insights
The DBS Systems market has demonstrated consistent growth throughout the historical period (2019-2024). The market size is projected to reach xx Million units by 2033, exhibiting a CAGR of xx% during the forecast period (2025-2033). This growth is attributed to several factors, including the rising prevalence of neurological disorders like Parkinson's disease and essential tremor, technological advancements leading to improved treatment efficacy and safety, and increasing awareness among healthcare professionals and patients. Market penetration remains relatively low, with significant untapped potential in emerging markets. Technological disruptions such as the introduction of closed-loop DBS systems are accelerating market adoption. Consumer behavior is shifting towards personalized medicine approaches, demanding customized treatment plans and improved patient outcomes. Market size evolution demonstrates a consistent upward trend, with notable acceleration expected in the coming years due to increased investment in R&D and expanding treatment indications.
Dominant Regions, Countries, or Segments in Deep Brain Stimulation Systems Industry
North America currently dominates the DBS Systems market, driven by high healthcare expenditure, advanced healthcare infrastructure, and a significant elderly population. Within North America, the United States holds the largest market share. Europe follows as a key region, demonstrating robust growth due to increasing healthcare investment and rising prevalence of neurological disorders. Within segments, Hospitals and Ambulatory Surgical Centers are the leading end-users. Parkinson's Disease remains the dominant application, driving substantial market demand. The dual-channel deep brain stimulator segment holds a larger market share compared to the single-channel segment, reflecting a preference for advanced features and improved therapeutic outcomes.
- Key Drivers: High healthcare expenditure, advanced healthcare infrastructure, and large aging populations (North America and Europe).
- Dominant Segments: Hospitals (xx% market share), Parkinson's Disease (xx% market share), and Dual-channel DBS (xx% market share).
- Growth Potential: Emerging markets in Asia-Pacific and Latin America present significant growth opportunities.
Deep Brain Stimulation Systems Industry Product Landscape
The DBS Systems market offers a range of products, including single-channel and dual-channel stimulators, each with varying features and capabilities. Recent innovations focus on closed-loop systems that adjust stimulation parameters based on real-time patient data, improving efficacy and reducing side effects. Advancements in electrode design and lead technology enhance targeting accuracy and longevity. Unique selling propositions include improved patient outcomes, reduced surgical invasiveness, and personalized treatment capabilities.
Key Drivers, Barriers & Challenges in Deep Brain Stimulation Systems Industry
Key Drivers:
- Rising prevalence of neurological disorders.
- Technological advancements in DBS technology.
- Increased awareness among healthcare professionals and patients.
Challenges and Restraints:
- High cost of treatment and limited insurance coverage.
- Complex surgical procedures and potential side effects.
- Stringent regulatory pathways for new device approvals.
Emerging Opportunities in Deep Brain Stimulation Systems Industry
Untapped markets in developing countries and expansion into new therapeutic areas (e.g., treatment-resistant depression) represent significant opportunities. The development of novel closed-loop systems and personalized medicine approaches offers substantial growth potential. Minimally invasive surgical techniques and improved electrode designs will enhance market adoption.
Growth Accelerators in the Deep Brain Stimulation Systems Industry
Technological breakthroughs in closed-loop systems and personalized medicine approaches will significantly accelerate market growth. Strategic partnerships between device manufacturers and healthcare providers will enhance market penetration. Market expansion into emerging economies and new therapeutic areas will further fuel growth.
Key Players Shaping the Deep Brain Stimulation Systems Market
Notable Milestones in Deep Brain Stimulation Systems Industry Sector
- March 2023: Michigan Tech Researchers developed a 'Smart' Deep Brain Stimulation System, enhancing closed-loop capabilities.
- July 2022: Abbott received Health Canada licensing for its NeuroSphere Virtual Clinic, expanding access to DBS therapy.
In-Depth Deep Brain Stimulation Systems Industry Market Outlook
The DBS Systems market is poised for significant growth over the next decade, driven by technological advancements, expanding treatment indications, and increasing market penetration in emerging economies. Strategic partnerships, focused R&D, and the development of innovative closed-loop systems will be crucial for sustained market expansion. The focus on personalized medicine and minimally invasive surgical techniques will further strengthen market prospects.
Deep Brain Stimulation Systems Industry Segmentation
-
1. Product Type
- 1.1. Single-channel Deep Brain Stimulator
- 1.2. Dual-channel Deep Brain Stimulator
-
2. Application
- 2.1. Parkinson's Disease
- 2.2. Essential Tremor
- 2.3. Obsessive Compulsive Disorder
- 2.4. Epilepsy
- 2.5. Dystonia
- 2.6. Other Applications
-
3. End User
- 3.1. Hospitals
- 3.2. Ambulatory Surgical Centers
- 3.3. Other End Users
Deep Brain Stimulation Systems Industry Segmentation By Geography
-
1. North America
- 1.1. United States
- 1.2. Canada
- 1.3. Mexico
-
2. Europe
- 2.1. Germany
- 2.2. United Kingdom
- 2.3. France
- 2.4. Italy
- 2.5. Spain
- 2.6. Rest of Europe
-
3. Asia Pacific
- 3.1. China
- 3.2. Japan
- 3.3. India
- 3.4. Australia
- 3.5. South Korea
- 3.6. Rest of Asia Pacific
-
4. Middle East and Africa
- 4.1. GCC
- 4.2. South Africa
- 4.3. Rest of Middle East and Africa
-
5. South America
- 5.1. Brazil
- 5.2. Argentina
- 5.3. Rest of South America
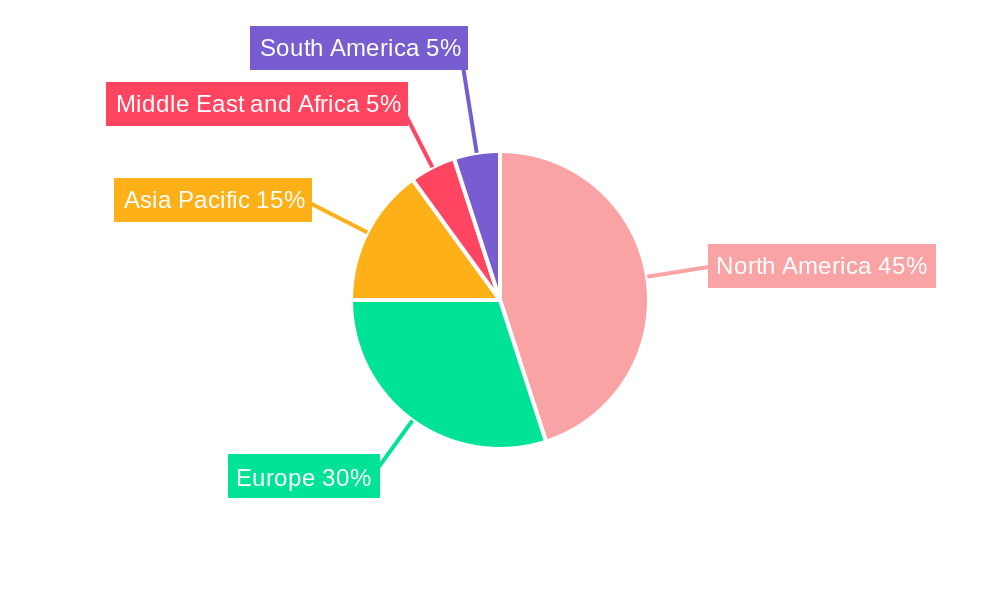
Deep Brain Stimulation Systems Industry Regional Market Share
Geographic Coverage of Deep Brain Stimulation Systems Industry
Deep Brain Stimulation Systems Industry REPORT HIGHLIGHTS
| Aspects | Details |
|---|---|
| Study Period | 2020-2034 |
| Base Year | 2025 |
| Estimated Year | 2026 |
| Forecast Period | 2026-2034 |
| Historical Period | 2020-2025 |
| Growth Rate | CAGR of 12.50% from 2020-2034 |
| Segmentation |
|
Table of Contents
- 1. Introduction
- 1.1. Research Scope
- 1.2. Market Segmentation
- 1.3. Research Objective
- 1.4. Definitions and Assumptions
- 2. Executive Summary
- 2.1. Market Snapshot
- 3. Market Dynamics
- 3.1. Market Drivers
- 3.2. Market Restrains
- 3.3. Market Trends
- 3.4. Market Opportunities
- 4. Market Factor Analysis
- 4.1. Porters Five Forces
- 4.1.1. Bargaining Power of Suppliers
- 4.1.2. Bargaining Power of Buyers
- 4.1.3. Threat of New Entrants
- 4.1.4. Threat of Substitutes
- 4.1.5. Competitive Rivalry
- 4.2. PESTEL analysis
- 4.3. BCG Analysis
- 4.3.1. Stars (High Growth, High Market Share)
- 4.3.2. Cash Cows (Low Growth, High Market Share)
- 4.3.3. Question Mark (High Growth, Low Market Share)
- 4.3.4. Dogs (Low Growth, Low Market Share)
- 4.4. Ansoff Matrix Analysis
- 4.5. Supply Chain Analysis
- 4.6. Regulatory Landscape
- 4.7. Current Market Potential and Opportunity Assessment (TAM–SAM–SOM Framework)
- 4.8. VDR Analyst Note
- 4.1. Porters Five Forces
- 5. Market Analysis, Insights and Forecast 2021-2033
- 5.1. Market Analysis, Insights and Forecast - by Product Type
- 5.1.1. Single-channel Deep Brain Stimulator
- 5.1.2. Dual-channel Deep Brain Stimulator
- 5.2. Market Analysis, Insights and Forecast - by Application
- 5.2.1. Parkinson's Disease
- 5.2.2. Essential Tremor
- 5.2.3. Obsessive Compulsive Disorder
- 5.2.4. Epilepsy
- 5.2.5. Dystonia
- 5.2.6. Other Applications
- 5.3. Market Analysis, Insights and Forecast - by End User
- 5.3.1. Hospitals
- 5.3.2. Ambulatory Surgical Centers
- 5.3.3. Other End Users
- 5.4. Market Analysis, Insights and Forecast - by Region
- 5.4.1. North America
- 5.4.2. Europe
- 5.4.3. Asia Pacific
- 5.4.4. Middle East and Africa
- 5.4.5. South America
- 5.1. Market Analysis, Insights and Forecast - by Product Type
- 6. Global Deep Brain Stimulation Systems Industry Analysis, Insights and Forecast, 2021-2033
- 6.1. Market Analysis, Insights and Forecast - by Product Type
- 6.1.1. Single-channel Deep Brain Stimulator
- 6.1.2. Dual-channel Deep Brain Stimulator
- 6.2. Market Analysis, Insights and Forecast - by Application
- 6.2.1. Parkinson's Disease
- 6.2.2. Essential Tremor
- 6.2.3. Obsessive Compulsive Disorder
- 6.2.4. Epilepsy
- 6.2.5. Dystonia
- 6.2.6. Other Applications
- 6.3. Market Analysis, Insights and Forecast - by End User
- 6.3.1. Hospitals
- 6.3.2. Ambulatory Surgical Centers
- 6.3.3. Other End Users
- 6.1. Market Analysis, Insights and Forecast - by Product Type
- 7. North America Deep Brain Stimulation Systems Industry Analysis, Insights and Forecast, 2021-2033
- 7.1. Market Analysis, Insights and Forecast - by Product Type
- 7.1.1. Single-channel Deep Brain Stimulator
- 7.1.2. Dual-channel Deep Brain Stimulator
- 7.2. Market Analysis, Insights and Forecast - by Application
- 7.2.1. Parkinson's Disease
- 7.2.2. Essential Tremor
- 7.2.3. Obsessive Compulsive Disorder
- 7.2.4. Epilepsy
- 7.2.5. Dystonia
- 7.2.6. Other Applications
- 7.3. Market Analysis, Insights and Forecast - by End User
- 7.3.1. Hospitals
- 7.3.2. Ambulatory Surgical Centers
- 7.3.3. Other End Users
- 7.1. Market Analysis, Insights and Forecast - by Product Type
- 8. Europe Deep Brain Stimulation Systems Industry Analysis, Insights and Forecast, 2021-2033
- 8.1. Market Analysis, Insights and Forecast - by Product Type
- 8.1.1. Single-channel Deep Brain Stimulator
- 8.1.2. Dual-channel Deep Brain Stimulator
- 8.2. Market Analysis, Insights and Forecast - by Application
- 8.2.1. Parkinson's Disease
- 8.2.2. Essential Tremor
- 8.2.3. Obsessive Compulsive Disorder
- 8.2.4. Epilepsy
- 8.2.5. Dystonia
- 8.2.6. Other Applications
- 8.3. Market Analysis, Insights and Forecast - by End User
- 8.3.1. Hospitals
- 8.3.2. Ambulatory Surgical Centers
- 8.3.3. Other End Users
- 8.1. Market Analysis, Insights and Forecast - by Product Type
- 9. Asia Pacific Deep Brain Stimulation Systems Industry Analysis, Insights and Forecast, 2021-2033
- 9.1. Market Analysis, Insights and Forecast - by Product Type
- 9.1.1. Single-channel Deep Brain Stimulator
- 9.1.2. Dual-channel Deep Brain Stimulator
- 9.2. Market Analysis, Insights and Forecast - by Application
- 9.2.1. Parkinson's Disease
- 9.2.2. Essential Tremor
- 9.2.3. Obsessive Compulsive Disorder
- 9.2.4. Epilepsy
- 9.2.5. Dystonia
- 9.2.6. Other Applications
- 9.3. Market Analysis, Insights and Forecast - by End User
- 9.3.1. Hospitals
- 9.3.2. Ambulatory Surgical Centers
- 9.3.3. Other End Users
- 9.1. Market Analysis, Insights and Forecast - by Product Type
- 10. Middle East and Africa Deep Brain Stimulation Systems Industry Analysis, Insights and Forecast, 2021-2033
- 10.1. Market Analysis, Insights and Forecast - by Product Type
- 10.1.1. Single-channel Deep Brain Stimulator
- 10.1.2. Dual-channel Deep Brain Stimulator
- 10.2. Market Analysis, Insights and Forecast - by Application
- 10.2.1. Parkinson's Disease
- 10.2.2. Essential Tremor
- 10.2.3. Obsessive Compulsive Disorder
- 10.2.4. Epilepsy
- 10.2.5. Dystonia
- 10.2.6. Other Applications
- 10.3. Market Analysis, Insights and Forecast - by End User
- 10.3.1. Hospitals
- 10.3.2. Ambulatory Surgical Centers
- 10.3.3. Other End Users
- 10.1. Market Analysis, Insights and Forecast - by Product Type
- 11. South America Deep Brain Stimulation Systems Industry Analysis, Insights and Forecast, 2021-2033
- 11.1. Market Analysis, Insights and Forecast - by Product Type
- 11.1.1. Single-channel Deep Brain Stimulator
- 11.1.2. Dual-channel Deep Brain Stimulator
- 11.2. Market Analysis, Insights and Forecast - by Application
- 11.2.1. Parkinson's Disease
- 11.2.2. Essential Tremor
- 11.2.3. Obsessive Compulsive Disorder
- 11.2.4. Epilepsy
- 11.2.5. Dystonia
- 11.2.6. Other Applications
- 11.3. Market Analysis, Insights and Forecast - by End User
- 11.3.1. Hospitals
- 11.3.2. Ambulatory Surgical Centers
- 11.3.3. Other End Users
- 11.1. Market Analysis, Insights and Forecast - by Product Type
- 12. Competitive Analysis
- 12.1. Company Profiles
- 12.1.1 Beijing Pinchi Medical Equipment Co Ltd
- 12.1.1.1. Company Overview
- 12.1.1.2. Products
- 12.1.1.3. Company Financials
- 12.1.1.4. SWOT Analysis
- 12.1.2 Functional Neuromodulation Ltd
- 12.1.2.1. Company Overview
- 12.1.2.2. Products
- 12.1.2.3. Company Financials
- 12.1.2.4. SWOT Analysis
- 12.1.3 Fisher Wallace Laboratories
- 12.1.3.1. Company Overview
- 12.1.3.2. Products
- 12.1.3.3. Company Financials
- 12.1.3.4. SWOT Analysis
- 12.1.4 LivaNova PLC
- 12.1.4.1. Company Overview
- 12.1.4.2. Products
- 12.1.4.3. Company Financials
- 12.1.4.4. SWOT Analysis
- 12.1.5 Medtronic
- 12.1.5.1. Company Overview
- 12.1.5.2. Products
- 12.1.5.3. Company Financials
- 12.1.5.4. SWOT Analysis
- 12.1.6 Renishaw PLC
- 12.1.6.1. Company Overview
- 12.1.6.2. Products
- 12.1.6.3. Company Financials
- 12.1.6.4. SWOT Analysis
- 12.1.7 NeuroPace Inc
- 12.1.7.1. Company Overview
- 12.1.7.2. Products
- 12.1.7.3. Company Financials
- 12.1.7.4. SWOT Analysis
- 12.1.8 Abbott Laboratories
- 12.1.8.1. Company Overview
- 12.1.8.2. Products
- 12.1.8.3. Company Financials
- 12.1.8.4. SWOT Analysis
- 12.1.9 Boston Scientific Corporation
- 12.1.9.1. Company Overview
- 12.1.9.2. Products
- 12.1.9.3. Company Financials
- 12.1.9.4. SWOT Analysis
- 12.1.10 Aleva Neurotherapeutics S A
- 12.1.10.1. Company Overview
- 12.1.10.2. Products
- 12.1.10.3. Company Financials
- 12.1.10.4. SWOT Analysis
- 12.1.1 Beijing Pinchi Medical Equipment Co Ltd
- 12.2. Market Entropy
- 12.2.1 Company's Key Areas Served
- 12.2.2 Recent Developments
- 12.3. Company Market Share Analysis 2025
- 12.3.1 Top 5 Companies Market Share Analysis
- 12.3.2 Top 3 Companies Market Share Analysis
- 12.4. List of Potential Customers
- 13. Research Methodology
List of Figures
- Figure 1: Global Deep Brain Stimulation Systems Industry Revenue Breakdown (Million, %) by Region 2025 & 2033
- Figure 2: Global Deep Brain Stimulation Systems Industry Volume Breakdown (K Unit, %) by Region 2025 & 2033
- Figure 3: North America Deep Brain Stimulation Systems Industry Revenue (Million), by Product Type 2025 & 2033
- Figure 4: North America Deep Brain Stimulation Systems Industry Volume (K Unit), by Product Type 2025 & 2033
- Figure 5: North America Deep Brain Stimulation Systems Industry Revenue Share (%), by Product Type 2025 & 2033
- Figure 6: North America Deep Brain Stimulation Systems Industry Volume Share (%), by Product Type 2025 & 2033
- Figure 7: North America Deep Brain Stimulation Systems Industry Revenue (Million), by Application 2025 & 2033
- Figure 8: North America Deep Brain Stimulation Systems Industry Volume (K Unit), by Application 2025 & 2033
- Figure 9: North America Deep Brain Stimulation Systems Industry Revenue Share (%), by Application 2025 & 2033
- Figure 10: North America Deep Brain Stimulation Systems Industry Volume Share (%), by Application 2025 & 2033
- Figure 11: North America Deep Brain Stimulation Systems Industry Revenue (Million), by End User 2025 & 2033
- Figure 12: North America Deep Brain Stimulation Systems Industry Volume (K Unit), by End User 2025 & 2033
- Figure 13: North America Deep Brain Stimulation Systems Industry Revenue Share (%), by End User 2025 & 2033
- Figure 14: North America Deep Brain Stimulation Systems Industry Volume Share (%), by End User 2025 & 2033
- Figure 15: North America Deep Brain Stimulation Systems Industry Revenue (Million), by Country 2025 & 2033
- Figure 16: North America Deep Brain Stimulation Systems Industry Volume (K Unit), by Country 2025 & 2033
- Figure 17: North America Deep Brain Stimulation Systems Industry Revenue Share (%), by Country 2025 & 2033
- Figure 18: North America Deep Brain Stimulation Systems Industry Volume Share (%), by Country 2025 & 2033
- Figure 19: Europe Deep Brain Stimulation Systems Industry Revenue (Million), by Product Type 2025 & 2033
- Figure 20: Europe Deep Brain Stimulation Systems Industry Volume (K Unit), by Product Type 2025 & 2033
- Figure 21: Europe Deep Brain Stimulation Systems Industry Revenue Share (%), by Product Type 2025 & 2033
- Figure 22: Europe Deep Brain Stimulation Systems Industry Volume Share (%), by Product Type 2025 & 2033
- Figure 23: Europe Deep Brain Stimulation Systems Industry Revenue (Million), by Application 2025 & 2033
- Figure 24: Europe Deep Brain Stimulation Systems Industry Volume (K Unit), by Application 2025 & 2033
- Figure 25: Europe Deep Brain Stimulation Systems Industry Revenue Share (%), by Application 2025 & 2033
- Figure 26: Europe Deep Brain Stimulation Systems Industry Volume Share (%), by Application 2025 & 2033
- Figure 27: Europe Deep Brain Stimulation Systems Industry Revenue (Million), by End User 2025 & 2033
- Figure 28: Europe Deep Brain Stimulation Systems Industry Volume (K Unit), by End User 2025 & 2033
- Figure 29: Europe Deep Brain Stimulation Systems Industry Revenue Share (%), by End User 2025 & 2033
- Figure 30: Europe Deep Brain Stimulation Systems Industry Volume Share (%), by End User 2025 & 2033
- Figure 31: Europe Deep Brain Stimulation Systems Industry Revenue (Million), by Country 2025 & 2033
- Figure 32: Europe Deep Brain Stimulation Systems Industry Volume (K Unit), by Country 2025 & 2033
- Figure 33: Europe Deep Brain Stimulation Systems Industry Revenue Share (%), by Country 2025 & 2033
- Figure 34: Europe Deep Brain Stimulation Systems Industry Volume Share (%), by Country 2025 & 2033
- Figure 35: Asia Pacific Deep Brain Stimulation Systems Industry Revenue (Million), by Product Type 2025 & 2033
- Figure 36: Asia Pacific Deep Brain Stimulation Systems Industry Volume (K Unit), by Product Type 2025 & 2033
- Figure 37: Asia Pacific Deep Brain Stimulation Systems Industry Revenue Share (%), by Product Type 2025 & 2033
- Figure 38: Asia Pacific Deep Brain Stimulation Systems Industry Volume Share (%), by Product Type 2025 & 2033
- Figure 39: Asia Pacific Deep Brain Stimulation Systems Industry Revenue (Million), by Application 2025 & 2033
- Figure 40: Asia Pacific Deep Brain Stimulation Systems Industry Volume (K Unit), by Application 2025 & 2033
- Figure 41: Asia Pacific Deep Brain Stimulation Systems Industry Revenue Share (%), by Application 2025 & 2033
- Figure 42: Asia Pacific Deep Brain Stimulation Systems Industry Volume Share (%), by Application 2025 & 2033
- Figure 43: Asia Pacific Deep Brain Stimulation Systems Industry Revenue (Million), by End User 2025 & 2033
- Figure 44: Asia Pacific Deep Brain Stimulation Systems Industry Volume (K Unit), by End User 2025 & 2033
- Figure 45: Asia Pacific Deep Brain Stimulation Systems Industry Revenue Share (%), by End User 2025 & 2033
- Figure 46: Asia Pacific Deep Brain Stimulation Systems Industry Volume Share (%), by End User 2025 & 2033
- Figure 47: Asia Pacific Deep Brain Stimulation Systems Industry Revenue (Million), by Country 2025 & 2033
- Figure 48: Asia Pacific Deep Brain Stimulation Systems Industry Volume (K Unit), by Country 2025 & 2033
- Figure 49: Asia Pacific Deep Brain Stimulation Systems Industry Revenue Share (%), by Country 2025 & 2033
- Figure 50: Asia Pacific Deep Brain Stimulation Systems Industry Volume Share (%), by Country 2025 & 2033
- Figure 51: Middle East and Africa Deep Brain Stimulation Systems Industry Revenue (Million), by Product Type 2025 & 2033
- Figure 52: Middle East and Africa Deep Brain Stimulation Systems Industry Volume (K Unit), by Product Type 2025 & 2033
- Figure 53: Middle East and Africa Deep Brain Stimulation Systems Industry Revenue Share (%), by Product Type 2025 & 2033
- Figure 54: Middle East and Africa Deep Brain Stimulation Systems Industry Volume Share (%), by Product Type 2025 & 2033
- Figure 55: Middle East and Africa Deep Brain Stimulation Systems Industry Revenue (Million), by Application 2025 & 2033
- Figure 56: Middle East and Africa Deep Brain Stimulation Systems Industry Volume (K Unit), by Application 2025 & 2033
- Figure 57: Middle East and Africa Deep Brain Stimulation Systems Industry Revenue Share (%), by Application 2025 & 2033
- Figure 58: Middle East and Africa Deep Brain Stimulation Systems Industry Volume Share (%), by Application 2025 & 2033
- Figure 59: Middle East and Africa Deep Brain Stimulation Systems Industry Revenue (Million), by End User 2025 & 2033
- Figure 60: Middle East and Africa Deep Brain Stimulation Systems Industry Volume (K Unit), by End User 2025 & 2033
- Figure 61: Middle East and Africa Deep Brain Stimulation Systems Industry Revenue Share (%), by End User 2025 & 2033
- Figure 62: Middle East and Africa Deep Brain Stimulation Systems Industry Volume Share (%), by End User 2025 & 2033
- Figure 63: Middle East and Africa Deep Brain Stimulation Systems Industry Revenue (Million), by Country 2025 & 2033
- Figure 64: Middle East and Africa Deep Brain Stimulation Systems Industry Volume (K Unit), by Country 2025 & 2033
- Figure 65: Middle East and Africa Deep Brain Stimulation Systems Industry Revenue Share (%), by Country 2025 & 2033
- Figure 66: Middle East and Africa Deep Brain Stimulation Systems Industry Volume Share (%), by Country 2025 & 2033
- Figure 67: South America Deep Brain Stimulation Systems Industry Revenue (Million), by Product Type 2025 & 2033
- Figure 68: South America Deep Brain Stimulation Systems Industry Volume (K Unit), by Product Type 2025 & 2033
- Figure 69: South America Deep Brain Stimulation Systems Industry Revenue Share (%), by Product Type 2025 & 2033
- Figure 70: South America Deep Brain Stimulation Systems Industry Volume Share (%), by Product Type 2025 & 2033
- Figure 71: South America Deep Brain Stimulation Systems Industry Revenue (Million), by Application 2025 & 2033
- Figure 72: South America Deep Brain Stimulation Systems Industry Volume (K Unit), by Application 2025 & 2033
- Figure 73: South America Deep Brain Stimulation Systems Industry Revenue Share (%), by Application 2025 & 2033
- Figure 74: South America Deep Brain Stimulation Systems Industry Volume Share (%), by Application 2025 & 2033
- Figure 75: South America Deep Brain Stimulation Systems Industry Revenue (Million), by End User 2025 & 2033
- Figure 76: South America Deep Brain Stimulation Systems Industry Volume (K Unit), by End User 2025 & 2033
- Figure 77: South America Deep Brain Stimulation Systems Industry Revenue Share (%), by End User 2025 & 2033
- Figure 78: South America Deep Brain Stimulation Systems Industry Volume Share (%), by End User 2025 & 2033
- Figure 79: South America Deep Brain Stimulation Systems Industry Revenue (Million), by Country 2025 & 2033
- Figure 80: South America Deep Brain Stimulation Systems Industry Volume (K Unit), by Country 2025 & 2033
- Figure 81: South America Deep Brain Stimulation Systems Industry Revenue Share (%), by Country 2025 & 2033
- Figure 82: South America Deep Brain Stimulation Systems Industry Volume Share (%), by Country 2025 & 2033
List of Tables
- Table 1: Global Deep Brain Stimulation Systems Industry Revenue Million Forecast, by Product Type 2020 & 2033
- Table 2: Global Deep Brain Stimulation Systems Industry Volume K Unit Forecast, by Product Type 2020 & 2033
- Table 3: Global Deep Brain Stimulation Systems Industry Revenue Million Forecast, by Application 2020 & 2033
- Table 4: Global Deep Brain Stimulation Systems Industry Volume K Unit Forecast, by Application 2020 & 2033
- Table 5: Global Deep Brain Stimulation Systems Industry Revenue Million Forecast, by End User 2020 & 2033
- Table 6: Global Deep Brain Stimulation Systems Industry Volume K Unit Forecast, by End User 2020 & 2033
- Table 7: Global Deep Brain Stimulation Systems Industry Revenue Million Forecast, by Region 2020 & 2033
- Table 8: Global Deep Brain Stimulation Systems Industry Volume K Unit Forecast, by Region 2020 & 2033
- Table 9: Global Deep Brain Stimulation Systems Industry Revenue Million Forecast, by Product Type 2020 & 2033
- Table 10: Global Deep Brain Stimulation Systems Industry Volume K Unit Forecast, by Product Type 2020 & 2033
- Table 11: Global Deep Brain Stimulation Systems Industry Revenue Million Forecast, by Application 2020 & 2033
- Table 12: Global Deep Brain Stimulation Systems Industry Volume K Unit Forecast, by Application 2020 & 2033
- Table 13: Global Deep Brain Stimulation Systems Industry Revenue Million Forecast, by End User 2020 & 2033
- Table 14: Global Deep Brain Stimulation Systems Industry Volume K Unit Forecast, by End User 2020 & 2033
- Table 15: Global Deep Brain Stimulation Systems Industry Revenue Million Forecast, by Country 2020 & 2033
- Table 16: Global Deep Brain Stimulation Systems Industry Volume K Unit Forecast, by Country 2020 & 2033
- Table 17: United States Deep Brain Stimulation Systems Industry Revenue (Million) Forecast, by Application 2020 & 2033
- Table 18: United States Deep Brain Stimulation Systems Industry Volume (K Unit) Forecast, by Application 2020 & 2033
- Table 19: Canada Deep Brain Stimulation Systems Industry Revenue (Million) Forecast, by Application 2020 & 2033
- Table 20: Canada Deep Brain Stimulation Systems Industry Volume (K Unit) Forecast, by Application 2020 & 2033
- Table 21: Mexico Deep Brain Stimulation Systems Industry Revenue (Million) Forecast, by Application 2020 & 2033
- Table 22: Mexico Deep Brain Stimulation Systems Industry Volume (K Unit) Forecast, by Application 2020 & 2033
- Table 23: Global Deep Brain Stimulation Systems Industry Revenue Million Forecast, by Product Type 2020 & 2033
- Table 24: Global Deep Brain Stimulation Systems Industry Volume K Unit Forecast, by Product Type 2020 & 2033
- Table 25: Global Deep Brain Stimulation Systems Industry Revenue Million Forecast, by Application 2020 & 2033
- Table 26: Global Deep Brain Stimulation Systems Industry Volume K Unit Forecast, by Application 2020 & 2033
- Table 27: Global Deep Brain Stimulation Systems Industry Revenue Million Forecast, by End User 2020 & 2033
- Table 28: Global Deep Brain Stimulation Systems Industry Volume K Unit Forecast, by End User 2020 & 2033
- Table 29: Global Deep Brain Stimulation Systems Industry Revenue Million Forecast, by Country 2020 & 2033
- Table 30: Global Deep Brain Stimulation Systems Industry Volume K Unit Forecast, by Country 2020 & 2033
- Table 31: Germany Deep Brain Stimulation Systems Industry Revenue (Million) Forecast, by Application 2020 & 2033
- Table 32: Germany Deep Brain Stimulation Systems Industry Volume (K Unit) Forecast, by Application 2020 & 2033
- Table 33: United Kingdom Deep Brain Stimulation Systems Industry Revenue (Million) Forecast, by Application 2020 & 2033
- Table 34: United Kingdom Deep Brain Stimulation Systems Industry Volume (K Unit) Forecast, by Application 2020 & 2033
- Table 35: France Deep Brain Stimulation Systems Industry Revenue (Million) Forecast, by Application 2020 & 2033
- Table 36: France Deep Brain Stimulation Systems Industry Volume (K Unit) Forecast, by Application 2020 & 2033
- Table 37: Italy Deep Brain Stimulation Systems Industry Revenue (Million) Forecast, by Application 2020 & 2033
- Table 38: Italy Deep Brain Stimulation Systems Industry Volume (K Unit) Forecast, by Application 2020 & 2033
- Table 39: Spain Deep Brain Stimulation Systems Industry Revenue (Million) Forecast, by Application 2020 & 2033
- Table 40: Spain Deep Brain Stimulation Systems Industry Volume (K Unit) Forecast, by Application 2020 & 2033
- Table 41: Rest of Europe Deep Brain Stimulation Systems Industry Revenue (Million) Forecast, by Application 2020 & 2033
- Table 42: Rest of Europe Deep Brain Stimulation Systems Industry Volume (K Unit) Forecast, by Application 2020 & 2033
- Table 43: Global Deep Brain Stimulation Systems Industry Revenue Million Forecast, by Product Type 2020 & 2033
- Table 44: Global Deep Brain Stimulation Systems Industry Volume K Unit Forecast, by Product Type 2020 & 2033
- Table 45: Global Deep Brain Stimulation Systems Industry Revenue Million Forecast, by Application 2020 & 2033
- Table 46: Global Deep Brain Stimulation Systems Industry Volume K Unit Forecast, by Application 2020 & 2033
- Table 47: Global Deep Brain Stimulation Systems Industry Revenue Million Forecast, by End User 2020 & 2033
- Table 48: Global Deep Brain Stimulation Systems Industry Volume K Unit Forecast, by End User 2020 & 2033
- Table 49: Global Deep Brain Stimulation Systems Industry Revenue Million Forecast, by Country 2020 & 2033
- Table 50: Global Deep Brain Stimulation Systems Industry Volume K Unit Forecast, by Country 2020 & 2033
- Table 51: China Deep Brain Stimulation Systems Industry Revenue (Million) Forecast, by Application 2020 & 2033
- Table 52: China Deep Brain Stimulation Systems Industry Volume (K Unit) Forecast, by Application 2020 & 2033
- Table 53: Japan Deep Brain Stimulation Systems Industry Revenue (Million) Forecast, by Application 2020 & 2033
- Table 54: Japan Deep Brain Stimulation Systems Industry Volume (K Unit) Forecast, by Application 2020 & 2033
- Table 55: India Deep Brain Stimulation Systems Industry Revenue (Million) Forecast, by Application 2020 & 2033
- Table 56: India Deep Brain Stimulation Systems Industry Volume (K Unit) Forecast, by Application 2020 & 2033
- Table 57: Australia Deep Brain Stimulation Systems Industry Revenue (Million) Forecast, by Application 2020 & 2033
- Table 58: Australia Deep Brain Stimulation Systems Industry Volume (K Unit) Forecast, by Application 2020 & 2033
- Table 59: South Korea Deep Brain Stimulation Systems Industry Revenue (Million) Forecast, by Application 2020 & 2033
- Table 60: South Korea Deep Brain Stimulation Systems Industry Volume (K Unit) Forecast, by Application 2020 & 2033
- Table 61: Rest of Asia Pacific Deep Brain Stimulation Systems Industry Revenue (Million) Forecast, by Application 2020 & 2033
- Table 62: Rest of Asia Pacific Deep Brain Stimulation Systems Industry Volume (K Unit) Forecast, by Application 2020 & 2033
- Table 63: Global Deep Brain Stimulation Systems Industry Revenue Million Forecast, by Product Type 2020 & 2033
- Table 64: Global Deep Brain Stimulation Systems Industry Volume K Unit Forecast, by Product Type 2020 & 2033
- Table 65: Global Deep Brain Stimulation Systems Industry Revenue Million Forecast, by Application 2020 & 2033
- Table 66: Global Deep Brain Stimulation Systems Industry Volume K Unit Forecast, by Application 2020 & 2033
- Table 67: Global Deep Brain Stimulation Systems Industry Revenue Million Forecast, by End User 2020 & 2033
- Table 68: Global Deep Brain Stimulation Systems Industry Volume K Unit Forecast, by End User 2020 & 2033
- Table 69: Global Deep Brain Stimulation Systems Industry Revenue Million Forecast, by Country 2020 & 2033
- Table 70: Global Deep Brain Stimulation Systems Industry Volume K Unit Forecast, by Country 2020 & 2033
- Table 71: GCC Deep Brain Stimulation Systems Industry Revenue (Million) Forecast, by Application 2020 & 2033
- Table 72: GCC Deep Brain Stimulation Systems Industry Volume (K Unit) Forecast, by Application 2020 & 2033
- Table 73: South Africa Deep Brain Stimulation Systems Industry Revenue (Million) Forecast, by Application 2020 & 2033
- Table 74: South Africa Deep Brain Stimulation Systems Industry Volume (K Unit) Forecast, by Application 2020 & 2033
- Table 75: Rest of Middle East and Africa Deep Brain Stimulation Systems Industry Revenue (Million) Forecast, by Application 2020 & 2033
- Table 76: Rest of Middle East and Africa Deep Brain Stimulation Systems Industry Volume (K Unit) Forecast, by Application 2020 & 2033
- Table 77: Global Deep Brain Stimulation Systems Industry Revenue Million Forecast, by Product Type 2020 & 2033
- Table 78: Global Deep Brain Stimulation Systems Industry Volume K Unit Forecast, by Product Type 2020 & 2033
- Table 79: Global Deep Brain Stimulation Systems Industry Revenue Million Forecast, by Application 2020 & 2033
- Table 80: Global Deep Brain Stimulation Systems Industry Volume K Unit Forecast, by Application 2020 & 2033
- Table 81: Global Deep Brain Stimulation Systems Industry Revenue Million Forecast, by End User 2020 & 2033
- Table 82: Global Deep Brain Stimulation Systems Industry Volume K Unit Forecast, by End User 2020 & 2033
- Table 83: Global Deep Brain Stimulation Systems Industry Revenue Million Forecast, by Country 2020 & 2033
- Table 84: Global Deep Brain Stimulation Systems Industry Volume K Unit Forecast, by Country 2020 & 2033
- Table 85: Brazil Deep Brain Stimulation Systems Industry Revenue (Million) Forecast, by Application 2020 & 2033
- Table 86: Brazil Deep Brain Stimulation Systems Industry Volume (K Unit) Forecast, by Application 2020 & 2033
- Table 87: Argentina Deep Brain Stimulation Systems Industry Revenue (Million) Forecast, by Application 2020 & 2033
- Table 88: Argentina Deep Brain Stimulation Systems Industry Volume (K Unit) Forecast, by Application 2020 & 2033
- Table 89: Rest of South America Deep Brain Stimulation Systems Industry Revenue (Million) Forecast, by Application 2020 & 2033
- Table 90: Rest of South America Deep Brain Stimulation Systems Industry Volume (K Unit) Forecast, by Application 2020 & 2033
Frequently Asked Questions
1. What is the projected Compound Annual Growth Rate (CAGR) of the Deep Brain Stimulation Systems Industry?
The projected CAGR is approximately 12.50%.
2. Which companies are prominent players in the Deep Brain Stimulation Systems Industry?
Key companies in the market include Beijing Pinchi Medical Equipment Co Ltd, Functional Neuromodulation Ltd, Fisher Wallace Laboratories, LivaNova PLC, Medtronic, Renishaw PLC, NeuroPace Inc, Abbott Laboratories, Boston Scientific Corporation, Aleva Neurotherapeutics S A.
3. What are the main segments of the Deep Brain Stimulation Systems Industry?
The market segments include Product Type, Application, End User.
4. Can you provide details about the market size?
The market size is estimated to be USD XX Million as of 2022.
5. What are some drivers contributing to market growth?
Rapidly Aging Population. Leading to Risk and High Prevalence of Neurological Disorders; Growing Demand for the Devices. Due to Rising Popularity of Minimally Invasive Procedures; Availability of Technologically Advanced Deep Brain Stimulation Devices.
6. What are the notable trends driving market growth?
Parkinson's disease segment is expected to hold a significant market share during the forecast period.
7. Are there any restraints impacting market growth?
Risks Associated with Deep Brain Stimulation Procedures; Implementation of Government Policies Negatively Affecting the Market.
8. Can you provide examples of recent developments in the market?
March 2023: Michigan Tech Researchers developed a 'Smart' Deep Brain Stimulation System, focused on a closed-loop DBS system that can adjust stimulus signals according to Parkinson's patient symptoms.
9. What pricing options are available for accessing the report?
Pricing options include single-user, multi-user, and enterprise licenses priced at USD 4750, USD 5250, and USD 8750 respectively.
10. Is the market size provided in terms of value or volume?
The market size is provided in terms of value, measured in Million and volume, measured in K Unit.
11. Are there any specific market keywords associated with the report?
Yes, the market keyword associated with the report is "Deep Brain Stimulation Systems Industry," which aids in identifying and referencing the specific market segment covered.
12. How do I determine which pricing option suits my needs best?
The pricing options vary based on user requirements and access needs. Individual users may opt for single-user licenses, while businesses requiring broader access may choose multi-user or enterprise licenses for cost-effective access to the report.
13. Are there any additional resources or data provided in the Deep Brain Stimulation Systems Industry report?
While the report offers comprehensive insights, it's advisable to review the specific contents or supplementary materials provided to ascertain if additional resources or data are available.
14. How can I stay updated on further developments or reports in the Deep Brain Stimulation Systems Industry?
To stay informed about further developments, trends, and reports in the Deep Brain Stimulation Systems Industry, consider subscribing to industry newsletters, following relevant companies and organizations, or regularly checking reputable industry news sources and publications.
Methodology
Step 1 - Identification of Relevant Samples Size from Population Database


Step 2 - Approaches for Defining Global Market Size (Value, Volume* & Price*)

Note*: In applicable scenarios
Step 3 - Data Sources
Primary Research
- Web Analytics
- Survey Reports
- Research Institute
- Latest Research Reports
- Opinion Leaders
Secondary Research
- Annual Reports
- White Paper
- Latest Press Release
- Industry Association
- Paid Database
- Investor Presentations

Step 4 - Data Triangulation
Involves using different sources of information in order to increase the validity of a study
These sources are likely to be stakeholders in a program - participants, other researchers, program staff, other community members, and so on.
Then we put all data in single framework & apply various statistical tools to find out the dynamic on the market.
During the analysis stage, feedback from the stakeholder groups would be compared to determine areas of agreement as well as areas of divergence