

Key Insights
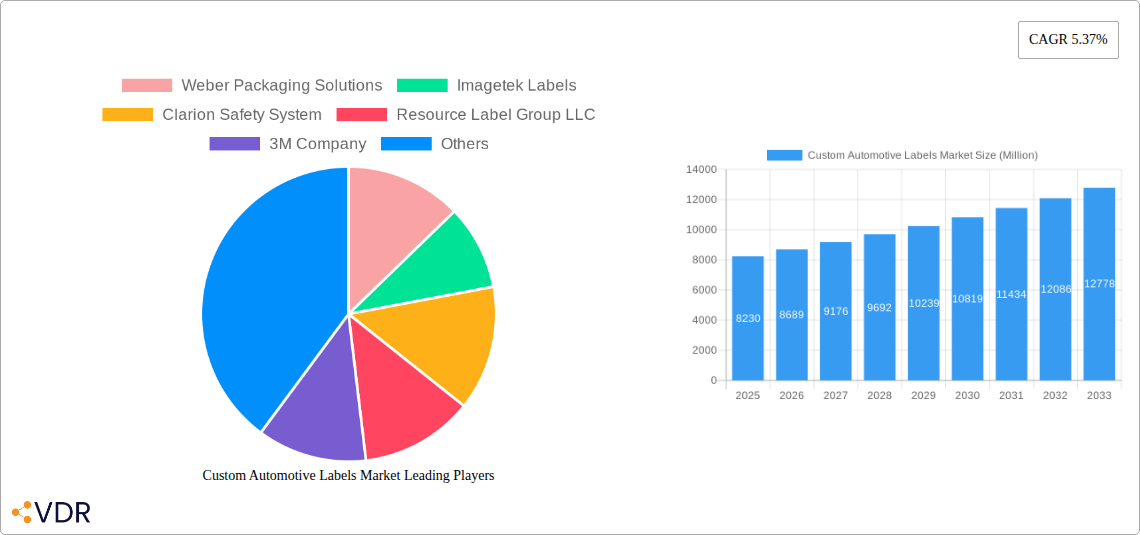
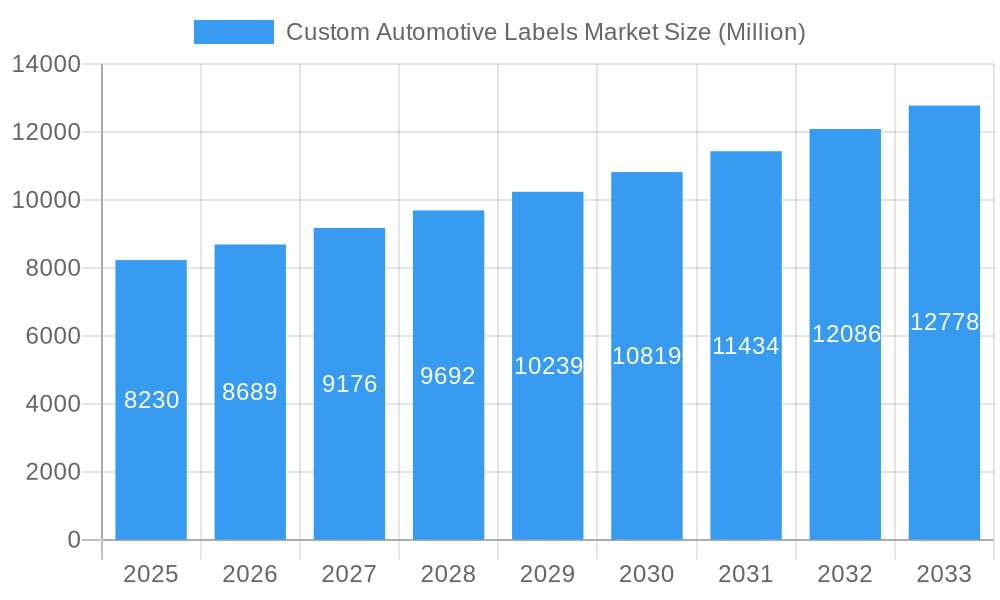
The global custom automotive labels market, valued at $8.23 billion in 2025, is projected to experience robust growth, driven by increasing vehicle production and a rising demand for advanced labeling solutions. The market's Compound Annual Growth Rate (CAGR) of 5.37% from 2019 to 2024 suggests a continued upward trajectory through 2033. Key growth drivers include the escalating adoption of sophisticated identification technologies like QR codes and RFID tags for improved vehicle tracking, enhanced safety features, and streamlined supply chain management. Furthermore, the increasing demand for customized branding and informative labels reflects the automotive industry's focus on enhancing customer experience and brand loyalty. The segment encompassing warning and safety labels is expected to demonstrate significant growth due to stringent regulations regarding vehicle safety and consumer protection. Growth is also fueled by the burgeoning popularity of electric and autonomous vehicles, each requiring specialized labels. While potential restraints such as fluctuating raw material prices and economic downturns exist, the overall market outlook remains positive, particularly in regions like North America and Asia, which are anticipated to dominate market share due to strong automotive manufacturing hubs. The diverse applications, including interior, exterior, and engine labeling, cater to a wide array of automotive needs, contributing to the market's resilience and expansion.
Custom Automotive Labels Market Market Size (In Billion)
The market segmentation reveals a diverse landscape. By type, branding labels dominate, followed by track & trace and warning & safety labels. The application segment sees a strong emphasis on exterior applications given their visibility and branding potential, while engine applications reflect the need for durable and information-rich labels in harsh environments. In terms of identification technology, barcode and QR code labels currently hold a substantial market share, however, the adoption of RFID technology is expected to grow steadily due to its ability to provide real-time tracking and data management capabilities. Major players like 3M, Avery Dennison, and Weber Packaging Solutions are driving innovation and competition within the market, further stimulating growth. The forecast period (2025-2033) anticipates a continuation of these trends, with specific growth rates influenced by regional economic performance and technological advancements in labeling materials and identification technologies. The market is characterized by ongoing innovation and adaptation, promising strong growth opportunities in the coming years.
Custom Automotive Labels Market Company Market Share
Custom Automotive Labels Market: A Comprehensive Report (2019-2033)
This in-depth report provides a comprehensive analysis of the Custom Automotive Labels Market, encompassing market dynamics, growth trends, regional dominance, product landscape, key players, and future outlook. The report covers the period from 2019 to 2033, with 2025 as the base year and a forecast period extending to 2033. The parent market is the broader automotive labeling industry, while the child market focuses specifically on customized automotive labels. The market size is projected to reach xx Million units by 2033.
Custom Automotive Labels Market Market Dynamics & Structure
The Custom Automotive Labels Market is characterized by moderate concentration, with several key players holding significant market share, while numerous smaller niche players also operate. Technological innovation, particularly in RFID and smart label technologies, is a major driver. Regulatory frameworks concerning product safety and environmental compliance influence label materials and production processes. Competitive substitutes include traditional printed labels and less sophisticated tracking systems. End-user demographics show a rising demand from automotive OEMs and Tier-1 suppliers, focused on enhancing traceability and product security. M&A activity in the sector has been moderate, with strategic acquisitions aimed at expanding product portfolios and geographic reach.
- Market Concentration: Moderately concentrated, with top 5 players holding approximately 60% market share (estimated).
- Technological Innovation: Strong driver, with advancements in RFID, QR codes, and smart label materials improving track & trace capabilities and enhancing durability.
- Regulatory Frameworks: Compliance with safety and environmental standards (e.g., REACH, RoHS) influencing material selection and manufacturing processes.
- Competitive Substitutes: Traditional printed labels and less advanced tracking systems pose competitive challenges.
- M&A Trends: Moderate activity, driven by strategic acquisitions to expand product lines and market reach. xx M&A deals recorded between 2019-2024 (estimated).
- Innovation Barriers: High initial investment costs for new technologies and integration challenges with existing automotive production systems.
Custom Automotive Labels Market Growth Trends & Insights
The Custom Automotive Labels Market has witnessed steady growth from 2019 to 2024, driven by increasing automotive production, rising demand for enhanced vehicle traceability, and the growing adoption of advanced identification technologies. The market is expected to exhibit a CAGR of xx% during the forecast period (2025-2033), fueled by technological advancements and the rising demand for customized solutions across varied automotive segments. The increasing adoption of RFID tags for improved inventory management and supply chain visibility is a key growth catalyst. Consumer preference for personalized features and brand identification also contributes to the growth in branded labels. Technological disruptions, such as the integration of IoT capabilities into automotive labels, are poised to further accelerate market growth. Market penetration for RFID technology in automotive labels is estimated at xx% in 2025, projected to reach xx% by 2033.
Dominant Regions, Countries, or Segments in Custom Automotive Labels Market
The North American region currently holds the largest market share due to strong automotive manufacturing presence, high demand for advanced tracking systems, and favorable regulatory environment. Within segments, the Track & Trace segment is the fastest growing, fueled by the need for enhanced supply chain transparency and anti-counterfeiting measures. The automotive interiors segment is a major application driver, followed by exterior and engine applications. The adoption of RFID technology is driving significant growth within the identification technologies segment.
- Leading Region: North America
- Fastest Growing Segment (By Type): Track & Trace
- Major Application Segment: Interior Applications
- Fastest Growing Identification Technology: RFID Tags
- Key Drivers: Stringent regulations, rising demand for vehicle identification, enhanced supply chain visibility, and growth of connected vehicles.
Custom Automotive Labels Market Product Landscape
The custom automotive label market offers a diverse range of products tailored to specific automotive applications. This includes durable, weatherproof labels for exterior applications, high-temperature resistant labels for engine components, and customizable branding labels for interior trim. Innovations include the use of smart labels with embedded RFID tags for efficient tracking and inventory management, along with labels incorporating sophisticated security features to combat counterfeiting. Unique selling propositions often include specialized adhesives, materials with extended durability, and integrated tracking capabilities.
Key Drivers, Barriers & Challenges in Custom Automotive Labels Market
Key Drivers: The increasing demand for vehicle traceability to enhance supply chain visibility and combat counterfeiting is a major driver. The growing adoption of advanced technologies, such as RFID and smart labels, is further accelerating growth. Government regulations mandating improved vehicle identification systems are also contributing to market expansion.
Key Challenges: High upfront investment costs for RFID and other advanced technologies can be a barrier for some companies. Supply chain disruptions can affect the availability of raw materials and timely delivery of custom labels. Competition from established players with extensive product portfolios and distribution networks poses a challenge to smaller companies.
Emerging Opportunities in Custom Automotive Labels Market
The increasing adoption of electric vehicles (EVs) presents a significant opportunity for custom automotive labels with specialized properties for battery management and other EV-specific components. The growth of connected cars and autonomous driving technologies is opening up new avenues for smart labels with integrated sensors and data communication capabilities. Developing labels with eco-friendly materials and manufacturing processes caters to the rising environmental awareness in the automotive industry.
Growth Accelerators in the Custom Automotive Labels Market Industry
Technological advancements in label materials and printing techniques are continuously enhancing the durability, functionality, and cost-effectiveness of custom automotive labels. Strategic partnerships between label manufacturers and automotive OEMs are facilitating the integration of advanced technologies into new vehicle models. Expansion into emerging markets, particularly in Asia and Latin America, where automotive production is growing rapidly, is creating significant opportunities for market expansion.
Key Players Shaping the Custom Automotive Labels Market Market
- Weber Packaging Solutions
- Imagetek Labels
- Clarion Safety System
- Resource Label Group LLC
- 3M Company
- Avery Dennison Corporation
- CILS International
- Asean Pack
- Label-Aid Systems Inc
- Polyonics Inc
- Advantage Label & Packaging Inc
- Brady Worldwide Inc
Notable Milestones in Custom Automotive Labels Market Sector
- April 2023: Cognosos launched the RT-270 FVL tag, enhancing automotive logistics efficiency and safety.
- January 2023: Avery Dennison invested over USD 100 million in a new RFID manufacturing facility in Mexico, boosting its capacity and reinforcing its commitment to supply chain innovation.
In-Depth Custom Automotive Labels Market Market Outlook
The future of the Custom Automotive Labels Market is bright, driven by ongoing technological advancements, increasing demand for enhanced vehicle traceability, and the expansion of the global automotive industry. Strategic partnerships, investments in R&D, and expansion into new markets will play a vital role in shaping the future of this dynamic sector. The continued integration of advanced technologies like RFID and the growing demand for sustainable labeling solutions will create substantial opportunities for growth and innovation in the coming years.
Custom Automotive Labels Market Segmentation
-
1. Identification Technology
- 1.1. Barcode
- 1.2. QR Code
- 1.3. RFID Tags
- 1.4. Other Identification Technologies
-
2. Type
- 2.1. Branding
- 2.2. Track & Trace
- 2.3. Warning & Safety
- 2.4. Asset Labels
- 2.5. Other Types (Tire Labels, Weatherproof Labels)
-
3. Application
- 3.1. Interior Applications
- 3.2. Exterior Applications
- 3.3. Engine Applications
- 3.4. Other Applications
Custom Automotive Labels Market Segmentation By Geography
-
1. North America
- 1.1. United States
- 1.2. Canada
-
2. Europe
- 2.1. United Kingdom
- 2.2. Germany
- 2.3. France
- 2.4. Spain
-
3. Asia
- 3.1. China
- 3.2. India
- 3.3. Japan
- 4. Australia and New Zealand
- 5. Latin America
- 6. Middle East and Africa
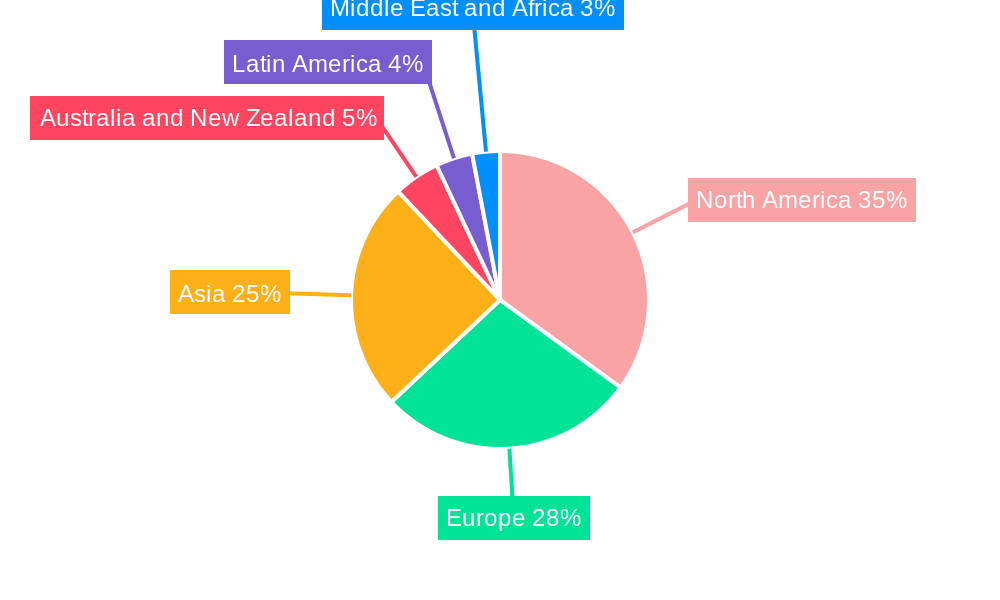
Custom Automotive Labels Market Regional Market Share
Geographic Coverage of Custom Automotive Labels Market
Custom Automotive Labels Market REPORT HIGHLIGHTS
| Aspects | Details |
|---|---|
| Study Period | 2020-2034 |
| Base Year | 2025 |
| Estimated Year | 2026 |
| Forecast Period | 2026-2034 |
| Historical Period | 2020-2025 |
| Growth Rate | CAGR of 5.37% from 2020-2034 |
| Segmentation |
|
Table of Contents
- 1. Introduction
- 1.1. Research Scope
- 1.2. Market Segmentation
- 1.3. Research Objective
- 1.4. Definitions and Assumptions
- 2. Executive Summary
- 2.1. Market Snapshot
- 3. Market Dynamics
- 3.1. Market Drivers
- 3.2. Market Restrains
- 3.3. Market Trends
- 3.4. Market Opportunities
- 4. Market Factor Analysis
- 4.1. Porters Five Forces
- 4.1.1. Bargaining Power of Suppliers
- 4.1.2. Bargaining Power of Buyers
- 4.1.3. Threat of New Entrants
- 4.1.4. Threat of Substitutes
- 4.1.5. Competitive Rivalry
- 4.2. PESTEL analysis
- 4.3. BCG Analysis
- 4.3.1. Stars (High Growth, High Market Share)
- 4.3.2. Cash Cows (Low Growth, High Market Share)
- 4.3.3. Question Mark (High Growth, Low Market Share)
- 4.3.4. Dogs (Low Growth, Low Market Share)
- 4.4. Ansoff Matrix Analysis
- 4.5. Supply Chain Analysis
- 4.6. Regulatory Landscape
- 4.7. Current Market Potential and Opportunity Assessment (TAM–SAM–SOM Framework)
- 4.8. VDR Analyst Note
- 4.1. Porters Five Forces
- 5. Market Analysis, Insights and Forecast 2021-2033
- 5.1. Market Analysis, Insights and Forecast - by Identification Technology
- 5.1.1. Barcode
- 5.1.2. QR Code
- 5.1.3. RFID Tags
- 5.1.4. Other Identification Technologies
- 5.2. Market Analysis, Insights and Forecast - by Type
- 5.2.1. Branding
- 5.2.2. Track & Trace
- 5.2.3. Warning & Safety
- 5.2.4. Asset Labels
- 5.2.5. Other Types (Tire Labels, Weatherproof Labels)
- 5.3. Market Analysis, Insights and Forecast - by Application
- 5.3.1. Interior Applications
- 5.3.2. Exterior Applications
- 5.3.3. Engine Applications
- 5.3.4. Other Applications
- 5.4. Market Analysis, Insights and Forecast - by Region
- 5.4.1. North America
- 5.4.2. Europe
- 5.4.3. Asia
- 5.4.4. Australia and New Zealand
- 5.4.5. Latin America
- 5.4.6. Middle East and Africa
- 5.1. Market Analysis, Insights and Forecast - by Identification Technology
- 6. Global Custom Automotive Labels Market Analysis, Insights and Forecast, 2021-2033
- 6.1. Market Analysis, Insights and Forecast - by Identification Technology
- 6.1.1. Barcode
- 6.1.2. QR Code
- 6.1.3. RFID Tags
- 6.1.4. Other Identification Technologies
- 6.2. Market Analysis, Insights and Forecast - by Type
- 6.2.1. Branding
- 6.2.2. Track & Trace
- 6.2.3. Warning & Safety
- 6.2.4. Asset Labels
- 6.2.5. Other Types (Tire Labels, Weatherproof Labels)
- 6.3. Market Analysis, Insights and Forecast - by Application
- 6.3.1. Interior Applications
- 6.3.2. Exterior Applications
- 6.3.3. Engine Applications
- 6.3.4. Other Applications
- 6.1. Market Analysis, Insights and Forecast - by Identification Technology
- 7. North America Custom Automotive Labels Market Analysis, Insights and Forecast, 2021-2033
- 7.1. Market Analysis, Insights and Forecast - by Identification Technology
- 7.1.1. Barcode
- 7.1.2. QR Code
- 7.1.3. RFID Tags
- 7.1.4. Other Identification Technologies
- 7.2. Market Analysis, Insights and Forecast - by Type
- 7.2.1. Branding
- 7.2.2. Track & Trace
- 7.2.3. Warning & Safety
- 7.2.4. Asset Labels
- 7.2.5. Other Types (Tire Labels, Weatherproof Labels)
- 7.3. Market Analysis, Insights and Forecast - by Application
- 7.3.1. Interior Applications
- 7.3.2. Exterior Applications
- 7.3.3. Engine Applications
- 7.3.4. Other Applications
- 7.1. Market Analysis, Insights and Forecast - by Identification Technology
- 8. Europe Custom Automotive Labels Market Analysis, Insights and Forecast, 2021-2033
- 8.1. Market Analysis, Insights and Forecast - by Identification Technology
- 8.1.1. Barcode
- 8.1.2. QR Code
- 8.1.3. RFID Tags
- 8.1.4. Other Identification Technologies
- 8.2. Market Analysis, Insights and Forecast - by Type
- 8.2.1. Branding
- 8.2.2. Track & Trace
- 8.2.3. Warning & Safety
- 8.2.4. Asset Labels
- 8.2.5. Other Types (Tire Labels, Weatherproof Labels)
- 8.3. Market Analysis, Insights and Forecast - by Application
- 8.3.1. Interior Applications
- 8.3.2. Exterior Applications
- 8.3.3. Engine Applications
- 8.3.4. Other Applications
- 8.1. Market Analysis, Insights and Forecast - by Identification Technology
- 9. Asia Custom Automotive Labels Market Analysis, Insights and Forecast, 2021-2033
- 9.1. Market Analysis, Insights and Forecast - by Identification Technology
- 9.1.1. Barcode
- 9.1.2. QR Code
- 9.1.3. RFID Tags
- 9.1.4. Other Identification Technologies
- 9.2. Market Analysis, Insights and Forecast - by Type
- 9.2.1. Branding
- 9.2.2. Track & Trace
- 9.2.3. Warning & Safety
- 9.2.4. Asset Labels
- 9.2.5. Other Types (Tire Labels, Weatherproof Labels)
- 9.3. Market Analysis, Insights and Forecast - by Application
- 9.3.1. Interior Applications
- 9.3.2. Exterior Applications
- 9.3.3. Engine Applications
- 9.3.4. Other Applications
- 9.1. Market Analysis, Insights and Forecast - by Identification Technology
- 10. Australia and New Zealand Custom Automotive Labels Market Analysis, Insights and Forecast, 2021-2033
- 10.1. Market Analysis, Insights and Forecast - by Identification Technology
- 10.1.1. Barcode
- 10.1.2. QR Code
- 10.1.3. RFID Tags
- 10.1.4. Other Identification Technologies
- 10.2. Market Analysis, Insights and Forecast - by Type
- 10.2.1. Branding
- 10.2.2. Track & Trace
- 10.2.3. Warning & Safety
- 10.2.4. Asset Labels
- 10.2.5. Other Types (Tire Labels, Weatherproof Labels)
- 10.3. Market Analysis, Insights and Forecast - by Application
- 10.3.1. Interior Applications
- 10.3.2. Exterior Applications
- 10.3.3. Engine Applications
- 10.3.4. Other Applications
- 10.1. Market Analysis, Insights and Forecast - by Identification Technology
- 11. Latin America Custom Automotive Labels Market Analysis, Insights and Forecast, 2021-2033
- 11.1. Market Analysis, Insights and Forecast - by Identification Technology
- 11.1.1. Barcode
- 11.1.2. QR Code
- 11.1.3. RFID Tags
- 11.1.4. Other Identification Technologies
- 11.2. Market Analysis, Insights and Forecast - by Type
- 11.2.1. Branding
- 11.2.2. Track & Trace
- 11.2.3. Warning & Safety
- 11.2.4. Asset Labels
- 11.2.5. Other Types (Tire Labels, Weatherproof Labels)
- 11.3. Market Analysis, Insights and Forecast - by Application
- 11.3.1. Interior Applications
- 11.3.2. Exterior Applications
- 11.3.3. Engine Applications
- 11.3.4. Other Applications
- 11.1. Market Analysis, Insights and Forecast - by Identification Technology
- 12. Middle East and Africa Custom Automotive Labels Market Analysis, Insights and Forecast, 2021-2033
- 12.1. Market Analysis, Insights and Forecast - by Identification Technology
- 12.1.1. Barcode
- 12.1.2. QR Code
- 12.1.3. RFID Tags
- 12.1.4. Other Identification Technologies
- 12.2. Market Analysis, Insights and Forecast - by Type
- 12.2.1. Branding
- 12.2.2. Track & Trace
- 12.2.3. Warning & Safety
- 12.2.4. Asset Labels
- 12.2.5. Other Types (Tire Labels, Weatherproof Labels)
- 12.3. Market Analysis, Insights and Forecast - by Application
- 12.3.1. Interior Applications
- 12.3.2. Exterior Applications
- 12.3.3. Engine Applications
- 12.3.4. Other Applications
- 12.1. Market Analysis, Insights and Forecast - by Identification Technology
- 13. Competitive Analysis
- 13.1. Company Profiles
- 13.1.1 Weber Packaging Solutions
- 13.1.1.1. Company Overview
- 13.1.1.2. Products
- 13.1.1.3. Company Financials
- 13.1.1.4. SWOT Analysis
- 13.1.2 Imagetek Labels
- 13.1.2.1. Company Overview
- 13.1.2.2. Products
- 13.1.2.3. Company Financials
- 13.1.2.4. SWOT Analysis
- 13.1.3 Clarion Safety System
- 13.1.3.1. Company Overview
- 13.1.3.2. Products
- 13.1.3.3. Company Financials
- 13.1.3.4. SWOT Analysis
- 13.1.4 Resource Label Group LLC
- 13.1.4.1. Company Overview
- 13.1.4.2. Products
- 13.1.4.3. Company Financials
- 13.1.4.4. SWOT Analysis
- 13.1.5 3M Company
- 13.1.5.1. Company Overview
- 13.1.5.2. Products
- 13.1.5.3. Company Financials
- 13.1.5.4. SWOT Analysis
- 13.1.6 Avery Dennison Corporation
- 13.1.6.1. Company Overview
- 13.1.6.2. Products
- 13.1.6.3. Company Financials
- 13.1.6.4. SWOT Analysis
- 13.1.7 CILS International
- 13.1.7.1. Company Overview
- 13.1.7.2. Products
- 13.1.7.3. Company Financials
- 13.1.7.4. SWOT Analysis
- 13.1.8 Asean Pack
- 13.1.8.1. Company Overview
- 13.1.8.2. Products
- 13.1.8.3. Company Financials
- 13.1.8.4. SWOT Analysis
- 13.1.9 Label-Aid Systems Inc
- 13.1.9.1. Company Overview
- 13.1.9.2. Products
- 13.1.9.3. Company Financials
- 13.1.9.4. SWOT Analysis
- 13.1.10 Polyonics Inc
- 13.1.10.1. Company Overview
- 13.1.10.2. Products
- 13.1.10.3. Company Financials
- 13.1.10.4. SWOT Analysis
- 13.1.11 Advantage Label & Packaging Inc
- 13.1.11.1. Company Overview
- 13.1.11.2. Products
- 13.1.11.3. Company Financials
- 13.1.11.4. SWOT Analysis
- 13.1.12 Brady Worldwide Inc
- 13.1.12.1. Company Overview
- 13.1.12.2. Products
- 13.1.12.3. Company Financials
- 13.1.12.4. SWOT Analysis
- 13.1.1 Weber Packaging Solutions
- 13.2. Market Entropy
- 13.2.1 Company's Key Areas Served
- 13.2.2 Recent Developments
- 13.3. Company Market Share Analysis 2025
- 13.3.1 Top 5 Companies Market Share Analysis
- 13.3.2 Top 3 Companies Market Share Analysis
- 13.4. List of Potential Customers
- 14. Research Methodology
List of Figures
- Figure 1: Global Custom Automotive Labels Market Revenue Breakdown (Million, %) by Region 2025 & 2033
- Figure 2: North America Custom Automotive Labels Market Revenue (Million), by Identification Technology 2025 & 2033
- Figure 3: North America Custom Automotive Labels Market Revenue Share (%), by Identification Technology 2025 & 2033
- Figure 4: North America Custom Automotive Labels Market Revenue (Million), by Type 2025 & 2033
- Figure 5: North America Custom Automotive Labels Market Revenue Share (%), by Type 2025 & 2033
- Figure 6: North America Custom Automotive Labels Market Revenue (Million), by Application 2025 & 2033
- Figure 7: North America Custom Automotive Labels Market Revenue Share (%), by Application 2025 & 2033
- Figure 8: North America Custom Automotive Labels Market Revenue (Million), by Country 2025 & 2033
- Figure 9: North America Custom Automotive Labels Market Revenue Share (%), by Country 2025 & 2033
- Figure 10: Europe Custom Automotive Labels Market Revenue (Million), by Identification Technology 2025 & 2033
- Figure 11: Europe Custom Automotive Labels Market Revenue Share (%), by Identification Technology 2025 & 2033
- Figure 12: Europe Custom Automotive Labels Market Revenue (Million), by Type 2025 & 2033
- Figure 13: Europe Custom Automotive Labels Market Revenue Share (%), by Type 2025 & 2033
- Figure 14: Europe Custom Automotive Labels Market Revenue (Million), by Application 2025 & 2033
- Figure 15: Europe Custom Automotive Labels Market Revenue Share (%), by Application 2025 & 2033
- Figure 16: Europe Custom Automotive Labels Market Revenue (Million), by Country 2025 & 2033
- Figure 17: Europe Custom Automotive Labels Market Revenue Share (%), by Country 2025 & 2033
- Figure 18: Asia Custom Automotive Labels Market Revenue (Million), by Identification Technology 2025 & 2033
- Figure 19: Asia Custom Automotive Labels Market Revenue Share (%), by Identification Technology 2025 & 2033
- Figure 20: Asia Custom Automotive Labels Market Revenue (Million), by Type 2025 & 2033
- Figure 21: Asia Custom Automotive Labels Market Revenue Share (%), by Type 2025 & 2033
- Figure 22: Asia Custom Automotive Labels Market Revenue (Million), by Application 2025 & 2033
- Figure 23: Asia Custom Automotive Labels Market Revenue Share (%), by Application 2025 & 2033
- Figure 24: Asia Custom Automotive Labels Market Revenue (Million), by Country 2025 & 2033
- Figure 25: Asia Custom Automotive Labels Market Revenue Share (%), by Country 2025 & 2033
- Figure 26: Australia and New Zealand Custom Automotive Labels Market Revenue (Million), by Identification Technology 2025 & 2033
- Figure 27: Australia and New Zealand Custom Automotive Labels Market Revenue Share (%), by Identification Technology 2025 & 2033
- Figure 28: Australia and New Zealand Custom Automotive Labels Market Revenue (Million), by Type 2025 & 2033
- Figure 29: Australia and New Zealand Custom Automotive Labels Market Revenue Share (%), by Type 2025 & 2033
- Figure 30: Australia and New Zealand Custom Automotive Labels Market Revenue (Million), by Application 2025 & 2033
- Figure 31: Australia and New Zealand Custom Automotive Labels Market Revenue Share (%), by Application 2025 & 2033
- Figure 32: Australia and New Zealand Custom Automotive Labels Market Revenue (Million), by Country 2025 & 2033
- Figure 33: Australia and New Zealand Custom Automotive Labels Market Revenue Share (%), by Country 2025 & 2033
- Figure 34: Latin America Custom Automotive Labels Market Revenue (Million), by Identification Technology 2025 & 2033
- Figure 35: Latin America Custom Automotive Labels Market Revenue Share (%), by Identification Technology 2025 & 2033
- Figure 36: Latin America Custom Automotive Labels Market Revenue (Million), by Type 2025 & 2033
- Figure 37: Latin America Custom Automotive Labels Market Revenue Share (%), by Type 2025 & 2033
- Figure 38: Latin America Custom Automotive Labels Market Revenue (Million), by Application 2025 & 2033
- Figure 39: Latin America Custom Automotive Labels Market Revenue Share (%), by Application 2025 & 2033
- Figure 40: Latin America Custom Automotive Labels Market Revenue (Million), by Country 2025 & 2033
- Figure 41: Latin America Custom Automotive Labels Market Revenue Share (%), by Country 2025 & 2033
- Figure 42: Middle East and Africa Custom Automotive Labels Market Revenue (Million), by Identification Technology 2025 & 2033
- Figure 43: Middle East and Africa Custom Automotive Labels Market Revenue Share (%), by Identification Technology 2025 & 2033
- Figure 44: Middle East and Africa Custom Automotive Labels Market Revenue (Million), by Type 2025 & 2033
- Figure 45: Middle East and Africa Custom Automotive Labels Market Revenue Share (%), by Type 2025 & 2033
- Figure 46: Middle East and Africa Custom Automotive Labels Market Revenue (Million), by Application 2025 & 2033
- Figure 47: Middle East and Africa Custom Automotive Labels Market Revenue Share (%), by Application 2025 & 2033
- Figure 48: Middle East and Africa Custom Automotive Labels Market Revenue (Million), by Country 2025 & 2033
- Figure 49: Middle East and Africa Custom Automotive Labels Market Revenue Share (%), by Country 2025 & 2033
List of Tables
- Table 1: Global Custom Automotive Labels Market Revenue Million Forecast, by Identification Technology 2020 & 2033
- Table 2: Global Custom Automotive Labels Market Revenue Million Forecast, by Type 2020 & 2033
- Table 3: Global Custom Automotive Labels Market Revenue Million Forecast, by Application 2020 & 2033
- Table 4: Global Custom Automotive Labels Market Revenue Million Forecast, by Region 2020 & 2033
- Table 5: Global Custom Automotive Labels Market Revenue Million Forecast, by Identification Technology 2020 & 2033
- Table 6: Global Custom Automotive Labels Market Revenue Million Forecast, by Type 2020 & 2033
- Table 7: Global Custom Automotive Labels Market Revenue Million Forecast, by Application 2020 & 2033
- Table 8: Global Custom Automotive Labels Market Revenue Million Forecast, by Country 2020 & 2033
- Table 9: United States Custom Automotive Labels Market Revenue (Million) Forecast, by Application 2020 & 2033
- Table 10: Canada Custom Automotive Labels Market Revenue (Million) Forecast, by Application 2020 & 2033
- Table 11: Global Custom Automotive Labels Market Revenue Million Forecast, by Identification Technology 2020 & 2033
- Table 12: Global Custom Automotive Labels Market Revenue Million Forecast, by Type 2020 & 2033
- Table 13: Global Custom Automotive Labels Market Revenue Million Forecast, by Application 2020 & 2033
- Table 14: Global Custom Automotive Labels Market Revenue Million Forecast, by Country 2020 & 2033
- Table 15: United Kingdom Custom Automotive Labels Market Revenue (Million) Forecast, by Application 2020 & 2033
- Table 16: Germany Custom Automotive Labels Market Revenue (Million) Forecast, by Application 2020 & 2033
- Table 17: France Custom Automotive Labels Market Revenue (Million) Forecast, by Application 2020 & 2033
- Table 18: Spain Custom Automotive Labels Market Revenue (Million) Forecast, by Application 2020 & 2033
- Table 19: Global Custom Automotive Labels Market Revenue Million Forecast, by Identification Technology 2020 & 2033
- Table 20: Global Custom Automotive Labels Market Revenue Million Forecast, by Type 2020 & 2033
- Table 21: Global Custom Automotive Labels Market Revenue Million Forecast, by Application 2020 & 2033
- Table 22: Global Custom Automotive Labels Market Revenue Million Forecast, by Country 2020 & 2033
- Table 23: China Custom Automotive Labels Market Revenue (Million) Forecast, by Application 2020 & 2033
- Table 24: India Custom Automotive Labels Market Revenue (Million) Forecast, by Application 2020 & 2033
- Table 25: Japan Custom Automotive Labels Market Revenue (Million) Forecast, by Application 2020 & 2033
- Table 26: Global Custom Automotive Labels Market Revenue Million Forecast, by Identification Technology 2020 & 2033
- Table 27: Global Custom Automotive Labels Market Revenue Million Forecast, by Type 2020 & 2033
- Table 28: Global Custom Automotive Labels Market Revenue Million Forecast, by Application 2020 & 2033
- Table 29: Global Custom Automotive Labels Market Revenue Million Forecast, by Country 2020 & 2033
- Table 30: Global Custom Automotive Labels Market Revenue Million Forecast, by Identification Technology 2020 & 2033
- Table 31: Global Custom Automotive Labels Market Revenue Million Forecast, by Type 2020 & 2033
- Table 32: Global Custom Automotive Labels Market Revenue Million Forecast, by Application 2020 & 2033
- Table 33: Global Custom Automotive Labels Market Revenue Million Forecast, by Country 2020 & 2033
- Table 34: Global Custom Automotive Labels Market Revenue Million Forecast, by Identification Technology 2020 & 2033
- Table 35: Global Custom Automotive Labels Market Revenue Million Forecast, by Type 2020 & 2033
- Table 36: Global Custom Automotive Labels Market Revenue Million Forecast, by Application 2020 & 2033
- Table 37: Global Custom Automotive Labels Market Revenue Million Forecast, by Country 2020 & 2033
Frequently Asked Questions
1. What is the projected Compound Annual Growth Rate (CAGR) of the Custom Automotive Labels Market?
The projected CAGR is approximately 5.37%.
2. Which companies are prominent players in the Custom Automotive Labels Market?
Key companies in the market include Weber Packaging Solutions, Imagetek Labels, Clarion Safety System, Resource Label Group LLC, 3M Company, Avery Dennison Corporation, CILS International, Asean Pack, Label-Aid Systems Inc, Polyonics Inc, Advantage Label & Packaging Inc, Brady Worldwide Inc.
3. What are the main segments of the Custom Automotive Labels Market?
The market segments include Identification Technology, Type, Application.
4. Can you provide details about the market size?
The market size is estimated to be USD 8.23 Million as of 2022.
5. What are some drivers contributing to market growth?
Growing Demand From the Automotive Industry for RFID Labels; Increasing Compliance With Label Laws.
6. What are the notable trends driving market growth?
Barcode Segment to Hold Major Market Share.
7. Are there any restraints impacting market growth?
Cost of Manufacturing Greater for Small Manufacturers.
8. Can you provide examples of recent developments in the market?
April 2023: Cognosos unveiled the RT-270, the latest iteration of the company's FVL (finished vehicle logistics) tags. These cutting-edge tags are specifically designed to enhance the efficiency, productivity, and safety of automotive OEMs (original equipment manufacturers) and shippers. The RT-270 tags come equipped with a robust feature set, including 900MHz wireless networking, Bluetooth (BLE) connectivity, and an innovative LED light to improve usability.
9. What pricing options are available for accessing the report?
Pricing options include single-user, multi-user, and enterprise licenses priced at USD 4750, USD 5250, and USD 8750 respectively.
10. Is the market size provided in terms of value or volume?
The market size is provided in terms of value, measured in Million.
11. Are there any specific market keywords associated with the report?
Yes, the market keyword associated with the report is "Custom Automotive Labels Market," which aids in identifying and referencing the specific market segment covered.
12. How do I determine which pricing option suits my needs best?
The pricing options vary based on user requirements and access needs. Individual users may opt for single-user licenses, while businesses requiring broader access may choose multi-user or enterprise licenses for cost-effective access to the report.
13. Are there any additional resources or data provided in the Custom Automotive Labels Market report?
While the report offers comprehensive insights, it's advisable to review the specific contents or supplementary materials provided to ascertain if additional resources or data are available.
14. How can I stay updated on further developments or reports in the Custom Automotive Labels Market?
To stay informed about further developments, trends, and reports in the Custom Automotive Labels Market, consider subscribing to industry newsletters, following relevant companies and organizations, or regularly checking reputable industry news sources and publications.
Methodology
Step 1 - Identification of Relevant Samples Size from Population Database


Step 2 - Approaches for Defining Global Market Size (Value, Volume* & Price*)

Note*: In applicable scenarios
Step 3 - Data Sources
Primary Research
- Web Analytics
- Survey Reports
- Research Institute
- Latest Research Reports
- Opinion Leaders
Secondary Research
- Annual Reports
- White Paper
- Latest Press Release
- Industry Association
- Paid Database
- Investor Presentations

Step 4 - Data Triangulation
Involves using different sources of information in order to increase the validity of a study
These sources are likely to be stakeholders in a program - participants, other researchers, program staff, other community members, and so on.
Then we put all data in single framework & apply various statistical tools to find out the dynamic on the market.
During the analysis stage, feedback from the stakeholder groups would be compared to determine areas of agreement as well as areas of divergence