

Key Insights
The global Crude Oil Carriers market, valued at $225142.8 million in the base year 2025, is poised for significant expansion. Driven by escalating worldwide crude oil demand and the continuous growth of maritime trade, the market is projected to achieve a Compound Annual Growth Rate (CAGR) of 4.6%. Key growth catalysts include the increasing global energy consumption, particularly in emerging economies, which necessitates efficient crude oil transportation solutions. The industry is segmented by vessel size, including Medium Range, Panamax, Aframax, Suezmax, VLCCs, and ULCCs, each serving distinct logistical requirements. While growth is evident, the sector faces challenges such as volatile oil prices, geopolitical disruptions affecting trade routes, and the accelerating transition to cleaner energy sources impacting long-term demand. Major industry participants like National Iranian Oil Company (NIOC), Teekay Corporation, and China Cosco Shipping Corporation Limited are influencing the competitive environment through fleet modernization, strategic alliances, and enhanced operational efficiency. Geographically, North America, Europe, and Asia Pacific represent key market hubs, with substantial growth potential identified in the Middle East, Africa, and South America.
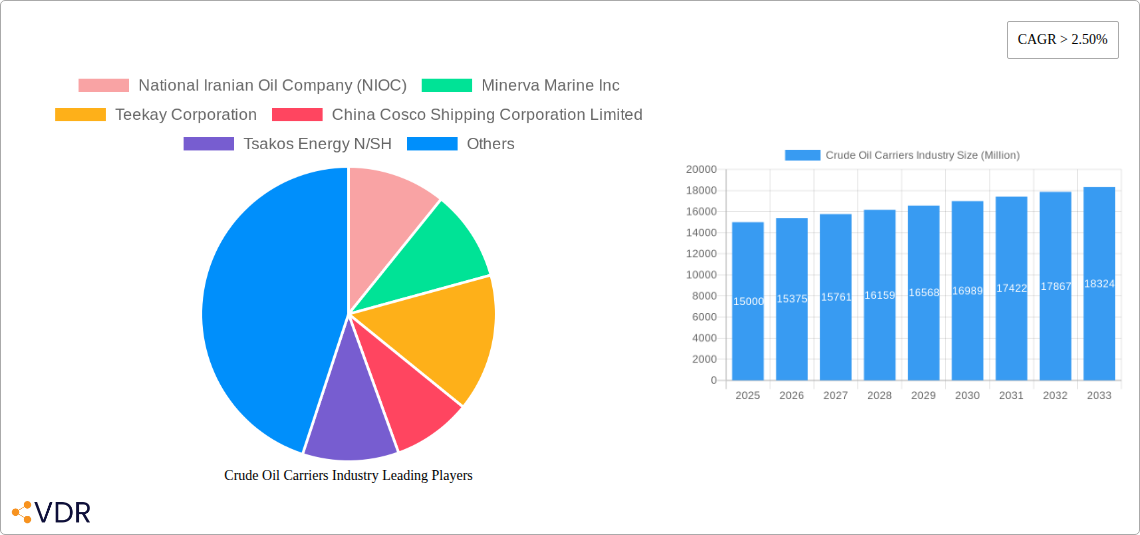
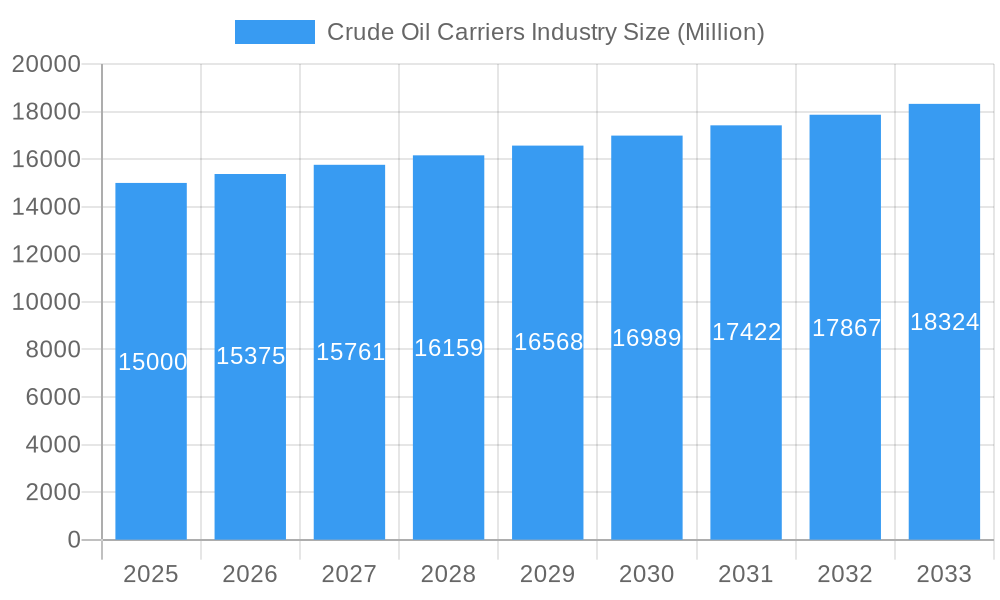
Crude Oil Carriers Industry Market Size (In Billion)
The forecast period, spanning 2025 to 2033, anticipates sustained expansion within the Crude Oil Carriers market. However, this growth will be shaped by evolving environmental regulations for shipping, technological advancements promoting vessel efficiency and reduced emissions, and shifts in the global energy landscape. Effective risk management, encompassing price volatility hedging and stringent security protocols, will be paramount for sustained success. Intense industry competition underscores the importance of strategic collaborations and operational excellence. A discernible trend towards consolidation among key players suggests a move towards larger, more resilient entities capable of navigating industry challenges and capitalizing on emerging opportunities. The market's future outlook remains positive, contingent upon prevailing global economic and political dynamics.
Crude Oil Carriers Industry Company Market Share
This report offers an in-depth analysis of the Crude Oil Carriers industry, examining market dynamics, growth trajectories, competitive landscapes, and future projections. The study period encompasses 2019-2033, with 2025 designated as the base and estimated year. This research is indispensable for industry professionals, investors, and strategic decision-makers seeking comprehensive insights into this critical segment of the global maritime and energy sectors. The market is segmented by vessel type: Medium Range, Panamax, Aframax, Suezmax, Very Large Crude Carriers (VLCCs), and Ultra Large Crude Carriers (ULCCs).
Crude Oil Carriers Industry Market Dynamics & Structure
The crude oil carrier market is characterized by a moderately concentrated structure, with a few major players holding significant market share. The industry is influenced by technological advancements in vessel design and efficiency, stringent international regulatory frameworks (like IMO 2020), and the emergence of competitive substitutes, such as pipelines and rail transport. End-user demographics are largely driven by global oil consumption patterns and the geographical distribution of oil production and refining facilities. Mergers and acquisitions (M&A) activity has been significant, with larger companies seeking to consolidate their position and enhance their operational efficiency.
- Market Concentration: The top 5 players hold approximately xx% of the market share in 2025.
- Technological Innovation: Focus on fuel efficiency, automation, and digitalization are key drivers. Barriers to innovation include high capital expenditure and regulatory compliance.
- Regulatory Frameworks: IMO regulations regarding emissions and safety significantly impact operational costs and vessel design.
- M&A Activity: An estimated xx deals valued at $xx million were completed between 2019 and 2024.
- Competitive Substitutes: Pipelines and rail networks present competition, particularly for shorter distances.
Crude Oil Carriers Industry Growth Trends & Insights
The crude oil carrier market experienced a period of [Describe market trend from 2019-2024, e.g., moderate growth/decline] between 2019 and 2024, driven by [explain factors, e.g., fluctuating oil prices, geopolitical events]. The market size is projected to reach $xx million in 2025 and is forecast to grow at a CAGR of xx% from 2025 to 2033, reaching $xx million by 2033. This growth is primarily fueled by increasing global demand for crude oil, albeit with potential fluctuations due to economic cycles and shifts in energy consumption patterns. Technological advancements, particularly in vessel efficiency and automation, are further contributing to market expansion. Consumer behavior, in this context, is shaped by global oil demand fluctuations and the adoption of environmentally friendly shipping practices.
Dominant Regions, Countries, or Segments in Crude Oil Carriers Industry
The VLCC and Suezmax segments are currently the dominant players in terms of vessel size, accounting for approximately xx% and xx% of the market, respectively. Asia, particularly the Middle East and East Asia, remain the leading regions due to high crude oil production and consumption. Key drivers include:
- Strong economic growth in Asia: Fueled high demand for oil transportation.
- Extensive port infrastructure: Supports handling large vessels.
- Favorable government policies: Encourage shipping and trade.
Growth potential is significant in regions with expanding oil production and consumption, such as [mention specific regions, e.g., Sub-Saharan Africa, South America]. However, challenges remain due to geopolitical instability, infrastructural limitations, and environmental regulations in certain regions.
Crude Oil Carriers Industry Product Landscape
The crude oil carrier industry is marked by continuous innovation in vessel design, focusing on fuel efficiency (e.g., slow steaming, energy-efficient engines) and environmental compliance (e.g., scrubber technology, LNG-fueled vessels). Technological advancements like automation and digitalization are enhancing operational efficiency and safety. Unique selling propositions often center around vessel size, speed, environmental performance, and technological features.
Key Drivers, Barriers & Challenges in Crude Oil Carriers Industry
Key Drivers:
- Increasing global demand for crude oil.
- Technological advancements in vessel design and efficiency.
- Growth of global trade.
Challenges:
- Fluctuating oil prices and unpredictable demand.
- Stringent environmental regulations impacting operational costs.
- Intense competition among shipping companies.
- Supply chain disruptions (e.g., port congestion) leading to xx% increase in delivery times and xx% in costs.
Emerging Opportunities in Crude Oil Carriers Industry
- Expansion into emerging markets with growing energy demand.
- Development of environmentally friendly vessels to meet stricter regulations.
- Adoption of digital technologies to improve efficiency and reduce costs.
- Strategic partnerships and alliances to enhance market share and operational capabilities.
Growth Accelerators in the Crude Oil Carriers Industry Industry
Long-term growth is expected to be driven by sustainable practices like using alternative fuels, technological advancements, and strategic alliances. The continuous focus on optimizing vessel designs for efficiency, along with expanding the market presence in regions with high growth potential, will accelerate industry growth.
Key Players Shaping the Crude Oil Carriers Industry Market
- National Iranian Oil Company (NIOC)
- Minerva Marine Inc
- Teekay Corporation
- China Cosco Shipping Corporation Limited
- Tsakos Energy N/SH
- China Merchants Group Ltd
- Euronav NV
- Petroliam Nasional Berhad (PETRONAS)
- The National Shipping Co Saudi Arabia
- Angelicoussis Shipping Group Ltd
Notable Milestones in Crude Oil Carriers Industry Sector
- 2020: Implementation of IMO 2020 sulfur cap significantly impacting fuel costs and vessel modifications.
- 2022: Increased M&A activity among major players to consolidate market share.
- 2023: Several companies announced investments in LNG-fueled vessels. (Further milestones can be added here)
In-Depth Crude Oil Carriers Industry Market Outlook
The crude oil carrier market presents significant long-term growth potential, driven by increasing global energy demand and the need for efficient and environmentally compliant transportation solutions. Strategic partnerships, technological innovation, and expansion into new markets will be key factors in shaping the future landscape of the industry. Opportunities exist for companies to invest in fuel-efficient and environmentally friendly technologies, optimize their operational efficiency, and strategically expand their global reach.
Crude Oil Carriers Industry Segmentation
-
1. Size
- 1.1. Medium Range
- 1.2. Panaxax
- 1.3. Aframax
- 1.4. Suezmax
- 1.5. Very Lar
Crude Oil Carriers Industry Segmentation By Geography
- 1. North America
- 2. Europe
- 3. Asia Pacific
- 4. South America
- 5. Middle East
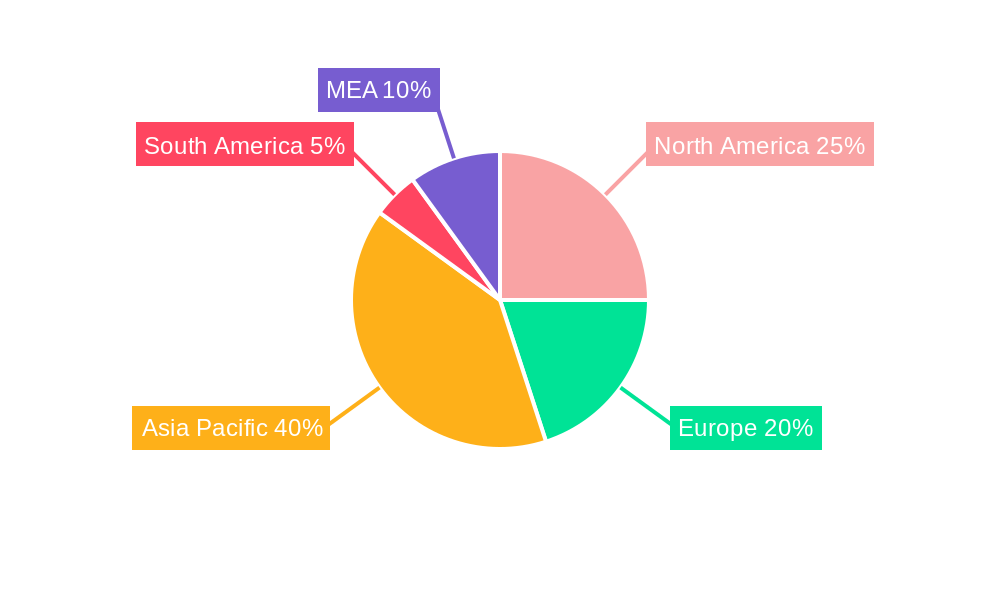
Crude Oil Carriers Industry Regional Market Share
Geographic Coverage of Crude Oil Carriers Industry
Crude Oil Carriers Industry REPORT HIGHLIGHTS
| Aspects | Details |
|---|---|
| Study Period | 2020-2034 |
| Base Year | 2025 |
| Estimated Year | 2026 |
| Forecast Period | 2026-2034 |
| Historical Period | 2020-2025 |
| Growth Rate | CAGR of 4.6% from 2020-2034 |
| Segmentation |
|
Table of Contents
- 1. Introduction
- 1.1. Research Scope
- 1.2. Market Segmentation
- 1.3. Research Objective
- 1.4. Definitions and Assumptions
- 2. Executive Summary
- 2.1. Market Snapshot
- 3. Market Dynamics
- 3.1. Market Drivers
- 3.2. Market Restrains
- 3.3. Market Trends
- 3.4. Market Opportunities
- 4. Market Factor Analysis
- 4.1. Porters Five Forces
- 4.1.1. Bargaining Power of Suppliers
- 4.1.2. Bargaining Power of Buyers
- 4.1.3. Threat of New Entrants
- 4.1.4. Threat of Substitutes
- 4.1.5. Competitive Rivalry
- 4.2. PESTEL analysis
- 4.3. BCG Analysis
- 4.3.1. Stars (High Growth, High Market Share)
- 4.3.2. Cash Cows (Low Growth, High Market Share)
- 4.3.3. Question Mark (High Growth, Low Market Share)
- 4.3.4. Dogs (Low Growth, Low Market Share)
- 4.4. Ansoff Matrix Analysis
- 4.5. Supply Chain Analysis
- 4.6. Regulatory Landscape
- 4.7. Current Market Potential and Opportunity Assessment (TAM–SAM–SOM Framework)
- 4.8. VDR Analyst Note
- 4.1. Porters Five Forces
- 5. Market Analysis, Insights and Forecast 2021-2033
- 5.1. Market Analysis, Insights and Forecast - by Size
- 5.1.1. Medium Range
- 5.1.2. Panaxax
- 5.1.3. Aframax
- 5.1.4. Suezmax
- 5.1.5. Very Lar
- 5.2. Market Analysis, Insights and Forecast - by Region
- 5.2.1. North America
- 5.2.2. Europe
- 5.2.3. Asia Pacific
- 5.2.4. South America
- 5.2.5. Middle East
- 5.1. Market Analysis, Insights and Forecast - by Size
- 6. Global Crude Oil Carriers Industry Analysis, Insights and Forecast, 2021-2033
- 6.1. Market Analysis, Insights and Forecast - by Size
- 6.1.1. Medium Range
- 6.1.2. Panaxax
- 6.1.3. Aframax
- 6.1.4. Suezmax
- 6.1.5. Very Lar
- 6.1. Market Analysis, Insights and Forecast - by Size
- 7. North America Crude Oil Carriers Industry Analysis, Insights and Forecast, 2021-2033
- 7.1. Market Analysis, Insights and Forecast - by Size
- 7.1.1. Medium Range
- 7.1.2. Panaxax
- 7.1.3. Aframax
- 7.1.4. Suezmax
- 7.1.5. Very Lar
- 7.1. Market Analysis, Insights and Forecast - by Size
- 8. Europe Crude Oil Carriers Industry Analysis, Insights and Forecast, 2021-2033
- 8.1. Market Analysis, Insights and Forecast - by Size
- 8.1.1. Medium Range
- 8.1.2. Panaxax
- 8.1.3. Aframax
- 8.1.4. Suezmax
- 8.1.5. Very Lar
- 8.1. Market Analysis, Insights and Forecast - by Size
- 9. Asia Pacific Crude Oil Carriers Industry Analysis, Insights and Forecast, 2021-2033
- 9.1. Market Analysis, Insights and Forecast - by Size
- 9.1.1. Medium Range
- 9.1.2. Panaxax
- 9.1.3. Aframax
- 9.1.4. Suezmax
- 9.1.5. Very Lar
- 9.1. Market Analysis, Insights and Forecast - by Size
- 10. South America Crude Oil Carriers Industry Analysis, Insights and Forecast, 2021-2033
- 10.1. Market Analysis, Insights and Forecast - by Size
- 10.1.1. Medium Range
- 10.1.2. Panaxax
- 10.1.3. Aframax
- 10.1.4. Suezmax
- 10.1.5. Very Lar
- 10.1. Market Analysis, Insights and Forecast - by Size
- 11. Middle East Crude Oil Carriers Industry Analysis, Insights and Forecast, 2021-2033
- 11.1. Market Analysis, Insights and Forecast - by Size
- 11.1.1. Medium Range
- 11.1.2. Panaxax
- 11.1.3. Aframax
- 11.1.4. Suezmax
- 11.1.5. Very Lar
- 11.1. Market Analysis, Insights and Forecast - by Size
- 12. Competitive Analysis
- 12.1. Company Profiles
- 12.1.1 National Iranian Oil Company (NIOC)
- 12.1.1.1. Company Overview
- 12.1.1.2. Products
- 12.1.1.3. Company Financials
- 12.1.1.4. SWOT Analysis
- 12.1.2 Minerva Marine Inc
- 12.1.2.1. Company Overview
- 12.1.2.2. Products
- 12.1.2.3. Company Financials
- 12.1.2.4. SWOT Analysis
- 12.1.3 Teekay Corporation
- 12.1.3.1. Company Overview
- 12.1.3.2. Products
- 12.1.3.3. Company Financials
- 12.1.3.4. SWOT Analysis
- 12.1.4 China Cosco Shipping Corporation Limited
- 12.1.4.1. Company Overview
- 12.1.4.2. Products
- 12.1.4.3. Company Financials
- 12.1.4.4. SWOT Analysis
- 12.1.5 Tsakos Energy N/SH
- 12.1.5.1. Company Overview
- 12.1.5.2. Products
- 12.1.5.3. Company Financials
- 12.1.5.4. SWOT Analysis
- 12.1.6 China Merchants Group Ltd
- 12.1.6.1. Company Overview
- 12.1.6.2. Products
- 12.1.6.3. Company Financials
- 12.1.6.4. SWOT Analysis
- 12.1.7 Euronav NV
- 12.1.7.1. Company Overview
- 12.1.7.2. Products
- 12.1.7.3. Company Financials
- 12.1.7.4. SWOT Analysis
- 12.1.8 Petroliam Nasional Berhad (PETRONAS)*List Not Exhaustive
- 12.1.8.1. Company Overview
- 12.1.8.2. Products
- 12.1.8.3. Company Financials
- 12.1.8.4. SWOT Analysis
- 12.1.9 The National Shipping Co Saudi Arabia
- 12.1.9.1. Company Overview
- 12.1.9.2. Products
- 12.1.9.3. Company Financials
- 12.1.9.4. SWOT Analysis
- 12.1.10 Angelicoussis Shipping Group Ltd
- 12.1.10.1. Company Overview
- 12.1.10.2. Products
- 12.1.10.3. Company Financials
- 12.1.10.4. SWOT Analysis
- 12.1.1 National Iranian Oil Company (NIOC)
- 12.2. Market Entropy
- 12.2.1 Company's Key Areas Served
- 12.2.2 Recent Developments
- 12.3. Company Market Share Analysis 2025
- 12.3.1 Top 5 Companies Market Share Analysis
- 12.3.2 Top 3 Companies Market Share Analysis
- 12.4. List of Potential Customers
- 13. Research Methodology
List of Figures
- Figure 1: Global Crude Oil Carriers Industry Revenue Breakdown (million, %) by Region 2025 & 2033
- Figure 2: Global Crude Oil Carriers Industry Volume Breakdown (metric tonnes, %) by Region 2025 & 2033
- Figure 3: North America Crude Oil Carriers Industry Revenue (million), by Size 2025 & 2033
- Figure 4: North America Crude Oil Carriers Industry Volume (metric tonnes), by Size 2025 & 2033
- Figure 5: North America Crude Oil Carriers Industry Revenue Share (%), by Size 2025 & 2033
- Figure 6: North America Crude Oil Carriers Industry Volume Share (%), by Size 2025 & 2033
- Figure 7: North America Crude Oil Carriers Industry Revenue (million), by Country 2025 & 2033
- Figure 8: North America Crude Oil Carriers Industry Volume (metric tonnes), by Country 2025 & 2033
- Figure 9: North America Crude Oil Carriers Industry Revenue Share (%), by Country 2025 & 2033
- Figure 10: North America Crude Oil Carriers Industry Volume Share (%), by Country 2025 & 2033
- Figure 11: Europe Crude Oil Carriers Industry Revenue (million), by Size 2025 & 2033
- Figure 12: Europe Crude Oil Carriers Industry Volume (metric tonnes), by Size 2025 & 2033
- Figure 13: Europe Crude Oil Carriers Industry Revenue Share (%), by Size 2025 & 2033
- Figure 14: Europe Crude Oil Carriers Industry Volume Share (%), by Size 2025 & 2033
- Figure 15: Europe Crude Oil Carriers Industry Revenue (million), by Country 2025 & 2033
- Figure 16: Europe Crude Oil Carriers Industry Volume (metric tonnes), by Country 2025 & 2033
- Figure 17: Europe Crude Oil Carriers Industry Revenue Share (%), by Country 2025 & 2033
- Figure 18: Europe Crude Oil Carriers Industry Volume Share (%), by Country 2025 & 2033
- Figure 19: Asia Pacific Crude Oil Carriers Industry Revenue (million), by Size 2025 & 2033
- Figure 20: Asia Pacific Crude Oil Carriers Industry Volume (metric tonnes), by Size 2025 & 2033
- Figure 21: Asia Pacific Crude Oil Carriers Industry Revenue Share (%), by Size 2025 & 2033
- Figure 22: Asia Pacific Crude Oil Carriers Industry Volume Share (%), by Size 2025 & 2033
- Figure 23: Asia Pacific Crude Oil Carriers Industry Revenue (million), by Country 2025 & 2033
- Figure 24: Asia Pacific Crude Oil Carriers Industry Volume (metric tonnes), by Country 2025 & 2033
- Figure 25: Asia Pacific Crude Oil Carriers Industry Revenue Share (%), by Country 2025 & 2033
- Figure 26: Asia Pacific Crude Oil Carriers Industry Volume Share (%), by Country 2025 & 2033
- Figure 27: South America Crude Oil Carriers Industry Revenue (million), by Size 2025 & 2033
- Figure 28: South America Crude Oil Carriers Industry Volume (metric tonnes), by Size 2025 & 2033
- Figure 29: South America Crude Oil Carriers Industry Revenue Share (%), by Size 2025 & 2033
- Figure 30: South America Crude Oil Carriers Industry Volume Share (%), by Size 2025 & 2033
- Figure 31: South America Crude Oil Carriers Industry Revenue (million), by Country 2025 & 2033
- Figure 32: South America Crude Oil Carriers Industry Volume (metric tonnes), by Country 2025 & 2033
- Figure 33: South America Crude Oil Carriers Industry Revenue Share (%), by Country 2025 & 2033
- Figure 34: South America Crude Oil Carriers Industry Volume Share (%), by Country 2025 & 2033
- Figure 35: Middle East Crude Oil Carriers Industry Revenue (million), by Size 2025 & 2033
- Figure 36: Middle East Crude Oil Carriers Industry Volume (metric tonnes), by Size 2025 & 2033
- Figure 37: Middle East Crude Oil Carriers Industry Revenue Share (%), by Size 2025 & 2033
- Figure 38: Middle East Crude Oil Carriers Industry Volume Share (%), by Size 2025 & 2033
- Figure 39: Middle East Crude Oil Carriers Industry Revenue (million), by Country 2025 & 2033
- Figure 40: Middle East Crude Oil Carriers Industry Volume (metric tonnes), by Country 2025 & 2033
- Figure 41: Middle East Crude Oil Carriers Industry Revenue Share (%), by Country 2025 & 2033
- Figure 42: Middle East Crude Oil Carriers Industry Volume Share (%), by Country 2025 & 2033
List of Tables
- Table 1: Global Crude Oil Carriers Industry Revenue million Forecast, by Size 2020 & 2033
- Table 2: Global Crude Oil Carriers Industry Volume metric tonnes Forecast, by Size 2020 & 2033
- Table 3: Global Crude Oil Carriers Industry Revenue million Forecast, by Region 2020 & 2033
- Table 4: Global Crude Oil Carriers Industry Volume metric tonnes Forecast, by Region 2020 & 2033
- Table 5: Global Crude Oil Carriers Industry Revenue million Forecast, by Size 2020 & 2033
- Table 6: Global Crude Oil Carriers Industry Volume metric tonnes Forecast, by Size 2020 & 2033
- Table 7: Global Crude Oil Carriers Industry Revenue million Forecast, by Country 2020 & 2033
- Table 8: Global Crude Oil Carriers Industry Volume metric tonnes Forecast, by Country 2020 & 2033
- Table 9: Global Crude Oil Carriers Industry Revenue million Forecast, by Size 2020 & 2033
- Table 10: Global Crude Oil Carriers Industry Volume metric tonnes Forecast, by Size 2020 & 2033
- Table 11: Global Crude Oil Carriers Industry Revenue million Forecast, by Country 2020 & 2033
- Table 12: Global Crude Oil Carriers Industry Volume metric tonnes Forecast, by Country 2020 & 2033
- Table 13: Global Crude Oil Carriers Industry Revenue million Forecast, by Size 2020 & 2033
- Table 14: Global Crude Oil Carriers Industry Volume metric tonnes Forecast, by Size 2020 & 2033
- Table 15: Global Crude Oil Carriers Industry Revenue million Forecast, by Country 2020 & 2033
- Table 16: Global Crude Oil Carriers Industry Volume metric tonnes Forecast, by Country 2020 & 2033
- Table 17: Global Crude Oil Carriers Industry Revenue million Forecast, by Size 2020 & 2033
- Table 18: Global Crude Oil Carriers Industry Volume metric tonnes Forecast, by Size 2020 & 2033
- Table 19: Global Crude Oil Carriers Industry Revenue million Forecast, by Country 2020 & 2033
- Table 20: Global Crude Oil Carriers Industry Volume metric tonnes Forecast, by Country 2020 & 2033
- Table 21: Global Crude Oil Carriers Industry Revenue million Forecast, by Size 2020 & 2033
- Table 22: Global Crude Oil Carriers Industry Volume metric tonnes Forecast, by Size 2020 & 2033
- Table 23: Global Crude Oil Carriers Industry Revenue million Forecast, by Country 2020 & 2033
- Table 24: Global Crude Oil Carriers Industry Volume metric tonnes Forecast, by Country 2020 & 2033
Frequently Asked Questions
1. What is the projected Compound Annual Growth Rate (CAGR) of the Crude Oil Carriers Industry?
The projected CAGR is approximately 4.6%.
2. Which companies are prominent players in the Crude Oil Carriers Industry?
Key companies in the market include National Iranian Oil Company (NIOC), Minerva Marine Inc, Teekay Corporation, China Cosco Shipping Corporation Limited, Tsakos Energy N/SH, China Merchants Group Ltd, Euronav NV, Petroliam Nasional Berhad (PETRONAS)*List Not Exhaustive, The National Shipping Co Saudi Arabia, Angelicoussis Shipping Group Ltd.
3. What are the main segments of the Crude Oil Carriers Industry?
The market segments include Size.
4. Can you provide details about the market size?
The market size is estimated to be USD 225142.8 million as of 2022.
5. What are some drivers contributing to market growth?
Increasing Electricity Demand; Rising Investments in the Coal Industry.
6. What are the notable trends driving market growth?
Very Large Crude Carrier to Dominate the Market.
7. Are there any restraints impacting market growth?
Increasing Installation of Renewable Energy Sources.
8. Can you provide examples of recent developments in the market?
N/A
9. What pricing options are available for accessing the report?
Pricing options include single-user, multi-user, and enterprise licenses priced at USD 4750, USD 5250, and USD 8750 respectively.
10. Is the market size provided in terms of value or volume?
The market size is provided in terms of value, measured in million and volume, measured in metric tonnes.
11. Are there any specific market keywords associated with the report?
Yes, the market keyword associated with the report is "Crude Oil Carriers Industry," which aids in identifying and referencing the specific market segment covered.
12. How do I determine which pricing option suits my needs best?
The pricing options vary based on user requirements and access needs. Individual users may opt for single-user licenses, while businesses requiring broader access may choose multi-user or enterprise licenses for cost-effective access to the report.
13. Are there any additional resources or data provided in the Crude Oil Carriers Industry report?
While the report offers comprehensive insights, it's advisable to review the specific contents or supplementary materials provided to ascertain if additional resources or data are available.
14. How can I stay updated on further developments or reports in the Crude Oil Carriers Industry?
To stay informed about further developments, trends, and reports in the Crude Oil Carriers Industry, consider subscribing to industry newsletters, following relevant companies and organizations, or regularly checking reputable industry news sources and publications.
Methodology
Step 1 - Identification of Relevant Samples Size from Population Database


Step 2 - Approaches for Defining Global Market Size (Value, Volume* & Price*)

Note*: In applicable scenarios
Step 3 - Data Sources
Primary Research
- Web Analytics
- Survey Reports
- Research Institute
- Latest Research Reports
- Opinion Leaders
Secondary Research
- Annual Reports
- White Paper
- Latest Press Release
- Industry Association
- Paid Database
- Investor Presentations

Step 4 - Data Triangulation
Involves using different sources of information in order to increase the validity of a study
These sources are likely to be stakeholders in a program - participants, other researchers, program staff, other community members, and so on.
Then we put all data in single framework & apply various statistical tools to find out the dynamic on the market.
During the analysis stage, feedback from the stakeholder groups would be compared to determine areas of agreement as well as areas of divergence