

Key Insights
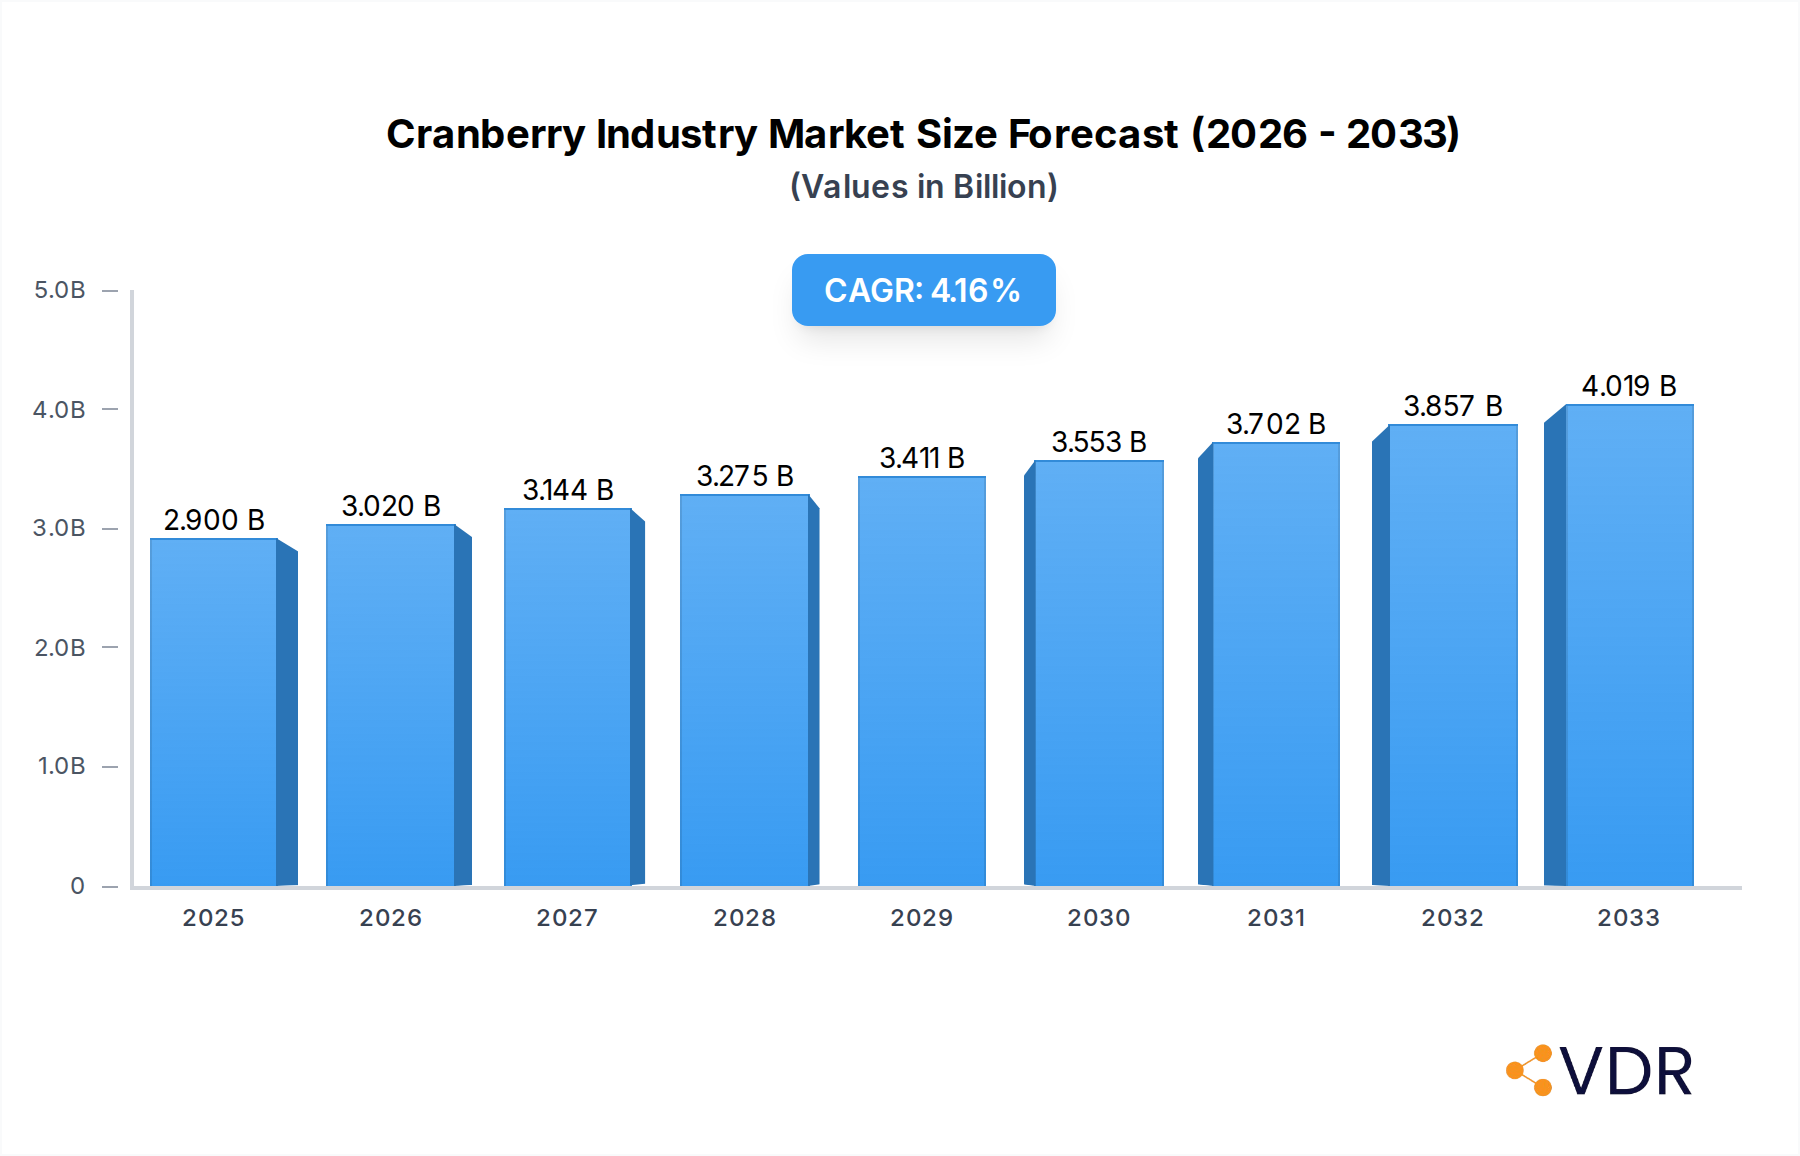
The global Cranberry Industry is poised for significant growth, projecting a market size of USD 2.9 billion in 2025, with an anticipated Compound Annual Growth Rate (CAGR) of 4.2%. This expansion is propelled by a confluence of robust drivers, including the increasing consumer demand for antioxidant-rich superfoods and the growing popularity of cranberry-based beverages and dietary supplements. The inherent health benefits associated with cranberries, such as their contribution to urinary tract health and immune system support, are a primary catalyst for this upward trajectory. Furthermore, ongoing innovations in product development, leading to a wider array of cranberry-infused food and beverage options, are broadening the consumer base and driving market penetration across diverse demographics. The industry is witnessing a surge in demand for natural and functional ingredients, with cranberries perfectly aligning with these consumer preferences.

Cranberry Industry Market Size (In Billion)
However, the industry is not without its challenges. Restraints such as the seasonal nature of cranberry cultivation, susceptibility to adverse weather conditions, and the relatively higher cost compared to some other fruit alternatives can impact consistent supply and price stability. Despite these hurdles, the market is actively pursuing strategies to mitigate these issues. Innovations in cultivation techniques, improved storage and processing technologies, and diversification of product formats are helping to address supply chain complexities. Key trends shaping the market include the rise of organic and sustainably sourced cranberries, a growing interest in cranberry extracts for cosmetic applications, and an expansion of the market into emerging economies. Leading players like Ocean Spray Cranberries, Inc., Northland Cranberries, Inc., and regional cooperatives are strategically investing in research and development, capacity expansion, and market outreach to capitalize on these evolving dynamics and secure their market positions within the forecast period of 2025-2033.
Cranberry Industry Company Market Share
Cranberry Industry Market Dynamics & Structure
The global cranberry market is characterized by a moderately concentrated structure, with key players like Ocean Spray Cranberries, Inc. and Northland Cranberries, Inc. holding significant sway. Technological innovation, particularly in areas of functional food and beverage applications, is a major driver, alongside growing consumer awareness of cranberry's health benefits. Regulatory frameworks primarily focus on food safety and labeling, with organic certifications gaining traction. Competitive product substitutes include other berries and vitamin supplements, but cranberry's unique nutrient profile and versatility offer a distinct advantage. End-user demographics are expanding beyond traditional markets to include health-conscious consumers of all ages. Mergers and acquisitions (M&A) are present, though less frequent, as companies seek to consolidate market share and expand product portfolios.
- Market Concentration: Dominated by a few large cooperatives and privately held companies.
- Technological Innovation: Focus on AI-driven research for efficacy validation and new ingredient discovery.
- Regulatory Frameworks: Emphasis on food safety standards and health claims substantiation.
- Product Substitutes: Competition from other superfruits and dietary supplements.
- End-User Demographics: Broadening appeal to health-conscious and wellness-oriented consumers.
- M&A Trends: Strategic alliances and partnerships are more prevalent than outright acquisitions.
Cranberry Industry Growth Trends & Insights
The cranberry industry is poised for robust growth, driven by an escalating market size and increasing adoption rates across diverse applications. The market is projected to witness a Compound Annual Growth Rate (CAGR) of approximately 4.5% from 2025 to 2033, signifying a substantial expansion from its estimated market size of $3.2 billion in 2025. This growth trajectory is significantly influenced by technological disruptions, particularly in the realm of AI-powered research and development, which is unlocking new health benefits and applications for cranberries. Consumer behavior shifts are a pivotal factor, with a pronounced move towards natural, functional, and health-promoting foods and beverages. This trend fuels the demand for cranberry products beyond traditional juices, encompassing supplements, dried cranberries, and functional food ingredients. The market penetration of cranberry-based health products is expected to rise as scientific validation of its benefits strengthens, further solidifying its position as a superfruit. The historical period (2019–2024) laid the groundwork for this expansion, with steady demand and growing interest in functional ingredients. The estimated year of 2025 marks a significant point where these trends are expected to accelerate, with the forecast period (2025–2033) showing sustained upward momentum.
- Market Size Evolution: Projected to grow from an estimated $3.2 billion in 2025 to over $4.5 billion by 2033.
- Adoption Rates: Increasing adoption in functional foods, dietary supplements, and novel beverage formulations.
- Technological Disruptions: AI and biotech are accelerating the discovery and validation of cranberry's health properties.
- Consumer Behavior Shifts: Growing preference for natural, functional, and health-beneficial ingredients.
- CAGR: Estimated at 4.5% for the forecast period 2025–2033.
- Market Penetration: Expanding beyond traditional markets into niche health and wellness segments.
Dominant Regions, Countries, or Segments in Cranberry Industry
The United States stands as the dominant region and country in the global cranberry industry, particularly in Production Analysis and Consumption Analysis. Its extensive agricultural infrastructure, favorable climate conditions in key growing areas like Wisconsin and Massachusetts, and established consumer demand solidify its leading position. The North American market as a whole, encompassing both the US and Canada, accounts for a significant share of global cranberry production, estimated to be around 70-75% of the total volume.
- Production Analysis: The US leads with substantial output, driven by large-scale growers and cooperatives like Wisconsin Cranberry Cooperative and Ocean Spray Cranberries, Inc.
- Consumption Analysis: High per capita consumption in the US, attributed to a strong tradition of cranberry use in beverages, sauces, and baked goods, and a growing interest in health benefits.
- Import Market Analysis (Value & Volume): While the US is a major producer, it also imports certain cranberry products to meet specific market demands, valued at approximately $0.3 billion and 50 million kilograms in 2025.
- Export Market Analysis (Value & Volume): The US is also a significant exporter, particularly of processed cranberry products, with export values estimated at $0.6 billion and 100 million kilograms in 2025. Canada is another key exporter, with estimated export values of $0.15 billion and 30 million kilograms in 2025.
- Price Trend Analysis: Prices are influenced by supply and demand dynamics, weather patterns, and production costs. Stable pricing is expected in 2025, with an estimated average of $1.80 per kilogram for fresh cranberries.
Key drivers for US dominance include:
- Economic Policies: Government support for agriculture and trade agreements facilitating exports.
- Infrastructure: Advanced irrigation systems, processing facilities, and efficient distribution networks.
- Market Share: US companies hold a substantial global market share in processed cranberry products.
- Growth Potential: Continued innovation in product development and expanding export markets.
Cranberry Industry Product Landscape
The cranberry industry is witnessing a surge in product innovation, moving beyond traditional juices and sauces to embrace a wider array of functional food and beverage applications. Innovations include cranberry seed oil, lauded for its antioxidant and moisturizing properties in cosmetics, and cranberry extract powders, incorporated into dietary supplements and functional beverages for urinary tract health and immune support. Performance metrics highlight the rich antioxidant profile of cranberries, with high levels of proanthocyanidins (PACs). Unique selling propositions revolve around their natural origin and scientifically validated health benefits, attracting a growing segment of health-conscious consumers. Technological advancements in extraction and encapsulation are enhancing the bioavailability and efficacy of cranberry compounds, further expanding its market appeal.
Key Drivers, Barriers & Challenges in Cranberry Industry
Key Drivers:
- Growing Health and Wellness Trends: Increased consumer demand for natural, functional foods and beverages with proven health benefits.
- Scientific Validation: Ongoing research and development confirming cranberry's efficacy in areas like urinary tract health, antioxidant support, and cardiovascular wellness.
- Versatility in Applications: Expanding use in juices, dried fruits, supplements, cosmetics, and as a flavor enhancer in various food products.
- Technological Advancements: Innovations in cultivation, processing, and extraction technologies improving product quality and expanding applications.
Barriers & Challenges:
- Seasonal Availability and Perishability: Cranberries are a seasonal crop, posing challenges for year-round supply and requiring efficient preservation methods.
- Price Volatility: Production yields can be affected by weather conditions, leading to fluctuations in cranberry prices.
- Competition from Other Superfruits: A crowded market of superfruits with similar perceived health benefits.
- Consumer Perception of Tartness: The inherent tartness of cranberries can limit direct consumption for some consumers, necessitating processing into sweeter products.
- Supply Chain Disruptions: Vulnerability to extreme weather events and global logistics challenges impacting raw material availability and distribution.
Emerging Opportunities in Cranberry Industry
Emerging opportunities in the cranberry industry lie in the burgeoning functional beverage market, where cranberry extracts and concentrates can be leveraged for their health benefits and unique flavor profiles. The nutraceutical sector presents significant potential, with a growing demand for natural supplements targeting specific health concerns, such as immune support and cognitive function. Furthermore, advancements in cosmeceuticals are unlocking the potential of cranberry seed oil and extracts for skincare applications due to their antioxidant and anti-inflammatory properties. Untapped markets in developing economies with rising disposable incomes and increasing health consciousness also offer significant growth avenues.
Growth Accelerators in the Cranberry Industry Industry
Several catalysts are propelling the long-term growth of the cranberry industry. Strategic partnerships between agricultural cooperatives and technology firms, such as Ocean Spray's collaborations with Canomiks and Brightseed, are accelerating the discovery and validation of cranberry's health benefits. Market expansion strategies targeting emerging economies and exploring novel product categories, like plant-based foods and beverages, are crucial growth accelerators. Continuous technological breakthroughs in areas such as precision agriculture and advanced extraction techniques will enhance production efficiency and product innovation, further solidifying the industry's upward trajectory.
Key Players Shaping the Cranberry Industry Market
- Ocean Spray Cranberries, Inc.
- Northland Cranberries, Inc.
- Cape Cod Cranberry Growers' Association
- Canadian Cranberry Growers Association
- Wisconsin Cranberry Cooperative
Notable Milestones in Cranberry Industry Sector
- March 2022: Ocean Spray Cranberries, Inc. and Canomiks announced research leveraging Canomiks' A.I. based technology platform to test and certify the biological efficacy of the cranberry, further validating its superfruit status.
- November 2021: Ocean Spray Cranberries, Inc. announced a partnership agreement with Brightseed, an AI-driven bioscience company, to profile cranberry compounds and uncover new connections between cranberries and human health.
In-Depth Cranberry Industry Market Outlook
The cranberry industry is on a promising growth trajectory, significantly driven by increasing consumer demand for health-promoting and natural products. Strategic investments in AI-driven research and development are uncovering novel health applications, expanding market reach. The forecast period (2025–2033) indicates sustained growth, with market size projected to exceed $4.5 billion by 2033. Key opportunities lie in the expanding nutraceutical and functional beverage sectors, alongside potential in cosmeceuticals. Companies are actively pursuing market expansion and product diversification to capitalize on these trends, ensuring a vibrant and evolving cranberry industry.
Cranberry Industry Segmentation
- 1. Production Analysis
- 2. Consumption Analysis
- 3. Import Market Analysis (Value & Volume)
- 4. Export Market Analysis (Value & Volume)
- 5. Price Trend Analysis
Cranberry Industry Segmentation By Geography
-
1. North America
- 1.1. United States
-
2. Europe
- 2.1. Germany
-
3. Asia Pacific
- 3.1. China
-
4. South America
- 4.1. Chile
-
5. Africa
- 5.1. South Africa
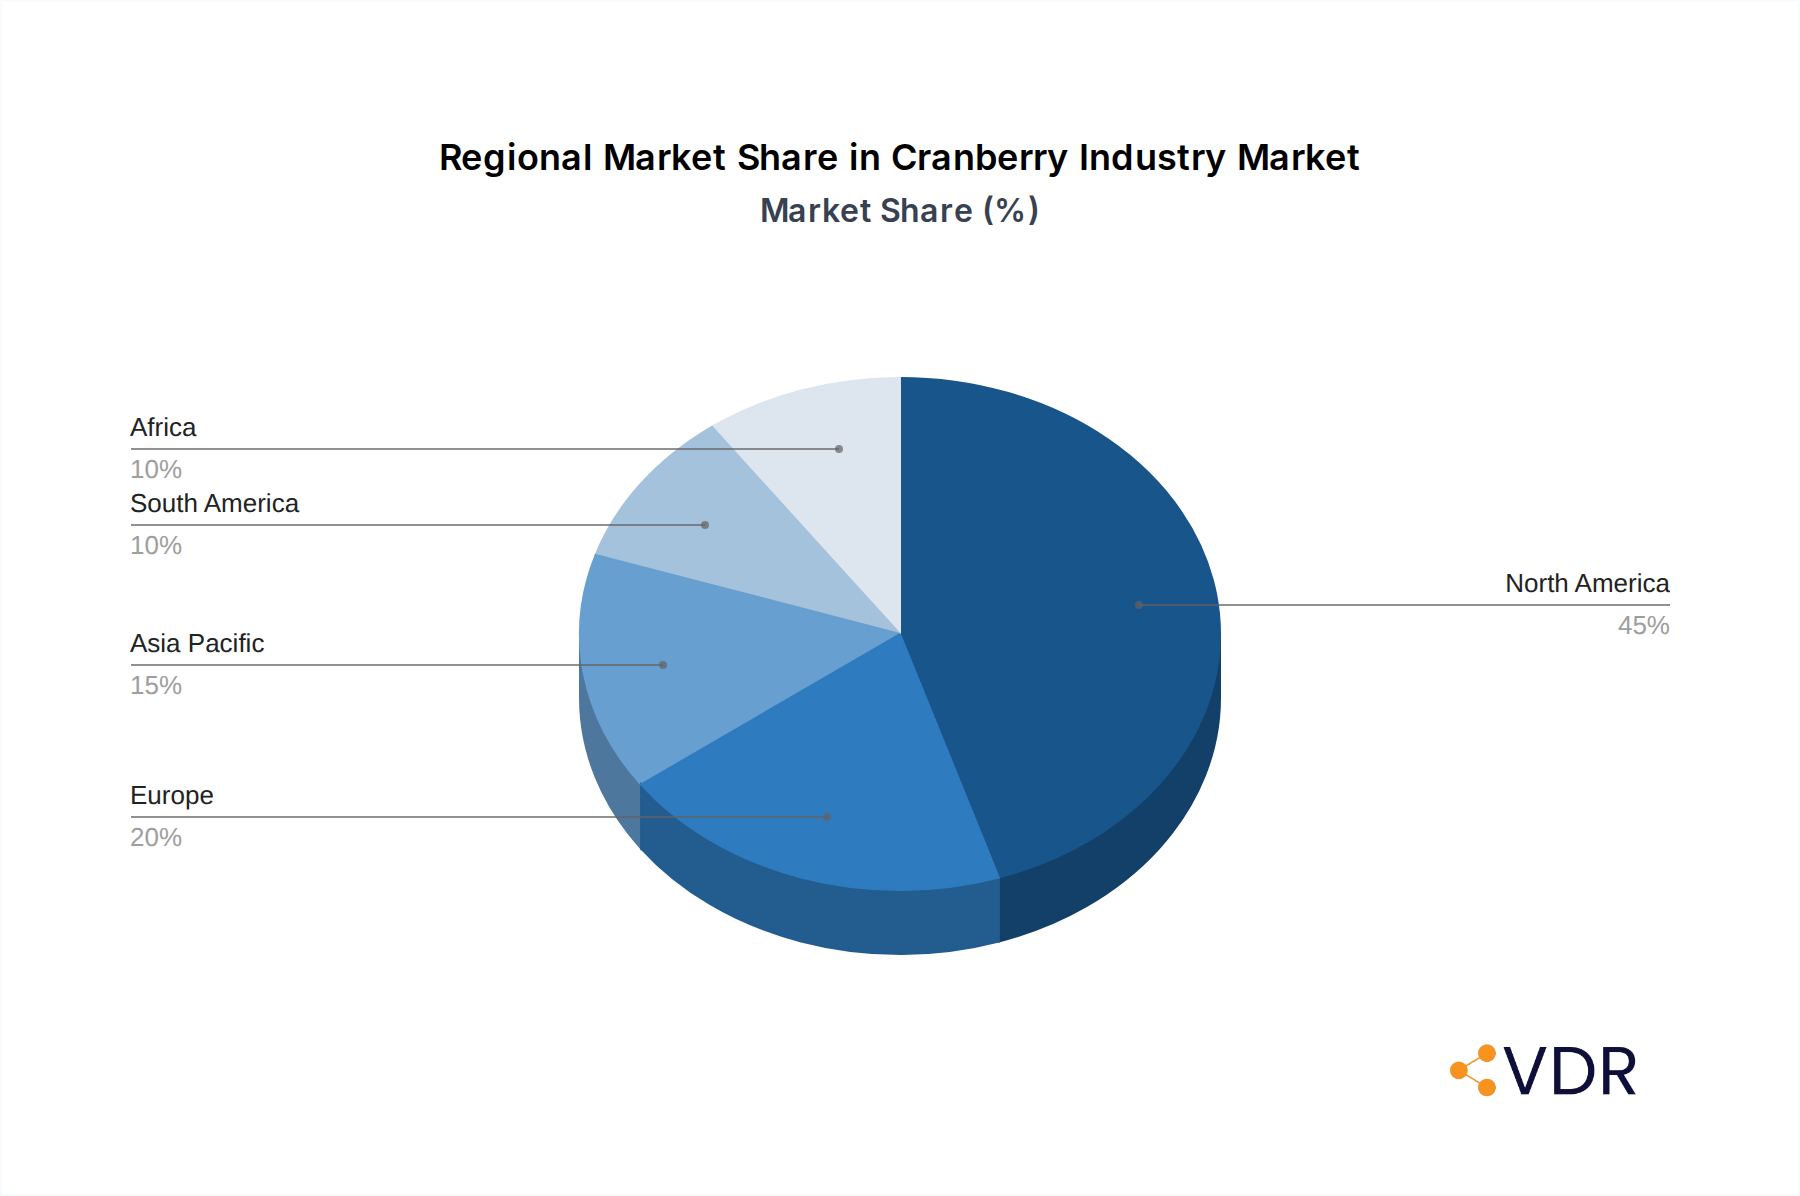
Cranberry Industry Regional Market Share
Geographic Coverage of Cranberry Industry
Cranberry Industry REPORT HIGHLIGHTS
| Aspects | Details |
|---|---|
| Study Period | 2020-2034 |
| Base Year | 2025 |
| Estimated Year | 2026 |
| Forecast Period | 2026-2034 |
| Historical Period | 2020-2025 |
| Growth Rate | CAGR of 4.2% from 2020-2034 |
| Segmentation |
|
Table of Contents
- 1. Introduction
- 1.1. Research Scope
- 1.2. Market Segmentation
- 1.3. Research Objective
- 1.4. Definitions and Assumptions
- 2. Executive Summary
- 2.1. Market Snapshot
- 3. Market Dynamics
- 3.1. Market Drivers
- 3.2. Market Restrains
- 3.3. Market Trends
- 3.4. Market Opportunities
- 4. Market Factor Analysis
- 4.1. Porters Five Forces
- 4.1.1. Bargaining Power of Suppliers
- 4.1.2. Bargaining Power of Buyers
- 4.1.3. Threat of New Entrants
- 4.1.4. Threat of Substitutes
- 4.1.5. Competitive Rivalry
- 4.2. PESTEL analysis
- 4.3. BCG Analysis
- 4.3.1. Stars (High Growth, High Market Share)
- 4.3.2. Cash Cows (Low Growth, High Market Share)
- 4.3.3. Question Mark (High Growth, Low Market Share)
- 4.3.4. Dogs (Low Growth, Low Market Share)
- 4.4. Ansoff Matrix Analysis
- 4.5. Supply Chain Analysis
- 4.6. Regulatory Landscape
- 4.7. Current Market Potential and Opportunity Assessment (TAM–SAM–SOM Framework)
- 4.8. VDR Analyst Note
- 4.1. Porters Five Forces
- 5. Market Analysis, Insights and Forecast 2021-2033
- 5.1. Market Analysis, Insights and Forecast - by Production Analysis
- 5.2. Market Analysis, Insights and Forecast - by Consumption Analysis
- 5.3. Market Analysis, Insights and Forecast - by Import Market Analysis (Value & Volume)
- 5.4. Market Analysis, Insights and Forecast - by Export Market Analysis (Value & Volume)
- 5.5. Market Analysis, Insights and Forecast - by Price Trend Analysis
- 5.6. Market Analysis, Insights and Forecast - by Region
- 5.6.1. North America
- 5.6.2. Europe
- 5.6.3. Asia Pacific
- 5.6.4. South America
- 5.6.5. Africa
- 6. Global Cranberry Industry Analysis, Insights and Forecast, 2021-2033
- 6.1. Market Analysis, Insights and Forecast - by Production Analysis
- 6.2. Market Analysis, Insights and Forecast - by Consumption Analysis
- 6.3. Market Analysis, Insights and Forecast - by Import Market Analysis (Value & Volume)
- 6.4. Market Analysis, Insights and Forecast - by Export Market Analysis (Value & Volume)
- 6.5. Market Analysis, Insights and Forecast - by Price Trend Analysis
- 7. North America Cranberry Industry Analysis, Insights and Forecast, 2021-2033
- 7.1. Market Analysis, Insights and Forecast - by Production Analysis
- 7.2. Market Analysis, Insights and Forecast - by Consumption Analysis
- 7.3. Market Analysis, Insights and Forecast - by Import Market Analysis (Value & Volume)
- 7.4. Market Analysis, Insights and Forecast - by Export Market Analysis (Value & Volume)
- 7.5. Market Analysis, Insights and Forecast - by Price Trend Analysis
- 8. Europe Cranberry Industry Analysis, Insights and Forecast, 2021-2033
- 8.1. Market Analysis, Insights and Forecast - by Production Analysis
- 8.2. Market Analysis, Insights and Forecast - by Consumption Analysis
- 8.3. Market Analysis, Insights and Forecast - by Import Market Analysis (Value & Volume)
- 8.4. Market Analysis, Insights and Forecast - by Export Market Analysis (Value & Volume)
- 8.5. Market Analysis, Insights and Forecast - by Price Trend Analysis
- 9. Asia Pacific Cranberry Industry Analysis, Insights and Forecast, 2021-2033
- 9.1. Market Analysis, Insights and Forecast - by Production Analysis
- 9.2. Market Analysis, Insights and Forecast - by Consumption Analysis
- 9.3. Market Analysis, Insights and Forecast - by Import Market Analysis (Value & Volume)
- 9.4. Market Analysis, Insights and Forecast - by Export Market Analysis (Value & Volume)
- 9.5. Market Analysis, Insights and Forecast - by Price Trend Analysis
- 10. South America Cranberry Industry Analysis, Insights and Forecast, 2021-2033
- 10.1. Market Analysis, Insights and Forecast - by Production Analysis
- 10.2. Market Analysis, Insights and Forecast - by Consumption Analysis
- 10.3. Market Analysis, Insights and Forecast - by Import Market Analysis (Value & Volume)
- 10.4. Market Analysis, Insights and Forecast - by Export Market Analysis (Value & Volume)
- 10.5. Market Analysis, Insights and Forecast - by Price Trend Analysis
- 11. Africa Cranberry Industry Analysis, Insights and Forecast, 2021-2033
- 11.1. Market Analysis, Insights and Forecast - by Production Analysis
- 11.2. Market Analysis, Insights and Forecast - by Consumption Analysis
- 11.3. Market Analysis, Insights and Forecast - by Import Market Analysis (Value & Volume)
- 11.4. Market Analysis, Insights and Forecast - by Export Market Analysis (Value & Volume)
- 11.5. Market Analysis, Insights and Forecast - by Price Trend Analysis
- 12. Competitive Analysis
- 12.1. Company Profiles
- 12.1.1 Ocean Spray Cranberries Inc.
- 12.1.1.1. Company Overview
- 12.1.1.2. Products
- 12.1.1.3. Company Financials
- 12.1.1.4. SWOT Analysis
- 12.1.2 Northland Cranberries Inc.
- 12.1.2.1. Company Overview
- 12.1.2.2. Products
- 12.1.2.3. Company Financials
- 12.1.2.4. SWOT Analysis
- 12.1.3 Cape Cod Cranberry Growers' Association
- 12.1.3.1. Company Overview
- 12.1.3.2. Products
- 12.1.3.3. Company Financials
- 12.1.3.4. SWOT Analysis
- 12.1.4 Canadian Cranberry Growers Association
- 12.1.4.1. Company Overview
- 12.1.4.2. Products
- 12.1.4.3. Company Financials
- 12.1.4.4. SWOT Analysis
- 12.1.5 Wisconsin Cranberry Cooperative
- 12.1.5.1. Company Overview
- 12.1.5.2. Products
- 12.1.5.3. Company Financials
- 12.1.5.4. SWOT Analysis
- 12.1.1 Ocean Spray Cranberries Inc.
- 12.2. Market Entropy
- 12.2.1 Company's Key Areas Served
- 12.2.2 Recent Developments
- 12.3. Company Market Share Analysis 2025
- 12.3.1 Top 5 Companies Market Share Analysis
- 12.3.2 Top 3 Companies Market Share Analysis
- 12.4. List of Potential Customers
- 13. Research Methodology
List of Figures
- Figure 1: Global Cranberry Industry Revenue Breakdown (billion, %) by Region 2025 & 2033
- Figure 2: North America Cranberry Industry Revenue (billion), by Production Analysis 2025 & 2033
- Figure 3: North America Cranberry Industry Revenue Share (%), by Production Analysis 2025 & 2033
- Figure 4: North America Cranberry Industry Revenue (billion), by Consumption Analysis 2025 & 2033
- Figure 5: North America Cranberry Industry Revenue Share (%), by Consumption Analysis 2025 & 2033
- Figure 6: North America Cranberry Industry Revenue (billion), by Import Market Analysis (Value & Volume) 2025 & 2033
- Figure 7: North America Cranberry Industry Revenue Share (%), by Import Market Analysis (Value & Volume) 2025 & 2033
- Figure 8: North America Cranberry Industry Revenue (billion), by Export Market Analysis (Value & Volume) 2025 & 2033
- Figure 9: North America Cranberry Industry Revenue Share (%), by Export Market Analysis (Value & Volume) 2025 & 2033
- Figure 10: North America Cranberry Industry Revenue (billion), by Price Trend Analysis 2025 & 2033
- Figure 11: North America Cranberry Industry Revenue Share (%), by Price Trend Analysis 2025 & 2033
- Figure 12: North America Cranberry Industry Revenue (billion), by Country 2025 & 2033
- Figure 13: North America Cranberry Industry Revenue Share (%), by Country 2025 & 2033
- Figure 14: Europe Cranberry Industry Revenue (billion), by Production Analysis 2025 & 2033
- Figure 15: Europe Cranberry Industry Revenue Share (%), by Production Analysis 2025 & 2033
- Figure 16: Europe Cranberry Industry Revenue (billion), by Consumption Analysis 2025 & 2033
- Figure 17: Europe Cranberry Industry Revenue Share (%), by Consumption Analysis 2025 & 2033
- Figure 18: Europe Cranberry Industry Revenue (billion), by Import Market Analysis (Value & Volume) 2025 & 2033
- Figure 19: Europe Cranberry Industry Revenue Share (%), by Import Market Analysis (Value & Volume) 2025 & 2033
- Figure 20: Europe Cranberry Industry Revenue (billion), by Export Market Analysis (Value & Volume) 2025 & 2033
- Figure 21: Europe Cranberry Industry Revenue Share (%), by Export Market Analysis (Value & Volume) 2025 & 2033
- Figure 22: Europe Cranberry Industry Revenue (billion), by Price Trend Analysis 2025 & 2033
- Figure 23: Europe Cranberry Industry Revenue Share (%), by Price Trend Analysis 2025 & 2033
- Figure 24: Europe Cranberry Industry Revenue (billion), by Country 2025 & 2033
- Figure 25: Europe Cranberry Industry Revenue Share (%), by Country 2025 & 2033
- Figure 26: Asia Pacific Cranberry Industry Revenue (billion), by Production Analysis 2025 & 2033
- Figure 27: Asia Pacific Cranberry Industry Revenue Share (%), by Production Analysis 2025 & 2033
- Figure 28: Asia Pacific Cranberry Industry Revenue (billion), by Consumption Analysis 2025 & 2033
- Figure 29: Asia Pacific Cranberry Industry Revenue Share (%), by Consumption Analysis 2025 & 2033
- Figure 30: Asia Pacific Cranberry Industry Revenue (billion), by Import Market Analysis (Value & Volume) 2025 & 2033
- Figure 31: Asia Pacific Cranberry Industry Revenue Share (%), by Import Market Analysis (Value & Volume) 2025 & 2033
- Figure 32: Asia Pacific Cranberry Industry Revenue (billion), by Export Market Analysis (Value & Volume) 2025 & 2033
- Figure 33: Asia Pacific Cranberry Industry Revenue Share (%), by Export Market Analysis (Value & Volume) 2025 & 2033
- Figure 34: Asia Pacific Cranberry Industry Revenue (billion), by Price Trend Analysis 2025 & 2033
- Figure 35: Asia Pacific Cranberry Industry Revenue Share (%), by Price Trend Analysis 2025 & 2033
- Figure 36: Asia Pacific Cranberry Industry Revenue (billion), by Country 2025 & 2033
- Figure 37: Asia Pacific Cranberry Industry Revenue Share (%), by Country 2025 & 2033
- Figure 38: South America Cranberry Industry Revenue (billion), by Production Analysis 2025 & 2033
- Figure 39: South America Cranberry Industry Revenue Share (%), by Production Analysis 2025 & 2033
- Figure 40: South America Cranberry Industry Revenue (billion), by Consumption Analysis 2025 & 2033
- Figure 41: South America Cranberry Industry Revenue Share (%), by Consumption Analysis 2025 & 2033
- Figure 42: South America Cranberry Industry Revenue (billion), by Import Market Analysis (Value & Volume) 2025 & 2033
- Figure 43: South America Cranberry Industry Revenue Share (%), by Import Market Analysis (Value & Volume) 2025 & 2033
- Figure 44: South America Cranberry Industry Revenue (billion), by Export Market Analysis (Value & Volume) 2025 & 2033
- Figure 45: South America Cranberry Industry Revenue Share (%), by Export Market Analysis (Value & Volume) 2025 & 2033
- Figure 46: South America Cranberry Industry Revenue (billion), by Price Trend Analysis 2025 & 2033
- Figure 47: South America Cranberry Industry Revenue Share (%), by Price Trend Analysis 2025 & 2033
- Figure 48: South America Cranberry Industry Revenue (billion), by Country 2025 & 2033
- Figure 49: South America Cranberry Industry Revenue Share (%), by Country 2025 & 2033
- Figure 50: Africa Cranberry Industry Revenue (billion), by Production Analysis 2025 & 2033
- Figure 51: Africa Cranberry Industry Revenue Share (%), by Production Analysis 2025 & 2033
- Figure 52: Africa Cranberry Industry Revenue (billion), by Consumption Analysis 2025 & 2033
- Figure 53: Africa Cranberry Industry Revenue Share (%), by Consumption Analysis 2025 & 2033
- Figure 54: Africa Cranberry Industry Revenue (billion), by Import Market Analysis (Value & Volume) 2025 & 2033
- Figure 55: Africa Cranberry Industry Revenue Share (%), by Import Market Analysis (Value & Volume) 2025 & 2033
- Figure 56: Africa Cranberry Industry Revenue (billion), by Export Market Analysis (Value & Volume) 2025 & 2033
- Figure 57: Africa Cranberry Industry Revenue Share (%), by Export Market Analysis (Value & Volume) 2025 & 2033
- Figure 58: Africa Cranberry Industry Revenue (billion), by Price Trend Analysis 2025 & 2033
- Figure 59: Africa Cranberry Industry Revenue Share (%), by Price Trend Analysis 2025 & 2033
- Figure 60: Africa Cranberry Industry Revenue (billion), by Country 2025 & 2033
- Figure 61: Africa Cranberry Industry Revenue Share (%), by Country 2025 & 2033
List of Tables
- Table 1: Global Cranberry Industry Revenue billion Forecast, by Production Analysis 2020 & 2033
- Table 2: Global Cranberry Industry Revenue billion Forecast, by Consumption Analysis 2020 & 2033
- Table 3: Global Cranberry Industry Revenue billion Forecast, by Import Market Analysis (Value & Volume) 2020 & 2033
- Table 4: Global Cranberry Industry Revenue billion Forecast, by Export Market Analysis (Value & Volume) 2020 & 2033
- Table 5: Global Cranberry Industry Revenue billion Forecast, by Price Trend Analysis 2020 & 2033
- Table 6: Global Cranberry Industry Revenue billion Forecast, by Region 2020 & 2033
- Table 7: Global Cranberry Industry Revenue billion Forecast, by Production Analysis 2020 & 2033
- Table 8: Global Cranberry Industry Revenue billion Forecast, by Consumption Analysis 2020 & 2033
- Table 9: Global Cranberry Industry Revenue billion Forecast, by Import Market Analysis (Value & Volume) 2020 & 2033
- Table 10: Global Cranberry Industry Revenue billion Forecast, by Export Market Analysis (Value & Volume) 2020 & 2033
- Table 11: Global Cranberry Industry Revenue billion Forecast, by Price Trend Analysis 2020 & 2033
- Table 12: Global Cranberry Industry Revenue billion Forecast, by Country 2020 & 2033
- Table 13: United States Cranberry Industry Revenue (billion) Forecast, by Application 2020 & 2033
- Table 14: Global Cranberry Industry Revenue billion Forecast, by Production Analysis 2020 & 2033
- Table 15: Global Cranberry Industry Revenue billion Forecast, by Consumption Analysis 2020 & 2033
- Table 16: Global Cranberry Industry Revenue billion Forecast, by Import Market Analysis (Value & Volume) 2020 & 2033
- Table 17: Global Cranberry Industry Revenue billion Forecast, by Export Market Analysis (Value & Volume) 2020 & 2033
- Table 18: Global Cranberry Industry Revenue billion Forecast, by Price Trend Analysis 2020 & 2033
- Table 19: Global Cranberry Industry Revenue billion Forecast, by Country 2020 & 2033
- Table 20: Germany Cranberry Industry Revenue (billion) Forecast, by Application 2020 & 2033
- Table 21: Global Cranberry Industry Revenue billion Forecast, by Production Analysis 2020 & 2033
- Table 22: Global Cranberry Industry Revenue billion Forecast, by Consumption Analysis 2020 & 2033
- Table 23: Global Cranberry Industry Revenue billion Forecast, by Import Market Analysis (Value & Volume) 2020 & 2033
- Table 24: Global Cranberry Industry Revenue billion Forecast, by Export Market Analysis (Value & Volume) 2020 & 2033
- Table 25: Global Cranberry Industry Revenue billion Forecast, by Price Trend Analysis 2020 & 2033
- Table 26: Global Cranberry Industry Revenue billion Forecast, by Country 2020 & 2033
- Table 27: China Cranberry Industry Revenue (billion) Forecast, by Application 2020 & 2033
- Table 28: Global Cranberry Industry Revenue billion Forecast, by Production Analysis 2020 & 2033
- Table 29: Global Cranberry Industry Revenue billion Forecast, by Consumption Analysis 2020 & 2033
- Table 30: Global Cranberry Industry Revenue billion Forecast, by Import Market Analysis (Value & Volume) 2020 & 2033
- Table 31: Global Cranberry Industry Revenue billion Forecast, by Export Market Analysis (Value & Volume) 2020 & 2033
- Table 32: Global Cranberry Industry Revenue billion Forecast, by Price Trend Analysis 2020 & 2033
- Table 33: Global Cranberry Industry Revenue billion Forecast, by Country 2020 & 2033
- Table 34: Chile Cranberry Industry Revenue (billion) Forecast, by Application 2020 & 2033
- Table 35: Global Cranberry Industry Revenue billion Forecast, by Production Analysis 2020 & 2033
- Table 36: Global Cranberry Industry Revenue billion Forecast, by Consumption Analysis 2020 & 2033
- Table 37: Global Cranberry Industry Revenue billion Forecast, by Import Market Analysis (Value & Volume) 2020 & 2033
- Table 38: Global Cranberry Industry Revenue billion Forecast, by Export Market Analysis (Value & Volume) 2020 & 2033
- Table 39: Global Cranberry Industry Revenue billion Forecast, by Price Trend Analysis 2020 & 2033
- Table 40: Global Cranberry Industry Revenue billion Forecast, by Country 2020 & 2033
- Table 41: South Africa Cranberry Industry Revenue (billion) Forecast, by Application 2020 & 2033
Frequently Asked Questions
1. What is the projected Compound Annual Growth Rate (CAGR) of the Cranberry Industry?
The projected CAGR is approximately 4.2%.
2. Which companies are prominent players in the Cranberry Industry?
Key companies in the market include Ocean Spray Cranberries, Inc. , Northland Cranberries, Inc. , Cape Cod Cranberry Growers' Association , Canadian Cranberry Growers Association, Wisconsin Cranberry Cooperative .
3. What are the main segments of the Cranberry Industry?
The market segments include Production Analysis, Consumption Analysis, Import Market Analysis (Value & Volume), Export Market Analysis (Value & Volume), Price Trend Analysis.
4. Can you provide details about the market size?
The market size is estimated to be USD 2.9 billion as of 2022.
5. What are some drivers contributing to market growth?
Rise in Percentage of Area Harvested Under Almond Cultivation; Demand for Healthy Snacking Options.
6. What are the notable trends driving market growth?
Increasing Demand from Processing Industry.
7. Are there any restraints impacting market growth?
Water Scarcity in Almond Producing Regions; Drop in the Prices of Almonds.
8. Can you provide examples of recent developments in the market?
March 2022: Ocean Spray Cranberries, Inc., the agricultural cooperative owned by more than 700 farmer families, and Canomiks, a startup technology company transforming the functional food and beverage industry, announced research leveraging Canomiks' A.I. based technology platform to test and certify the biological efficacy of the cranberry. The relationship with Canomiks, through Ocean Spray's existing partnership with the incubator Plug and Play, enables the company further to validate the superfruit nature of cranberry's biological efficacy.
9. What pricing options are available for accessing the report?
Pricing options include single-user, multi-user, and enterprise licenses priced at USD 4750, USD 5250, and USD 8750 respectively.
10. Is the market size provided in terms of value or volume?
The market size is provided in terms of value, measured in billion.
11. Are there any specific market keywords associated with the report?
Yes, the market keyword associated with the report is "Cranberry Industry," which aids in identifying and referencing the specific market segment covered.
12. How do I determine which pricing option suits my needs best?
The pricing options vary based on user requirements and access needs. Individual users may opt for single-user licenses, while businesses requiring broader access may choose multi-user or enterprise licenses for cost-effective access to the report.
13. Are there any additional resources or data provided in the Cranberry Industry report?
While the report offers comprehensive insights, it's advisable to review the specific contents or supplementary materials provided to ascertain if additional resources or data are available.
14. How can I stay updated on further developments or reports in the Cranberry Industry?
To stay informed about further developments, trends, and reports in the Cranberry Industry, consider subscribing to industry newsletters, following relevant companies and organizations, or regularly checking reputable industry news sources and publications.
Methodology
Step 1 - Identification of Relevant Samples Size from Population Database


Step 2 - Approaches for Defining Global Market Size (Value, Volume* & Price*)

Note*: In applicable scenarios
Step 3 - Data Sources
Primary Research
- Web Analytics
- Survey Reports
- Research Institute
- Latest Research Reports
- Opinion Leaders
Secondary Research
- Annual Reports
- White Paper
- Latest Press Release
- Industry Association
- Paid Database
- Investor Presentations

Step 4 - Data Triangulation
Involves using different sources of information in order to increase the validity of a study
These sources are likely to be stakeholders in a program - participants, other researchers, program staff, other community members, and so on.
Then we put all data in single framework & apply various statistical tools to find out the dynamic on the market.
During the analysis stage, feedback from the stakeholder groups would be compared to determine areas of agreement as well as areas of divergence