


Key Insights
The global Corneal Analyzer market is projected for substantial growth, expected to reach $8.32 billion by 2025, driven by a Compound Annual Growth Rate (CAGR) of 14.29%. This expansion is attributed to the rising incidence of eye conditions like keratoconus and corneal dystrophies, alongside increased adoption of advanced ophthalmological diagnostic technologies. Key growth factors include the demand for precise, early corneal abnormality detection, ongoing innovation in corneal imaging, and the growing focus on refractive surgery requiring accurate corneal data. An aging global population also contributes to a higher prevalence of age-related eye conditions, further stimulating market demand.
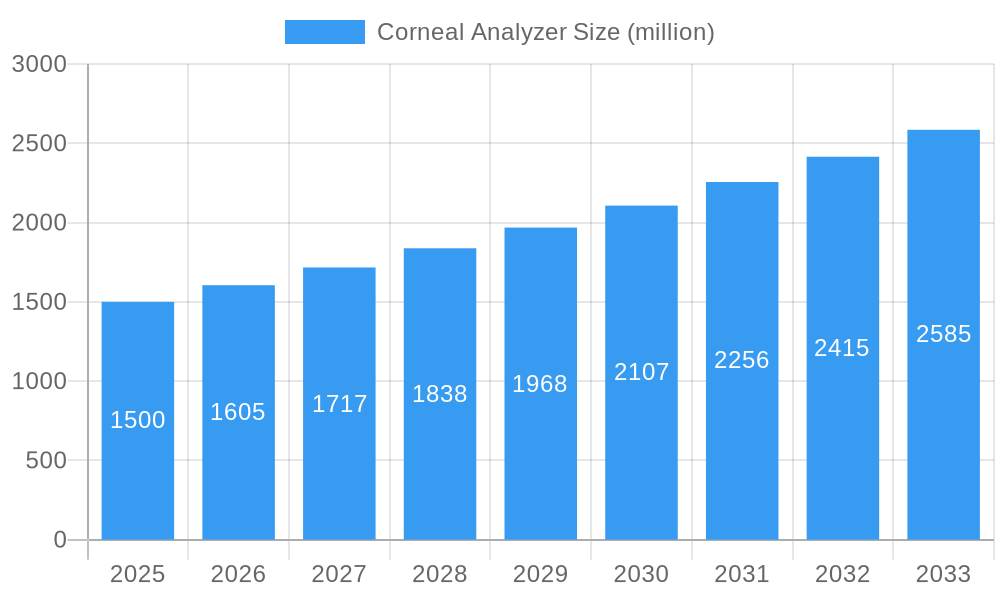
Corneal Analyzer Market Size (In Billion)

Market segmentation highlights distinct segments. Hospitals are anticipated to lead in market share due to extensive diagnostic facilities and patient volume. Specialized eye clinics are also critical, driven by increasing eye care specialization and demand for advanced outpatient diagnostics. Research institutions and specialized diagnostic centers form a significant "Others" segment. In terms of product type, portable handheld corneal analyzers are gaining popularity for their convenience, especially in remote or emergency situations. Nevertheless, bench-top analyzers are expected to maintain a strong market presence due to their superior precision and advanced analytical capabilities for complex diagnoses. Emerging trends like AI integration for automated analysis and non-invasive diagnostic methods will shape the market, while high initial investment costs and the need for skilled operators may present potential restraints.
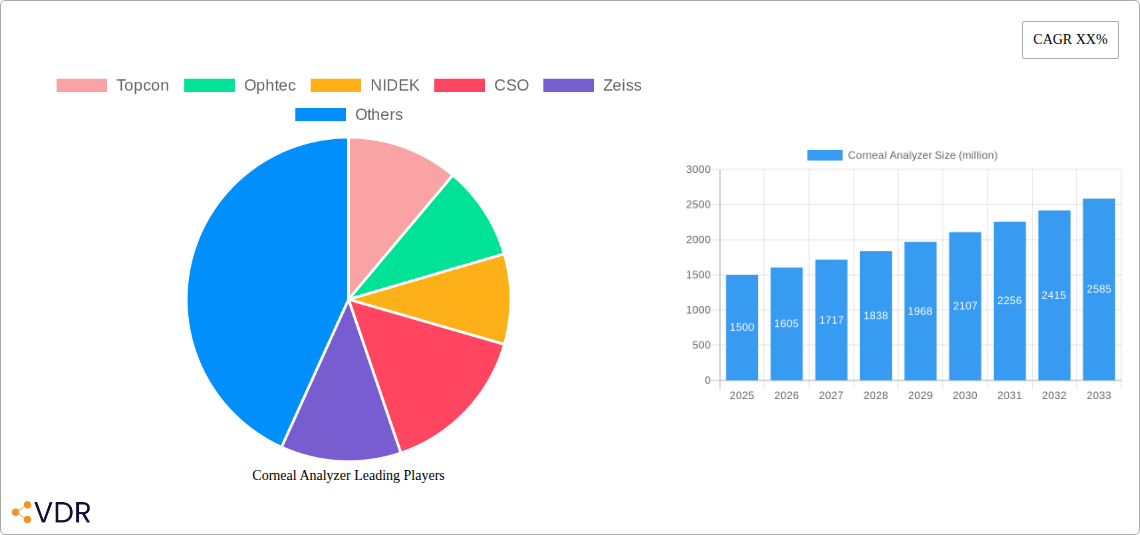
Corneal Analyzer Company Market Share
This comprehensive report offers a definitive analysis of the global Corneal Analyzer market, providing critical insights for stakeholders and industry professionals. Covering the period up to 2033, with a base year of 2025, this report meticulously examines market dynamics, growth trends, regional performance, product innovations, and key industry players.
Corneal Analyzer Market Dynamics & Structure
The global Corneal Analyzer market exhibits a moderate concentration, with key players like Topcon, Zeiss, and NIDEK dominating a significant portion of the market share. Technological innovation is a primary driver, fueled by advancements in imaging technologies, AI-driven diagnostics, and miniaturization for handheld devices. Regulatory frameworks, particularly stringent FDA and CE marking approvals, play a crucial role in shaping market entry and product development. Competitive product substitutes include traditional ophthalmic examination methods, though advanced corneal analyzers offer superior precision and diagnostic capabilities. End-user demographics are shifting towards an aging population with increasing prevalence of corneal diseases, alongside a growing demand for refractive surgery and personalized eye care. Mergers and Acquisitions (M&A) trends are observed as companies seek to expand their product portfolios and geographical reach, with an estimated XX M&A deals in the historical period (2019-2024). Innovation barriers include the high cost of R&D and the need for clinical validation.
- Market Concentration: Moderate, with top players holding an estimated 55% of the market.
- Technological Innovation Drivers: AI in diagnostics, advanced imaging resolution, non-contact measurement.
- Regulatory Frameworks: FDA approval, CE marking, regional specific certifications.
- Competitive Product Substitutes: Slit lamps, topography systems (though increasingly integrated).
- End-User Demographics: Aging population, post-refractive surgery patients, individuals with corneal conditions.
- M&A Trends: Focused on acquiring innovative technologies and expanding market access.
- Innovation Barriers: High R&D investment, lengthy clinical trials, reimbursement policies.
Corneal Analyzer Growth Trends & Insights
The global Corneal Analyzer market is poised for significant expansion, projected to reach approximately $2,200 million by 2025 and further escalate to $4,500 million by 2033. This growth is driven by an estimated Compound Annual Growth Rate (CAGR) of XX% during the forecast period. Adoption rates are steadily increasing across both developed and emerging economies, propelled by enhanced diagnostic accuracy and early detection of corneal abnormalities. Technological disruptions, such as the integration of artificial intelligence for automated analysis and predictive diagnostics, are revolutionizing clinical workflows and improving patient outcomes. Consumer behavior shifts are characterized by a growing preference for minimally invasive diagnostic procedures and a demand for personalized treatment plans based on precise corneal data. Market penetration is expected to rise from XX% in the base year to XX% by 2033, indicating a substantial increase in the adoption of corneal analysis technologies in routine ophthalmic care.
Dominant Regions, Countries, or Segments in Corneal Analyzer
North America currently leads the global Corneal Analyzer market, driven by advanced healthcare infrastructure, high disposable income, and a proactive approach to adopting cutting-edge medical technologies. The United States, in particular, contributes a substantial market share of approximately 35% due to the high prevalence of eye conditions, a robust research and development ecosystem, and favorable reimbursement policies for advanced diagnostic tools.
Key Drivers for North American Dominance:
- Economic Policies: Favorable government spending on healthcare and research grants.
- Infrastructure: Well-established network of hospitals and specialized eye clinics.
- Technological Adoption: High receptiveness to new medical devices and software integrations.
- Regulatory Environment: Clear pathways for product approval, though stringent.
- Awareness and Demand: Increasing patient awareness of eye health and demand for advanced diagnostics.
In terms of Application, Hospitals represent the largest segment, accounting for roughly 50% of the market revenue. This is attributed to the comprehensive diagnostic capabilities offered by corneal analyzers, crucial for managing complex eye conditions, pre- and post-operative care for surgeries like LASIK and cataract surgery, and the presence of specialized ophthalmology departments. Eye Clinics follow as a significant segment, contributing approximately 40%, as they increasingly invest in advanced diagnostic equipment to offer specialized corneal care and compete effectively. The "Others" segment, including academic research institutions and vision research centers, accounts for the remaining 10%.
Regarding Types, Bench-Top corneal analyzers, renowned for their high precision and comprehensive features, currently hold the dominant share, estimated at 65% of the market. However, Handheld corneal analyzers are witnessing rapid growth due to their portability, cost-effectiveness, and suitability for point-of-care diagnostics, particularly in remote areas or for patient bedside examinations. The handheld segment is projected to grow at a CAGR of XX% during the forecast period.
Corneal Analyzer Product Landscape
The Corneal Analyzer product landscape is characterized by continuous innovation, with manufacturers focusing on enhancing imaging resolution, improving speed of analysis, and incorporating advanced algorithms for disease detection. Key product innovations include multi-modal imaging capabilities, such as Scheimpflug imaging, optical coherence tomography (OCT), and Placido disc technology, integrated into single devices. Applications are expanding beyond standard refractive error assessment to include detailed corneal topography, pachymetry, keratometry, and anterior segment analysis for conditions like keratoconus, dry eye disease, and post-surgical complications. Performance metrics are being optimized for greater accuracy, reduced examination time, and improved patient comfort. Unique selling propositions often revolve around non-contact measurement, AI-powered diagnostics for earlier detection, and seamless integration with electronic medical records (EMRs).
Key Drivers, Barriers & Challenges in Corneal Analyzer
Key Drivers:
- Increasing prevalence of ophthalmic disorders: Growing incidence of conditions like dry eye, keratoconus, and post-surgical complications necessitates advanced diagnostic tools.
- Technological Advancements: Miniaturization of devices, integration of AI, and higher resolution imaging are enhancing diagnostic accuracy and efficiency.
- Growing demand for refractive surgeries: The rising popularity of LASIK and other refractive procedures drives the need for precise pre- and post-operative corneal analysis.
- Aging global population: An increasing elderly demographic is more susceptible to various eye diseases requiring detailed corneal assessment.
- Government initiatives and increasing healthcare expenditure: Supportive policies and rising healthcare investments in emerging economies boost market adoption.
Barriers & Challenges:
- High initial cost of advanced equipment: The significant investment required for cutting-edge corneal analyzers can be a deterrent for smaller clinics and in price-sensitive markets.
- Stringent regulatory approvals: Obtaining necessary certifications and approvals from health authorities can be a time-consuming and costly process.
- Lack of skilled personnel: A shortage of trained ophthalmologists and technicians proficient in operating and interpreting data from advanced corneal analyzers can hinder adoption.
- Reimbursement policies: Inconsistent or inadequate reimbursement policies for diagnostic procedures can impact the economic viability of adopting these technologies.
- Supply chain disruptions: Global events can impact the availability of components and finished products, leading to delays and increased costs.
Emerging Opportunities in Corneal Analyzer
Emerging opportunities lie in the development of portable, AI-enabled handheld corneal analyzers for remote diagnostics and telehealth applications, significantly expanding access to specialized eye care in underserved regions. The increasing focus on personalized medicine presents a significant avenue for growth, with the development of analyzers capable of generating highly individualized corneal profiles for precise treatment planning. Furthermore, the integration of corneal analyzers with advanced imaging techniques like confocal microscopy for in-vivo cellular analysis holds promise for early detection and management of a wider range of corneal pathologies. Growing demand for contact lens fitting and orthokeratology also presents a niche but expanding opportunity for advanced topographic analysis.
Growth Accelerators in the Corneal Analyzer Industry
Technological breakthroughs in artificial intelligence and machine learning are significant growth accelerators, enabling automated diagnosis, predictive analytics for disease progression, and personalized treatment recommendations. Strategic partnerships between device manufacturers and software developers are fostering the creation of integrated diagnostic platforms that enhance workflow efficiency and data management. Market expansion strategies, particularly in emerging economies with a growing middle class and increasing healthcare awareness, offer substantial growth potential. The development of cloud-based data storage and analysis solutions is also accelerating adoption by facilitating data sharing and remote consultations, thus improving accessibility and collaboration among healthcare professionals.
Key Players Shaping the Corneal Analyzer Market
- Topcon
- Ophtec
- NIDEK
- CSO
- Zeiss
- Essilor
- Bausch + Lomb
Notable Milestones in Corneal Analyzer Sector
- 2020: Launch of AI-powered diagnostic software for enhanced keratoconus detection.
- 2021: Introduction of a new generation of ultra-high resolution Scheimpflug imaging devices.
- 2022: Significant increase in M&A activity, with consolidation of smaller technology providers.
- 2023: Advancements in non-contact tonometry integrated with corneal analysis features.
- 2024: Increased focus on cloud-based data management and interoperability with EMR systems.
In-Depth Corneal Analyzer Market Outlook
The Corneal Analyzer market is set for robust and sustained growth, driven by a confluence of technological innovation, an expanding patient base with increasing eye health concerns, and the global push towards precision medicine. Growth accelerators such as AI integration, strategic collaborations, and expansion into emerging markets will continue to propel market penetration and revenue generation. The market's future potential lies in its ability to provide increasingly sophisticated, yet accessible, diagnostic solutions, ultimately contributing to improved patient outcomes and a more efficient ophthalmic healthcare ecosystem. Stakeholders are advised to focus on developing user-friendly interfaces, enhancing data analytics capabilities, and exploring novel applications to capitalize on future market opportunities.
Corneal Analyzer Segmentation
-
1. Application
- 1.1. Hospitals
- 1.2. Eye Clinics
- 1.3. Others
-
2. Types
- 2.1. Handheld
- 2.2. Bench-Top
Corneal Analyzer Segmentation By Geography
-
1. North America
- 1.1. United States
- 1.2. Canada
- 1.3. Mexico
-
2. South America
- 2.1. Brazil
- 2.2. Argentina
- 2.3. Rest of South America
-
3. Europe
- 3.1. United Kingdom
- 3.2. Germany
- 3.3. France
- 3.4. Italy
- 3.5. Spain
- 3.6. Russia
- 3.7. Benelux
- 3.8. Nordics
- 3.9. Rest of Europe
-
4. Middle East & Africa
- 4.1. Turkey
- 4.2. Israel
- 4.3. GCC
- 4.4. North Africa
- 4.5. South Africa
- 4.6. Rest of Middle East & Africa
-
5. Asia Pacific
- 5.1. China
- 5.2. India
- 5.3. Japan
- 5.4. South Korea
- 5.5. ASEAN
- 5.6. Oceania
- 5.7. Rest of Asia Pacific
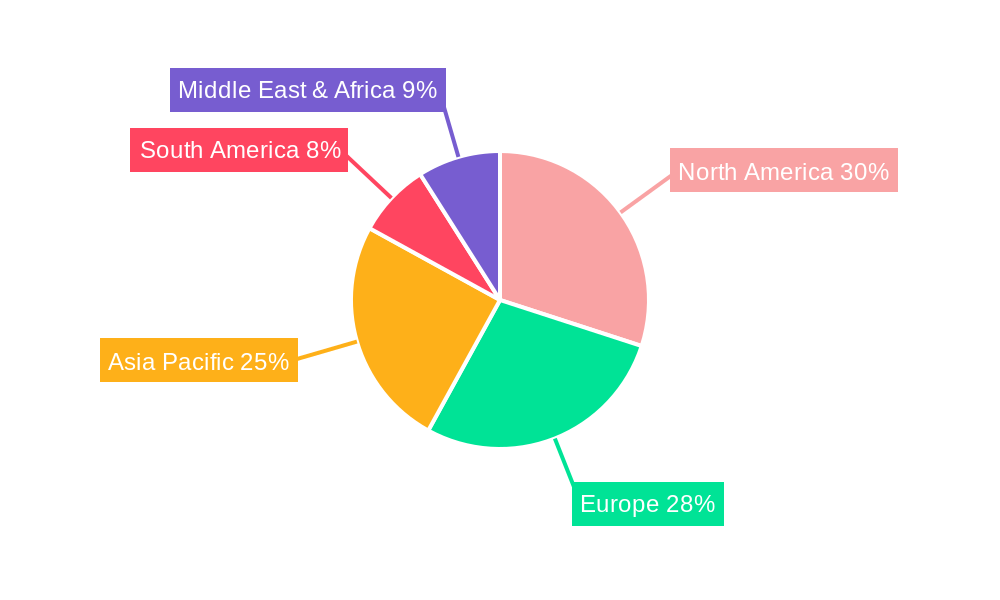
Corneal Analyzer Regional Market Share
Geographic Coverage of Corneal Analyzer
Corneal Analyzer REPORT HIGHLIGHTS
| Aspects | Details |
|---|---|
| Study Period | 2020-2034 |
| Base Year | 2025 |
| Estimated Year | 2026 |
| Forecast Period | 2026-2034 |
| Historical Period | 2020-2025 |
| Growth Rate | CAGR of 14.29% from 2020-2034 |
| Segmentation |
|
Table of Contents
- 1. Introduction
- 1.1. Research Scope
- 1.2. Market Segmentation
- 1.3. Research Methodology
- 1.4. Definitions and Assumptions
- 2. Executive Summary
- 2.1. Introduction
- 3. Market Dynamics
- 3.1. Introduction
- 3.2. Market Drivers
- 3.3. Market Restrains
- 3.4. Market Trends
- 4. Market Factor Analysis
- 4.1. Porters Five Forces
- 4.2. Supply/Value Chain
- 4.3. PESTEL analysis
- 4.4. Market Entropy
- 4.5. Patent/Trademark Analysis
- 5. Global Corneal Analyzer Analysis, Insights and Forecast, 2020-2032
- 5.1. Market Analysis, Insights and Forecast - by Application
- 5.1.1. Hospitals
- 5.1.2. Eye Clinics
- 5.1.3. Others
- 5.2. Market Analysis, Insights and Forecast - by Types
- 5.2.1. Handheld
- 5.2.2. Bench-Top
- 5.3. Market Analysis, Insights and Forecast - by Region
- 5.3.1. North America
- 5.3.2. South America
- 5.3.3. Europe
- 5.3.4. Middle East & Africa
- 5.3.5. Asia Pacific
- 5.1. Market Analysis, Insights and Forecast - by Application
- 6. North America Corneal Analyzer Analysis, Insights and Forecast, 2020-2032
- 6.1. Market Analysis, Insights and Forecast - by Application
- 6.1.1. Hospitals
- 6.1.2. Eye Clinics
- 6.1.3. Others
- 6.2. Market Analysis, Insights and Forecast - by Types
- 6.2.1. Handheld
- 6.2.2. Bench-Top
- 6.1. Market Analysis, Insights and Forecast - by Application
- 7. South America Corneal Analyzer Analysis, Insights and Forecast, 2020-2032
- 7.1. Market Analysis, Insights and Forecast - by Application
- 7.1.1. Hospitals
- 7.1.2. Eye Clinics
- 7.1.3. Others
- 7.2. Market Analysis, Insights and Forecast - by Types
- 7.2.1. Handheld
- 7.2.2. Bench-Top
- 7.1. Market Analysis, Insights and Forecast - by Application
- 8. Europe Corneal Analyzer Analysis, Insights and Forecast, 2020-2032
- 8.1. Market Analysis, Insights and Forecast - by Application
- 8.1.1. Hospitals
- 8.1.2. Eye Clinics
- 8.1.3. Others
- 8.2. Market Analysis, Insights and Forecast - by Types
- 8.2.1. Handheld
- 8.2.2. Bench-Top
- 8.1. Market Analysis, Insights and Forecast - by Application
- 9. Middle East & Africa Corneal Analyzer Analysis, Insights and Forecast, 2020-2032
- 9.1. Market Analysis, Insights and Forecast - by Application
- 9.1.1. Hospitals
- 9.1.2. Eye Clinics
- 9.1.3. Others
- 9.2. Market Analysis, Insights and Forecast - by Types
- 9.2.1. Handheld
- 9.2.2. Bench-Top
- 9.1. Market Analysis, Insights and Forecast - by Application
- 10. Asia Pacific Corneal Analyzer Analysis, Insights and Forecast, 2020-2032
- 10.1. Market Analysis, Insights and Forecast - by Application
- 10.1.1. Hospitals
- 10.1.2. Eye Clinics
- 10.1.3. Others
- 10.2. Market Analysis, Insights and Forecast - by Types
- 10.2.1. Handheld
- 10.2.2. Bench-Top
- 10.1. Market Analysis, Insights and Forecast - by Application
- 11. Competitive Analysis
- 11.1. Global Market Share Analysis 2025
- 11.2. Company Profiles
- 11.2.1 Topcon
- 11.2.1.1. Overview
- 11.2.1.2. Products
- 11.2.1.3. SWOT Analysis
- 11.2.1.4. Recent Developments
- 11.2.1.5. Financials (Based on Availability)
- 11.2.2 Ophtec
- 11.2.2.1. Overview
- 11.2.2.2. Products
- 11.2.2.3. SWOT Analysis
- 11.2.2.4. Recent Developments
- 11.2.2.5. Financials (Based on Availability)
- 11.2.3 NIDEK
- 11.2.3.1. Overview
- 11.2.3.2. Products
- 11.2.3.3. SWOT Analysis
- 11.2.3.4. Recent Developments
- 11.2.3.5. Financials (Based on Availability)
- 11.2.4 CSO
- 11.2.4.1. Overview
- 11.2.4.2. Products
- 11.2.4.3. SWOT Analysis
- 11.2.4.4. Recent Developments
- 11.2.4.5. Financials (Based on Availability)
- 11.2.5 Zeiss
- 11.2.5.1. Overview
- 11.2.5.2. Products
- 11.2.5.3. SWOT Analysis
- 11.2.5.4. Recent Developments
- 11.2.5.5. Financials (Based on Availability)
- 11.2.6 Essilor
- 11.2.6.1. Overview
- 11.2.6.2. Products
- 11.2.6.3. SWOT Analysis
- 11.2.6.4. Recent Developments
- 11.2.6.5. Financials (Based on Availability)
- 11.2.7 Bausch + Lomb
- 11.2.7.1. Overview
- 11.2.7.2. Products
- 11.2.7.3. SWOT Analysis
- 11.2.7.4. Recent Developments
- 11.2.7.5. Financials (Based on Availability)
- 11.2.1 Topcon
List of Figures
- Figure 1: Global Corneal Analyzer Revenue Breakdown (billion, %) by Region 2025 & 2033
- Figure 2: Global Corneal Analyzer Volume Breakdown (K, %) by Region 2025 & 2033
- Figure 3: North America Corneal Analyzer Revenue (billion), by Application 2025 & 2033
- Figure 4: North America Corneal Analyzer Volume (K), by Application 2025 & 2033
- Figure 5: North America Corneal Analyzer Revenue Share (%), by Application 2025 & 2033
- Figure 6: North America Corneal Analyzer Volume Share (%), by Application 2025 & 2033
- Figure 7: North America Corneal Analyzer Revenue (billion), by Types 2025 & 2033
- Figure 8: North America Corneal Analyzer Volume (K), by Types 2025 & 2033
- Figure 9: North America Corneal Analyzer Revenue Share (%), by Types 2025 & 2033
- Figure 10: North America Corneal Analyzer Volume Share (%), by Types 2025 & 2033
- Figure 11: North America Corneal Analyzer Revenue (billion), by Country 2025 & 2033
- Figure 12: North America Corneal Analyzer Volume (K), by Country 2025 & 2033
- Figure 13: North America Corneal Analyzer Revenue Share (%), by Country 2025 & 2033
- Figure 14: North America Corneal Analyzer Volume Share (%), by Country 2025 & 2033
- Figure 15: South America Corneal Analyzer Revenue (billion), by Application 2025 & 2033
- Figure 16: South America Corneal Analyzer Volume (K), by Application 2025 & 2033
- Figure 17: South America Corneal Analyzer Revenue Share (%), by Application 2025 & 2033
- Figure 18: South America Corneal Analyzer Volume Share (%), by Application 2025 & 2033
- Figure 19: South America Corneal Analyzer Revenue (billion), by Types 2025 & 2033
- Figure 20: South America Corneal Analyzer Volume (K), by Types 2025 & 2033
- Figure 21: South America Corneal Analyzer Revenue Share (%), by Types 2025 & 2033
- Figure 22: South America Corneal Analyzer Volume Share (%), by Types 2025 & 2033
- Figure 23: South America Corneal Analyzer Revenue (billion), by Country 2025 & 2033
- Figure 24: South America Corneal Analyzer Volume (K), by Country 2025 & 2033
- Figure 25: South America Corneal Analyzer Revenue Share (%), by Country 2025 & 2033
- Figure 26: South America Corneal Analyzer Volume Share (%), by Country 2025 & 2033
- Figure 27: Europe Corneal Analyzer Revenue (billion), by Application 2025 & 2033
- Figure 28: Europe Corneal Analyzer Volume (K), by Application 2025 & 2033
- Figure 29: Europe Corneal Analyzer Revenue Share (%), by Application 2025 & 2033
- Figure 30: Europe Corneal Analyzer Volume Share (%), by Application 2025 & 2033
- Figure 31: Europe Corneal Analyzer Revenue (billion), by Types 2025 & 2033
- Figure 32: Europe Corneal Analyzer Volume (K), by Types 2025 & 2033
- Figure 33: Europe Corneal Analyzer Revenue Share (%), by Types 2025 & 2033
- Figure 34: Europe Corneal Analyzer Volume Share (%), by Types 2025 & 2033
- Figure 35: Europe Corneal Analyzer Revenue (billion), by Country 2025 & 2033
- Figure 36: Europe Corneal Analyzer Volume (K), by Country 2025 & 2033
- Figure 37: Europe Corneal Analyzer Revenue Share (%), by Country 2025 & 2033
- Figure 38: Europe Corneal Analyzer Volume Share (%), by Country 2025 & 2033
- Figure 39: Middle East & Africa Corneal Analyzer Revenue (billion), by Application 2025 & 2033
- Figure 40: Middle East & Africa Corneal Analyzer Volume (K), by Application 2025 & 2033
- Figure 41: Middle East & Africa Corneal Analyzer Revenue Share (%), by Application 2025 & 2033
- Figure 42: Middle East & Africa Corneal Analyzer Volume Share (%), by Application 2025 & 2033
- Figure 43: Middle East & Africa Corneal Analyzer Revenue (billion), by Types 2025 & 2033
- Figure 44: Middle East & Africa Corneal Analyzer Volume (K), by Types 2025 & 2033
- Figure 45: Middle East & Africa Corneal Analyzer Revenue Share (%), by Types 2025 & 2033
- Figure 46: Middle East & Africa Corneal Analyzer Volume Share (%), by Types 2025 & 2033
- Figure 47: Middle East & Africa Corneal Analyzer Revenue (billion), by Country 2025 & 2033
- Figure 48: Middle East & Africa Corneal Analyzer Volume (K), by Country 2025 & 2033
- Figure 49: Middle East & Africa Corneal Analyzer Revenue Share (%), by Country 2025 & 2033
- Figure 50: Middle East & Africa Corneal Analyzer Volume Share (%), by Country 2025 & 2033
- Figure 51: Asia Pacific Corneal Analyzer Revenue (billion), by Application 2025 & 2033
- Figure 52: Asia Pacific Corneal Analyzer Volume (K), by Application 2025 & 2033
- Figure 53: Asia Pacific Corneal Analyzer Revenue Share (%), by Application 2025 & 2033
- Figure 54: Asia Pacific Corneal Analyzer Volume Share (%), by Application 2025 & 2033
- Figure 55: Asia Pacific Corneal Analyzer Revenue (billion), by Types 2025 & 2033
- Figure 56: Asia Pacific Corneal Analyzer Volume (K), by Types 2025 & 2033
- Figure 57: Asia Pacific Corneal Analyzer Revenue Share (%), by Types 2025 & 2033
- Figure 58: Asia Pacific Corneal Analyzer Volume Share (%), by Types 2025 & 2033
- Figure 59: Asia Pacific Corneal Analyzer Revenue (billion), by Country 2025 & 2033
- Figure 60: Asia Pacific Corneal Analyzer Volume (K), by Country 2025 & 2033
- Figure 61: Asia Pacific Corneal Analyzer Revenue Share (%), by Country 2025 & 2033
- Figure 62: Asia Pacific Corneal Analyzer Volume Share (%), by Country 2025 & 2033
List of Tables
- Table 1: Global Corneal Analyzer Revenue billion Forecast, by Application 2020 & 2033
- Table 2: Global Corneal Analyzer Volume K Forecast, by Application 2020 & 2033
- Table 3: Global Corneal Analyzer Revenue billion Forecast, by Types 2020 & 2033
- Table 4: Global Corneal Analyzer Volume K Forecast, by Types 2020 & 2033
- Table 5: Global Corneal Analyzer Revenue billion Forecast, by Region 2020 & 2033
- Table 6: Global Corneal Analyzer Volume K Forecast, by Region 2020 & 2033
- Table 7: Global Corneal Analyzer Revenue billion Forecast, by Application 2020 & 2033
- Table 8: Global Corneal Analyzer Volume K Forecast, by Application 2020 & 2033
- Table 9: Global Corneal Analyzer Revenue billion Forecast, by Types 2020 & 2033
- Table 10: Global Corneal Analyzer Volume K Forecast, by Types 2020 & 2033
- Table 11: Global Corneal Analyzer Revenue billion Forecast, by Country 2020 & 2033
- Table 12: Global Corneal Analyzer Volume K Forecast, by Country 2020 & 2033
- Table 13: United States Corneal Analyzer Revenue (billion) Forecast, by Application 2020 & 2033
- Table 14: United States Corneal Analyzer Volume (K) Forecast, by Application 2020 & 2033
- Table 15: Canada Corneal Analyzer Revenue (billion) Forecast, by Application 2020 & 2033
- Table 16: Canada Corneal Analyzer Volume (K) Forecast, by Application 2020 & 2033
- Table 17: Mexico Corneal Analyzer Revenue (billion) Forecast, by Application 2020 & 2033
- Table 18: Mexico Corneal Analyzer Volume (K) Forecast, by Application 2020 & 2033
- Table 19: Global Corneal Analyzer Revenue billion Forecast, by Application 2020 & 2033
- Table 20: Global Corneal Analyzer Volume K Forecast, by Application 2020 & 2033
- Table 21: Global Corneal Analyzer Revenue billion Forecast, by Types 2020 & 2033
- Table 22: Global Corneal Analyzer Volume K Forecast, by Types 2020 & 2033
- Table 23: Global Corneal Analyzer Revenue billion Forecast, by Country 2020 & 2033
- Table 24: Global Corneal Analyzer Volume K Forecast, by Country 2020 & 2033
- Table 25: Brazil Corneal Analyzer Revenue (billion) Forecast, by Application 2020 & 2033
- Table 26: Brazil Corneal Analyzer Volume (K) Forecast, by Application 2020 & 2033
- Table 27: Argentina Corneal Analyzer Revenue (billion) Forecast, by Application 2020 & 2033
- Table 28: Argentina Corneal Analyzer Volume (K) Forecast, by Application 2020 & 2033
- Table 29: Rest of South America Corneal Analyzer Revenue (billion) Forecast, by Application 2020 & 2033
- Table 30: Rest of South America Corneal Analyzer Volume (K) Forecast, by Application 2020 & 2033
- Table 31: Global Corneal Analyzer Revenue billion Forecast, by Application 2020 & 2033
- Table 32: Global Corneal Analyzer Volume K Forecast, by Application 2020 & 2033
- Table 33: Global Corneal Analyzer Revenue billion Forecast, by Types 2020 & 2033
- Table 34: Global Corneal Analyzer Volume K Forecast, by Types 2020 & 2033
- Table 35: Global Corneal Analyzer Revenue billion Forecast, by Country 2020 & 2033
- Table 36: Global Corneal Analyzer Volume K Forecast, by Country 2020 & 2033
- Table 37: United Kingdom Corneal Analyzer Revenue (billion) Forecast, by Application 2020 & 2033
- Table 38: United Kingdom Corneal Analyzer Volume (K) Forecast, by Application 2020 & 2033
- Table 39: Germany Corneal Analyzer Revenue (billion) Forecast, by Application 2020 & 2033
- Table 40: Germany Corneal Analyzer Volume (K) Forecast, by Application 2020 & 2033
- Table 41: France Corneal Analyzer Revenue (billion) Forecast, by Application 2020 & 2033
- Table 42: France Corneal Analyzer Volume (K) Forecast, by Application 2020 & 2033
- Table 43: Italy Corneal Analyzer Revenue (billion) Forecast, by Application 2020 & 2033
- Table 44: Italy Corneal Analyzer Volume (K) Forecast, by Application 2020 & 2033
- Table 45: Spain Corneal Analyzer Revenue (billion) Forecast, by Application 2020 & 2033
- Table 46: Spain Corneal Analyzer Volume (K) Forecast, by Application 2020 & 2033
- Table 47: Russia Corneal Analyzer Revenue (billion) Forecast, by Application 2020 & 2033
- Table 48: Russia Corneal Analyzer Volume (K) Forecast, by Application 2020 & 2033
- Table 49: Benelux Corneal Analyzer Revenue (billion) Forecast, by Application 2020 & 2033
- Table 50: Benelux Corneal Analyzer Volume (K) Forecast, by Application 2020 & 2033
- Table 51: Nordics Corneal Analyzer Revenue (billion) Forecast, by Application 2020 & 2033
- Table 52: Nordics Corneal Analyzer Volume (K) Forecast, by Application 2020 & 2033
- Table 53: Rest of Europe Corneal Analyzer Revenue (billion) Forecast, by Application 2020 & 2033
- Table 54: Rest of Europe Corneal Analyzer Volume (K) Forecast, by Application 2020 & 2033
- Table 55: Global Corneal Analyzer Revenue billion Forecast, by Application 2020 & 2033
- Table 56: Global Corneal Analyzer Volume K Forecast, by Application 2020 & 2033
- Table 57: Global Corneal Analyzer Revenue billion Forecast, by Types 2020 & 2033
- Table 58: Global Corneal Analyzer Volume K Forecast, by Types 2020 & 2033
- Table 59: Global Corneal Analyzer Revenue billion Forecast, by Country 2020 & 2033
- Table 60: Global Corneal Analyzer Volume K Forecast, by Country 2020 & 2033
- Table 61: Turkey Corneal Analyzer Revenue (billion) Forecast, by Application 2020 & 2033
- Table 62: Turkey Corneal Analyzer Volume (K) Forecast, by Application 2020 & 2033
- Table 63: Israel Corneal Analyzer Revenue (billion) Forecast, by Application 2020 & 2033
- Table 64: Israel Corneal Analyzer Volume (K) Forecast, by Application 2020 & 2033
- Table 65: GCC Corneal Analyzer Revenue (billion) Forecast, by Application 2020 & 2033
- Table 66: GCC Corneal Analyzer Volume (K) Forecast, by Application 2020 & 2033
- Table 67: North Africa Corneal Analyzer Revenue (billion) Forecast, by Application 2020 & 2033
- Table 68: North Africa Corneal Analyzer Volume (K) Forecast, by Application 2020 & 2033
- Table 69: South Africa Corneal Analyzer Revenue (billion) Forecast, by Application 2020 & 2033
- Table 70: South Africa Corneal Analyzer Volume (K) Forecast, by Application 2020 & 2033
- Table 71: Rest of Middle East & Africa Corneal Analyzer Revenue (billion) Forecast, by Application 2020 & 2033
- Table 72: Rest of Middle East & Africa Corneal Analyzer Volume (K) Forecast, by Application 2020 & 2033
- Table 73: Global Corneal Analyzer Revenue billion Forecast, by Application 2020 & 2033
- Table 74: Global Corneal Analyzer Volume K Forecast, by Application 2020 & 2033
- Table 75: Global Corneal Analyzer Revenue billion Forecast, by Types 2020 & 2033
- Table 76: Global Corneal Analyzer Volume K Forecast, by Types 2020 & 2033
- Table 77: Global Corneal Analyzer Revenue billion Forecast, by Country 2020 & 2033
- Table 78: Global Corneal Analyzer Volume K Forecast, by Country 2020 & 2033
- Table 79: China Corneal Analyzer Revenue (billion) Forecast, by Application 2020 & 2033
- Table 80: China Corneal Analyzer Volume (K) Forecast, by Application 2020 & 2033
- Table 81: India Corneal Analyzer Revenue (billion) Forecast, by Application 2020 & 2033
- Table 82: India Corneal Analyzer Volume (K) Forecast, by Application 2020 & 2033
- Table 83: Japan Corneal Analyzer Revenue (billion) Forecast, by Application 2020 & 2033
- Table 84: Japan Corneal Analyzer Volume (K) Forecast, by Application 2020 & 2033
- Table 85: South Korea Corneal Analyzer Revenue (billion) Forecast, by Application 2020 & 2033
- Table 86: South Korea Corneal Analyzer Volume (K) Forecast, by Application 2020 & 2033
- Table 87: ASEAN Corneal Analyzer Revenue (billion) Forecast, by Application 2020 & 2033
- Table 88: ASEAN Corneal Analyzer Volume (K) Forecast, by Application 2020 & 2033
- Table 89: Oceania Corneal Analyzer Revenue (billion) Forecast, by Application 2020 & 2033
- Table 90: Oceania Corneal Analyzer Volume (K) Forecast, by Application 2020 & 2033
- Table 91: Rest of Asia Pacific Corneal Analyzer Revenue (billion) Forecast, by Application 2020 & 2033
- Table 92: Rest of Asia Pacific Corneal Analyzer Volume (K) Forecast, by Application 2020 & 2033
Frequently Asked Questions
1. What is the projected Compound Annual Growth Rate (CAGR) of the Corneal Analyzer?
The projected CAGR is approximately 14.29%.
2. Which companies are prominent players in the Corneal Analyzer?
Key companies in the market include Topcon, Ophtec, NIDEK, CSO, Zeiss, Essilor, Bausch + Lomb.
3. What are the main segments of the Corneal Analyzer?
The market segments include Application, Types.
4. Can you provide details about the market size?
The market size is estimated to be USD 8.32 billion as of 2022.
5. What are some drivers contributing to market growth?
N/A
6. What are the notable trends driving market growth?
N/A
7. Are there any restraints impacting market growth?
N/A
8. Can you provide examples of recent developments in the market?
N/A
9. What pricing options are available for accessing the report?
Pricing options include single-user, multi-user, and enterprise licenses priced at USD 3350.00, USD 5025.00, and USD 6700.00 respectively.
10. Is the market size provided in terms of value or volume?
The market size is provided in terms of value, measured in billion and volume, measured in K.
11. Are there any specific market keywords associated with the report?
Yes, the market keyword associated with the report is "Corneal Analyzer," which aids in identifying and referencing the specific market segment covered.
12. How do I determine which pricing option suits my needs best?
The pricing options vary based on user requirements and access needs. Individual users may opt for single-user licenses, while businesses requiring broader access may choose multi-user or enterprise licenses for cost-effective access to the report.
13. Are there any additional resources or data provided in the Corneal Analyzer report?
While the report offers comprehensive insights, it's advisable to review the specific contents or supplementary materials provided to ascertain if additional resources or data are available.
14. How can I stay updated on further developments or reports in the Corneal Analyzer?
To stay informed about further developments, trends, and reports in the Corneal Analyzer, consider subscribing to industry newsletters, following relevant companies and organizations, or regularly checking reputable industry news sources and publications.
Methodology
Step 1 - Identification of Relevant Samples Size from Population Database


Step 2 - Approaches for Defining Global Market Size (Value, Volume* & Price*)

Note*: In applicable scenarios
Step 3 - Data Sources
Primary Research
- Web Analytics
- Survey Reports
- Research Institute
- Latest Research Reports
- Opinion Leaders
Secondary Research
- Annual Reports
- White Paper
- Latest Press Release
- Industry Association
- Paid Database
- Investor Presentations

Step 4 - Data Triangulation
Involves using different sources of information in order to increase the validity of a study
These sources are likely to be stakeholders in a program - participants, other researchers, program staff, other community members, and so on.
Then we put all data in single framework & apply various statistical tools to find out the dynamic on the market.
During the analysis stage, feedback from the stakeholder groups would be compared to determine areas of agreement as well as areas of divergence