

Key Insights
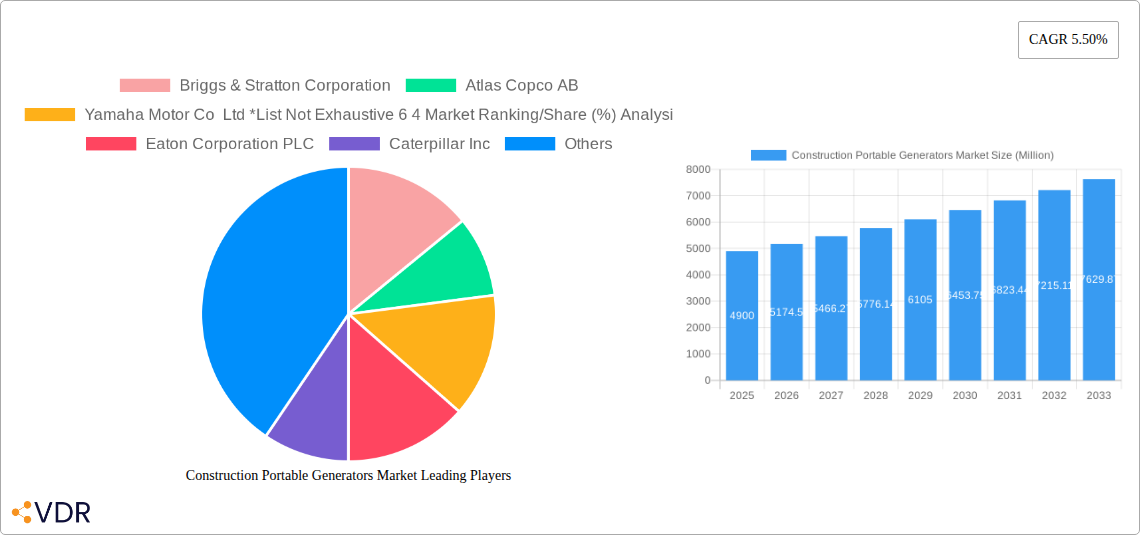
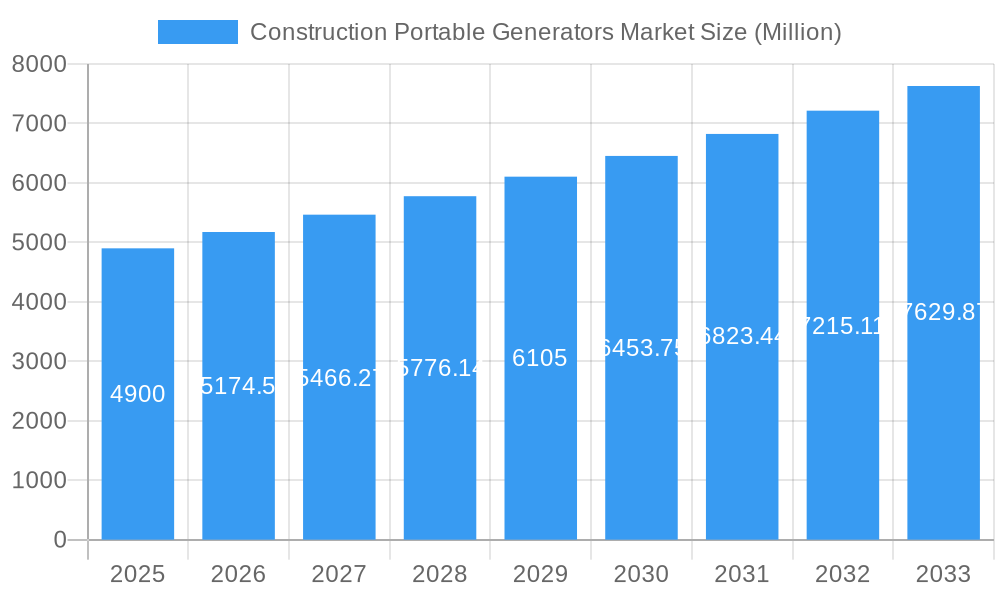
The Construction Portable Generators market, valued at $4.90 billion in 2025, is projected to experience robust growth, driven by a Compound Annual Growth Rate (CAGR) of 5.50% from 2025 to 2033. This expansion is fueled by several key factors. The increasing number of construction projects globally, particularly in developing economies experiencing rapid urbanization, necessitates reliable power sources for various tools and equipment. Furthermore, the rising demand for off-grid power solutions in remote construction sites, coupled with growing awareness of safety regulations and the need for backup power during outages, significantly boosts market demand. Technological advancements, such as the introduction of more fuel-efficient and environmentally friendly generators, also contribute to market growth. The market is segmented by power rating (below 5 kW, 5-10 kW, above 10 kW) and fuel type (gas, diesel, other fuel types), with diesel generators currently dominating due to their higher power output and durability. Key players like Briggs & Stratton, Atlas Copco, and Generac are actively engaged in product innovation and strategic partnerships to maintain their competitive edge. Regional variations in market growth are expected, with North America and Asia-Pacific anticipated to lead the market, driven by extensive infrastructure development and robust construction activities in these regions.
Construction Portable Generators Market Market Size (In Billion)
However, certain restraints could potentially impact market growth. Fluctuations in fuel prices, particularly diesel, could affect generator operating costs and consumer demand. Stringent emission regulations in some regions might necessitate manufacturers to invest in cleaner technologies, impacting production costs. Furthermore, the increasing availability of alternative power sources, such as solar and battery power, could pose a challenge to traditional portable generators in the long term. Despite these challenges, the overall market outlook remains positive, with the construction industry's continuous expansion and the increasing demand for reliable power solutions ensuring sustained growth for portable generators in the forecast period. The market is expected to surpass $8 billion by 2033, reflecting strong growth potential for both manufacturers and investors.
Construction Portable Generators Market Company Market Share
Construction Portable Generators Market: A Comprehensive Market Report (2019-2033)
This comprehensive report provides an in-depth analysis of the Construction Portable Generators market, encompassing market dynamics, growth trends, regional dominance, product landscape, key players, and future outlook. The study period covers 2019-2033, with a base year of 2025 and a forecast period of 2025-2033. The report serves as an essential resource for industry professionals, investors, and strategic decision-makers seeking a clear understanding of this vital sector within the broader power generation equipment market.
Construction Portable Generators Market Market Dynamics & Structure
This section analyzes the Construction Portable Generators market's structure, examining market concentration, technological innovation, regulatory landscapes, competitive substitutes, end-user demographics, and M&A activity. The market is characterized by a moderately consolidated landscape with several major players holding significant market share. Technological advancements, particularly in fuel efficiency and emission reduction, are driving significant market transformation. Stringent environmental regulations are shaping product development and adoption patterns. The increasing demand for reliable power sources in construction projects, coupled with the growing adoption of portable generators across diverse construction applications, fuels market expansion.
- Market Concentration: Moderately consolidated, with the top 10 players accounting for approximately xx% of the market share in 2024.
- Technological Innovation: Focus on fuel efficiency, emission control, and improved power output. Innovation barriers include high R&D costs and stringent regulatory compliance requirements.
- Regulatory Frameworks: Stringent emission standards and safety regulations in various regions influence product design and market access.
- Competitive Product Substitutes: Grid electricity and alternative power solutions (e.g., solar, wind) pose some competitive pressure.
- End-User Demographics: The primary end-users are construction companies of all sizes, ranging from small-scale projects to large-scale infrastructure developments.
- M&A Trends: A moderate level of M&A activity, driven by strategic expansion and technological acquisition. Approximately xx M&A deals were recorded during the historical period (2019-2024).
Construction Portable Generators Market Growth Trends & Insights
The Construction Portable Generators market has experienced steady growth throughout the historical period (2019-2024), fueled by the robust construction industry globally. The market size reached xx Million units in 2024 and is projected to grow at a CAGR of xx% during the forecast period (2025-2033), reaching xx Million units by 2033. This growth is driven by increasing infrastructure spending in developing economies, rising urbanization, and the growing adoption of technologically advanced portable generators. Technological disruptions, such as advancements in fuel cell technology and hybrid power solutions, are expected to reshape the market in the coming years. Shifting consumer behavior toward eco-friendly and energy-efficient solutions is creating new opportunities for manufacturers. The increasing awareness of environmental regulations is promoting the adoption of cleaner fuel options.
Dominant Regions, Countries, or Segments in Construction Portable Generators Market
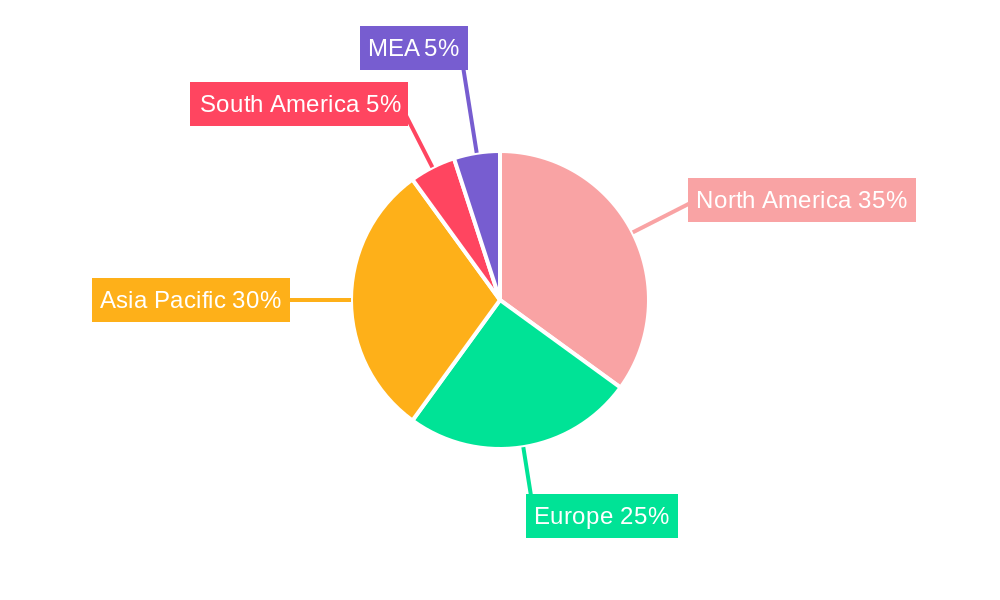
North America and Europe currently hold the largest market shares, driven by robust construction activities and a higher adoption rate of advanced power generation technologies. However, the Asia-Pacific region is projected to witness the fastest growth during the forecast period, fueled by rapid urbanization and infrastructure development. Within the product segments, the 5-10 KW power rating segment dominates the market due to its suitability for a wide range of construction applications. Diesel generators command the largest market share in terms of fuel type, particularly in larger-scale construction projects where power requirements are significant.
- Key Drivers: Strong infrastructure investments, rapid urbanization, industrialization, and government initiatives promoting infrastructure development.
- North America: High construction activity and adoption of advanced technologies.
- Europe: Stringent environmental regulations driving the demand for cleaner fuel options.
- Asia-Pacific: Rapid infrastructure development and urbanization driving significant growth potential.
- Power Rating: 5-10 KW segment leading due to versatility.
- Fuel Type: Diesel generators dominating due to higher power output and longer operational hours.
Construction Portable Generators Market Product Landscape
The market offers a diverse range of portable generators catering to various power requirements and construction applications. Key product innovations focus on enhanced fuel efficiency, reduced emissions, quieter operation, and improved durability. Generators are designed for portability, ease of use, and reliable performance in challenging construction environments. Manufacturers are increasingly incorporating advanced features such as digital control panels, remote monitoring capabilities, and integrated safety systems. Unique selling propositions include superior fuel efficiency, advanced safety features, and extended operational life.
Key Drivers, Barriers & Challenges in Construction Portable Generators Market
Key Drivers: The construction industry's growth, expanding infrastructure projects, and the need for reliable power in remote locations are key drivers. Government initiatives promoting infrastructure development and technological advancements in fuel efficiency and emission control further propel market expansion.
Key Challenges: Fluctuations in raw material prices, stringent emission regulations, and the increasing cost of compliance present significant challenges. Supply chain disruptions and competition from alternative power solutions also hinder market growth. The rising cost of diesel fuel could impact the market in the coming years.
Emerging Opportunities in Construction Portable Generators Market
Emerging opportunities lie in the development of hybrid and alternative fuel generators, catering to the growing demand for sustainable and eco-friendly solutions. The integration of smart technologies, remote monitoring, and data analytics offers new avenues for improving efficiency and optimizing operations. Expansion into untapped markets in developing economies presents significant growth potential.
Growth Accelerators in the Construction Portable Generators Market Industry
Technological breakthroughs in fuel cell technology and battery storage solutions will significantly impact the market's growth trajectory. Strategic partnerships between manufacturers and construction companies can facilitate market penetration and accelerate technology adoption. Government support for sustainable energy initiatives and investments in infrastructure development are key catalysts for future growth.
Key Players Shaping the Construction Portable Generators Market Market
- Briggs & Stratton Corporation
- Atlas Copco AB
- Yamaha Motor Co Ltd
- Eaton Corporation PLC
- Caterpillar Inc
- Honda Siel Power Products Ltd
- Kohler Power Systems
- Wacker Neuson SE
- Generac Holdings Inc
Notable Milestones in Construction Portable Generators Market Sector
- 2020: Generac Holdings Inc. launched a new line of fuel-efficient portable generators.
- 2022: Atlas Copco AB introduced a portable generator with advanced emission control technology.
- 2023: Several key players announced strategic partnerships to enhance their market presence. (Specific details pending further research)
In-Depth Construction Portable Generators Market Market Outlook
The Construction Portable Generators market is poised for continued growth, driven by sustained infrastructure development, technological advancements, and increasing demand for reliable power solutions. The market's future potential lies in embracing sustainable technologies, optimizing operations, and expanding into emerging markets. Strategic partnerships and investments in R&D will be crucial for sustained growth and market leadership.
Construction Portable Generators Market Segmentation
-
1. Power Rating
- 1.1. Below 5 KW
- 1.2. 5-10 KW
- 1.3. Above 10 KW
-
2. Fuel Type
- 2.1. Gas
- 2.2. Diesel
- 2.3. Other Fuel Types
Construction Portable Generators Market Segmentation By Geography
-
1. North America
- 1.1. United States
- 1.2. Canada
- 1.3. Rest of North America
-
2. Europe
- 2.1. Germany
- 2.2. France
- 2.3. United Kingdom
- 2.4. Spain
- 2.5. NORDIC
- 2.6. Turkey
- 2.7. Russia
- 2.8. Rest of Europe
-
3. Asia Pacific
- 3.1. China
- 3.2. India
- 3.3. Japan
- 3.4. South Korea
- 3.5. Malaysia
- 3.6. Thailand
- 3.7. Indonesia
- 3.8. Vietnam
- 3.9. Rest of Asia Pacific
-
4. South America
- 4.1. Brazil
- 4.2. Argentina
- 4.3. Colombia
- 4.4. Rest of South America
-
5. Middle East and Africa
- 5.1. Saudi Arabia
- 5.2. United Arab Emirates
- 5.3. South Africa
- 5.4. Egypt
- 5.5. Nigeria
- 5.6. Qatar
- 5.7. Rest of Middle East and Africa
Construction Portable Generators Market Regional Market Share
Geographic Coverage of Construction Portable Generators Market
Construction Portable Generators Market REPORT HIGHLIGHTS
| Aspects | Details |
|---|---|
| Study Period | 2020-2034 |
| Base Year | 2025 |
| Estimated Year | 2026 |
| Forecast Period | 2026-2034 |
| Historical Period | 2020-2025 |
| Growth Rate | CAGR of 5.50% from 2020-2034 |
| Segmentation |
|
Table of Contents
- 1. Introduction
- 1.1. Research Scope
- 1.2. Market Segmentation
- 1.3. Research Objective
- 1.4. Definitions and Assumptions
- 2. Executive Summary
- 2.1. Market Snapshot
- 3. Market Dynamics
- 3.1. Market Drivers
- 3.2. Market Restrains
- 3.3. Market Trends
- 3.4. Market Opportunities
- 4. Market Factor Analysis
- 4.1. Porters Five Forces
- 4.1.1. Bargaining Power of Suppliers
- 4.1.2. Bargaining Power of Buyers
- 4.1.3. Threat of New Entrants
- 4.1.4. Threat of Substitutes
- 4.1.5. Competitive Rivalry
- 4.2. PESTEL analysis
- 4.3. BCG Analysis
- 4.3.1. Stars (High Growth, High Market Share)
- 4.3.2. Cash Cows (Low Growth, High Market Share)
- 4.3.3. Question Mark (High Growth, Low Market Share)
- 4.3.4. Dogs (Low Growth, Low Market Share)
- 4.4. Ansoff Matrix Analysis
- 4.5. Supply Chain Analysis
- 4.6. Regulatory Landscape
- 4.7. Current Market Potential and Opportunity Assessment (TAM–SAM–SOM Framework)
- 4.8. VDR Analyst Note
- 4.1. Porters Five Forces
- 5. Market Analysis, Insights and Forecast 2021-2033
- 5.1. Market Analysis, Insights and Forecast - by Power Rating
- 5.1.1. Below 5 KW
- 5.1.2. 5-10 KW
- 5.1.3. Above 10 KW
- 5.2. Market Analysis, Insights and Forecast - by Fuel Type
- 5.2.1. Gas
- 5.2.2. Diesel
- 5.2.3. Other Fuel Types
- 5.3. Market Analysis, Insights and Forecast - by Region
- 5.3.1. North America
- 5.3.2. Europe
- 5.3.3. Asia Pacific
- 5.3.4. South America
- 5.3.5. Middle East and Africa
- 5.1. Market Analysis, Insights and Forecast - by Power Rating
- 6. Global Construction Portable Generators Market Analysis, Insights and Forecast, 2021-2033
- 6.1. Market Analysis, Insights and Forecast - by Power Rating
- 6.1.1. Below 5 KW
- 6.1.2. 5-10 KW
- 6.1.3. Above 10 KW
- 6.2. Market Analysis, Insights and Forecast - by Fuel Type
- 6.2.1. Gas
- 6.2.2. Diesel
- 6.2.3. Other Fuel Types
- 6.1. Market Analysis, Insights and Forecast - by Power Rating
- 7. North America Construction Portable Generators Market Analysis, Insights and Forecast, 2021-2033
- 7.1. Market Analysis, Insights and Forecast - by Power Rating
- 7.1.1. Below 5 KW
- 7.1.2. 5-10 KW
- 7.1.3. Above 10 KW
- 7.2. Market Analysis, Insights and Forecast - by Fuel Type
- 7.2.1. Gas
- 7.2.2. Diesel
- 7.2.3. Other Fuel Types
- 7.1. Market Analysis, Insights and Forecast - by Power Rating
- 8. Europe Construction Portable Generators Market Analysis, Insights and Forecast, 2021-2033
- 8.1. Market Analysis, Insights and Forecast - by Power Rating
- 8.1.1. Below 5 KW
- 8.1.2. 5-10 KW
- 8.1.3. Above 10 KW
- 8.2. Market Analysis, Insights and Forecast - by Fuel Type
- 8.2.1. Gas
- 8.2.2. Diesel
- 8.2.3. Other Fuel Types
- 8.1. Market Analysis, Insights and Forecast - by Power Rating
- 9. Asia Pacific Construction Portable Generators Market Analysis, Insights and Forecast, 2021-2033
- 9.1. Market Analysis, Insights and Forecast - by Power Rating
- 9.1.1. Below 5 KW
- 9.1.2. 5-10 KW
- 9.1.3. Above 10 KW
- 9.2. Market Analysis, Insights and Forecast - by Fuel Type
- 9.2.1. Gas
- 9.2.2. Diesel
- 9.2.3. Other Fuel Types
- 9.1. Market Analysis, Insights and Forecast - by Power Rating
- 10. South America Construction Portable Generators Market Analysis, Insights and Forecast, 2021-2033
- 10.1. Market Analysis, Insights and Forecast - by Power Rating
- 10.1.1. Below 5 KW
- 10.1.2. 5-10 KW
- 10.1.3. Above 10 KW
- 10.2. Market Analysis, Insights and Forecast - by Fuel Type
- 10.2.1. Gas
- 10.2.2. Diesel
- 10.2.3. Other Fuel Types
- 10.1. Market Analysis, Insights and Forecast - by Power Rating
- 11. Middle East and Africa Construction Portable Generators Market Analysis, Insights and Forecast, 2021-2033
- 11.1. Market Analysis, Insights and Forecast - by Power Rating
- 11.1.1. Below 5 KW
- 11.1.2. 5-10 KW
- 11.1.3. Above 10 KW
- 11.2. Market Analysis, Insights and Forecast - by Fuel Type
- 11.2.1. Gas
- 11.2.2. Diesel
- 11.2.3. Other Fuel Types
- 11.1. Market Analysis, Insights and Forecast - by Power Rating
- 12. Competitive Analysis
- 12.1. Company Profiles
- 12.1.1 Briggs & Stratton Corporation
- 12.1.1.1. Company Overview
- 12.1.1.2. Products
- 12.1.1.3. Company Financials
- 12.1.1.4. SWOT Analysis
- 12.1.2 Atlas Copco AB
- 12.1.2.1. Company Overview
- 12.1.2.2. Products
- 12.1.2.3. Company Financials
- 12.1.2.4. SWOT Analysis
- 12.1.3 Yamaha Motor Co Ltd *List Not Exhaustive 6 4 Market Ranking/Share (%) Analysi
- 12.1.3.1. Company Overview
- 12.1.3.2. Products
- 12.1.3.3. Company Financials
- 12.1.3.4. SWOT Analysis
- 12.1.4 Eaton Corporation PLC
- 12.1.4.1. Company Overview
- 12.1.4.2. Products
- 12.1.4.3. Company Financials
- 12.1.4.4. SWOT Analysis
- 12.1.5 Caterpillar Inc
- 12.1.5.1. Company Overview
- 12.1.5.2. Products
- 12.1.5.3. Company Financials
- 12.1.5.4. SWOT Analysis
- 12.1.6 Honda Siel Power Products Ltd
- 12.1.6.1. Company Overview
- 12.1.6.2. Products
- 12.1.6.3. Company Financials
- 12.1.6.4. SWOT Analysis
- 12.1.7 Kohler Power Systems
- 12.1.7.1. Company Overview
- 12.1.7.2. Products
- 12.1.7.3. Company Financials
- 12.1.7.4. SWOT Analysis
- 12.1.8 Wacker Neuson SE
- 12.1.8.1. Company Overview
- 12.1.8.2. Products
- 12.1.8.3. Company Financials
- 12.1.8.4. SWOT Analysis
- 12.1.9 Generac Holdings Inc
- 12.1.9.1. Company Overview
- 12.1.9.2. Products
- 12.1.9.3. Company Financials
- 12.1.9.4. SWOT Analysis
- 12.1.1 Briggs & Stratton Corporation
- 12.2. Market Entropy
- 12.2.1 Company's Key Areas Served
- 12.2.2 Recent Developments
- 12.3. Company Market Share Analysis 2025
- 12.3.1 Top 5 Companies Market Share Analysis
- 12.3.2 Top 3 Companies Market Share Analysis
- 12.4. List of Potential Customers
- 13. Research Methodology
List of Figures
- Figure 1: Global Construction Portable Generators Market Revenue Breakdown (Million, %) by Region 2025 & 2033
- Figure 2: Global Construction Portable Generators Market Volume Breakdown (K Unit, %) by Region 2025 & 2033
- Figure 3: North America Construction Portable Generators Market Revenue (Million), by Power Rating 2025 & 2033
- Figure 4: North America Construction Portable Generators Market Volume (K Unit), by Power Rating 2025 & 2033
- Figure 5: North America Construction Portable Generators Market Revenue Share (%), by Power Rating 2025 & 2033
- Figure 6: North America Construction Portable Generators Market Volume Share (%), by Power Rating 2025 & 2033
- Figure 7: North America Construction Portable Generators Market Revenue (Million), by Fuel Type 2025 & 2033
- Figure 8: North America Construction Portable Generators Market Volume (K Unit), by Fuel Type 2025 & 2033
- Figure 9: North America Construction Portable Generators Market Revenue Share (%), by Fuel Type 2025 & 2033
- Figure 10: North America Construction Portable Generators Market Volume Share (%), by Fuel Type 2025 & 2033
- Figure 11: North America Construction Portable Generators Market Revenue (Million), by Country 2025 & 2033
- Figure 12: North America Construction Portable Generators Market Volume (K Unit), by Country 2025 & 2033
- Figure 13: North America Construction Portable Generators Market Revenue Share (%), by Country 2025 & 2033
- Figure 14: North America Construction Portable Generators Market Volume Share (%), by Country 2025 & 2033
- Figure 15: Europe Construction Portable Generators Market Revenue (Million), by Power Rating 2025 & 2033
- Figure 16: Europe Construction Portable Generators Market Volume (K Unit), by Power Rating 2025 & 2033
- Figure 17: Europe Construction Portable Generators Market Revenue Share (%), by Power Rating 2025 & 2033
- Figure 18: Europe Construction Portable Generators Market Volume Share (%), by Power Rating 2025 & 2033
- Figure 19: Europe Construction Portable Generators Market Revenue (Million), by Fuel Type 2025 & 2033
- Figure 20: Europe Construction Portable Generators Market Volume (K Unit), by Fuel Type 2025 & 2033
- Figure 21: Europe Construction Portable Generators Market Revenue Share (%), by Fuel Type 2025 & 2033
- Figure 22: Europe Construction Portable Generators Market Volume Share (%), by Fuel Type 2025 & 2033
- Figure 23: Europe Construction Portable Generators Market Revenue (Million), by Country 2025 & 2033
- Figure 24: Europe Construction Portable Generators Market Volume (K Unit), by Country 2025 & 2033
- Figure 25: Europe Construction Portable Generators Market Revenue Share (%), by Country 2025 & 2033
- Figure 26: Europe Construction Portable Generators Market Volume Share (%), by Country 2025 & 2033
- Figure 27: Asia Pacific Construction Portable Generators Market Revenue (Million), by Power Rating 2025 & 2033
- Figure 28: Asia Pacific Construction Portable Generators Market Volume (K Unit), by Power Rating 2025 & 2033
- Figure 29: Asia Pacific Construction Portable Generators Market Revenue Share (%), by Power Rating 2025 & 2033
- Figure 30: Asia Pacific Construction Portable Generators Market Volume Share (%), by Power Rating 2025 & 2033
- Figure 31: Asia Pacific Construction Portable Generators Market Revenue (Million), by Fuel Type 2025 & 2033
- Figure 32: Asia Pacific Construction Portable Generators Market Volume (K Unit), by Fuel Type 2025 & 2033
- Figure 33: Asia Pacific Construction Portable Generators Market Revenue Share (%), by Fuel Type 2025 & 2033
- Figure 34: Asia Pacific Construction Portable Generators Market Volume Share (%), by Fuel Type 2025 & 2033
- Figure 35: Asia Pacific Construction Portable Generators Market Revenue (Million), by Country 2025 & 2033
- Figure 36: Asia Pacific Construction Portable Generators Market Volume (K Unit), by Country 2025 & 2033
- Figure 37: Asia Pacific Construction Portable Generators Market Revenue Share (%), by Country 2025 & 2033
- Figure 38: Asia Pacific Construction Portable Generators Market Volume Share (%), by Country 2025 & 2033
- Figure 39: South America Construction Portable Generators Market Revenue (Million), by Power Rating 2025 & 2033
- Figure 40: South America Construction Portable Generators Market Volume (K Unit), by Power Rating 2025 & 2033
- Figure 41: South America Construction Portable Generators Market Revenue Share (%), by Power Rating 2025 & 2033
- Figure 42: South America Construction Portable Generators Market Volume Share (%), by Power Rating 2025 & 2033
- Figure 43: South America Construction Portable Generators Market Revenue (Million), by Fuel Type 2025 & 2033
- Figure 44: South America Construction Portable Generators Market Volume (K Unit), by Fuel Type 2025 & 2033
- Figure 45: South America Construction Portable Generators Market Revenue Share (%), by Fuel Type 2025 & 2033
- Figure 46: South America Construction Portable Generators Market Volume Share (%), by Fuel Type 2025 & 2033
- Figure 47: South America Construction Portable Generators Market Revenue (Million), by Country 2025 & 2033
- Figure 48: South America Construction Portable Generators Market Volume (K Unit), by Country 2025 & 2033
- Figure 49: South America Construction Portable Generators Market Revenue Share (%), by Country 2025 & 2033
- Figure 50: South America Construction Portable Generators Market Volume Share (%), by Country 2025 & 2033
- Figure 51: Middle East and Africa Construction Portable Generators Market Revenue (Million), by Power Rating 2025 & 2033
- Figure 52: Middle East and Africa Construction Portable Generators Market Volume (K Unit), by Power Rating 2025 & 2033
- Figure 53: Middle East and Africa Construction Portable Generators Market Revenue Share (%), by Power Rating 2025 & 2033
- Figure 54: Middle East and Africa Construction Portable Generators Market Volume Share (%), by Power Rating 2025 & 2033
- Figure 55: Middle East and Africa Construction Portable Generators Market Revenue (Million), by Fuel Type 2025 & 2033
- Figure 56: Middle East and Africa Construction Portable Generators Market Volume (K Unit), by Fuel Type 2025 & 2033
- Figure 57: Middle East and Africa Construction Portable Generators Market Revenue Share (%), by Fuel Type 2025 & 2033
- Figure 58: Middle East and Africa Construction Portable Generators Market Volume Share (%), by Fuel Type 2025 & 2033
- Figure 59: Middle East and Africa Construction Portable Generators Market Revenue (Million), by Country 2025 & 2033
- Figure 60: Middle East and Africa Construction Portable Generators Market Volume (K Unit), by Country 2025 & 2033
- Figure 61: Middle East and Africa Construction Portable Generators Market Revenue Share (%), by Country 2025 & 2033
- Figure 62: Middle East and Africa Construction Portable Generators Market Volume Share (%), by Country 2025 & 2033
List of Tables
- Table 1: Global Construction Portable Generators Market Revenue Million Forecast, by Power Rating 2020 & 2033
- Table 2: Global Construction Portable Generators Market Volume K Unit Forecast, by Power Rating 2020 & 2033
- Table 3: Global Construction Portable Generators Market Revenue Million Forecast, by Fuel Type 2020 & 2033
- Table 4: Global Construction Portable Generators Market Volume K Unit Forecast, by Fuel Type 2020 & 2033
- Table 5: Global Construction Portable Generators Market Revenue Million Forecast, by Region 2020 & 2033
- Table 6: Global Construction Portable Generators Market Volume K Unit Forecast, by Region 2020 & 2033
- Table 7: Global Construction Portable Generators Market Revenue Million Forecast, by Power Rating 2020 & 2033
- Table 8: Global Construction Portable Generators Market Volume K Unit Forecast, by Power Rating 2020 & 2033
- Table 9: Global Construction Portable Generators Market Revenue Million Forecast, by Fuel Type 2020 & 2033
- Table 10: Global Construction Portable Generators Market Volume K Unit Forecast, by Fuel Type 2020 & 2033
- Table 11: Global Construction Portable Generators Market Revenue Million Forecast, by Country 2020 & 2033
- Table 12: Global Construction Portable Generators Market Volume K Unit Forecast, by Country 2020 & 2033
- Table 13: United States Construction Portable Generators Market Revenue (Million) Forecast, by Application 2020 & 2033
- Table 14: United States Construction Portable Generators Market Volume (K Unit) Forecast, by Application 2020 & 2033
- Table 15: Canada Construction Portable Generators Market Revenue (Million) Forecast, by Application 2020 & 2033
- Table 16: Canada Construction Portable Generators Market Volume (K Unit) Forecast, by Application 2020 & 2033
- Table 17: Rest of North America Construction Portable Generators Market Revenue (Million) Forecast, by Application 2020 & 2033
- Table 18: Rest of North America Construction Portable Generators Market Volume (K Unit) Forecast, by Application 2020 & 2033
- Table 19: Global Construction Portable Generators Market Revenue Million Forecast, by Power Rating 2020 & 2033
- Table 20: Global Construction Portable Generators Market Volume K Unit Forecast, by Power Rating 2020 & 2033
- Table 21: Global Construction Portable Generators Market Revenue Million Forecast, by Fuel Type 2020 & 2033
- Table 22: Global Construction Portable Generators Market Volume K Unit Forecast, by Fuel Type 2020 & 2033
- Table 23: Global Construction Portable Generators Market Revenue Million Forecast, by Country 2020 & 2033
- Table 24: Global Construction Portable Generators Market Volume K Unit Forecast, by Country 2020 & 2033
- Table 25: Germany Construction Portable Generators Market Revenue (Million) Forecast, by Application 2020 & 2033
- Table 26: Germany Construction Portable Generators Market Volume (K Unit) Forecast, by Application 2020 & 2033
- Table 27: France Construction Portable Generators Market Revenue (Million) Forecast, by Application 2020 & 2033
- Table 28: France Construction Portable Generators Market Volume (K Unit) Forecast, by Application 2020 & 2033
- Table 29: United Kingdom Construction Portable Generators Market Revenue (Million) Forecast, by Application 2020 & 2033
- Table 30: United Kingdom Construction Portable Generators Market Volume (K Unit) Forecast, by Application 2020 & 2033
- Table 31: Spain Construction Portable Generators Market Revenue (Million) Forecast, by Application 2020 & 2033
- Table 32: Spain Construction Portable Generators Market Volume (K Unit) Forecast, by Application 2020 & 2033
- Table 33: NORDIC Construction Portable Generators Market Revenue (Million) Forecast, by Application 2020 & 2033
- Table 34: NORDIC Construction Portable Generators Market Volume (K Unit) Forecast, by Application 2020 & 2033
- Table 35: Turkey Construction Portable Generators Market Revenue (Million) Forecast, by Application 2020 & 2033
- Table 36: Turkey Construction Portable Generators Market Volume (K Unit) Forecast, by Application 2020 & 2033
- Table 37: Russia Construction Portable Generators Market Revenue (Million) Forecast, by Application 2020 & 2033
- Table 38: Russia Construction Portable Generators Market Volume (K Unit) Forecast, by Application 2020 & 2033
- Table 39: Rest of Europe Construction Portable Generators Market Revenue (Million) Forecast, by Application 2020 & 2033
- Table 40: Rest of Europe Construction Portable Generators Market Volume (K Unit) Forecast, by Application 2020 & 2033
- Table 41: Global Construction Portable Generators Market Revenue Million Forecast, by Power Rating 2020 & 2033
- Table 42: Global Construction Portable Generators Market Volume K Unit Forecast, by Power Rating 2020 & 2033
- Table 43: Global Construction Portable Generators Market Revenue Million Forecast, by Fuel Type 2020 & 2033
- Table 44: Global Construction Portable Generators Market Volume K Unit Forecast, by Fuel Type 2020 & 2033
- Table 45: Global Construction Portable Generators Market Revenue Million Forecast, by Country 2020 & 2033
- Table 46: Global Construction Portable Generators Market Volume K Unit Forecast, by Country 2020 & 2033
- Table 47: China Construction Portable Generators Market Revenue (Million) Forecast, by Application 2020 & 2033
- Table 48: China Construction Portable Generators Market Volume (K Unit) Forecast, by Application 2020 & 2033
- Table 49: India Construction Portable Generators Market Revenue (Million) Forecast, by Application 2020 & 2033
- Table 50: India Construction Portable Generators Market Volume (K Unit) Forecast, by Application 2020 & 2033
- Table 51: Japan Construction Portable Generators Market Revenue (Million) Forecast, by Application 2020 & 2033
- Table 52: Japan Construction Portable Generators Market Volume (K Unit) Forecast, by Application 2020 & 2033
- Table 53: South Korea Construction Portable Generators Market Revenue (Million) Forecast, by Application 2020 & 2033
- Table 54: South Korea Construction Portable Generators Market Volume (K Unit) Forecast, by Application 2020 & 2033
- Table 55: Malaysia Construction Portable Generators Market Revenue (Million) Forecast, by Application 2020 & 2033
- Table 56: Malaysia Construction Portable Generators Market Volume (K Unit) Forecast, by Application 2020 & 2033
- Table 57: Thailand Construction Portable Generators Market Revenue (Million) Forecast, by Application 2020 & 2033
- Table 58: Thailand Construction Portable Generators Market Volume (K Unit) Forecast, by Application 2020 & 2033
- Table 59: Indonesia Construction Portable Generators Market Revenue (Million) Forecast, by Application 2020 & 2033
- Table 60: Indonesia Construction Portable Generators Market Volume (K Unit) Forecast, by Application 2020 & 2033
- Table 61: Vietnam Construction Portable Generators Market Revenue (Million) Forecast, by Application 2020 & 2033
- Table 62: Vietnam Construction Portable Generators Market Volume (K Unit) Forecast, by Application 2020 & 2033
- Table 63: Rest of Asia Pacific Construction Portable Generators Market Revenue (Million) Forecast, by Application 2020 & 2033
- Table 64: Rest of Asia Pacific Construction Portable Generators Market Volume (K Unit) Forecast, by Application 2020 & 2033
- Table 65: Global Construction Portable Generators Market Revenue Million Forecast, by Power Rating 2020 & 2033
- Table 66: Global Construction Portable Generators Market Volume K Unit Forecast, by Power Rating 2020 & 2033
- Table 67: Global Construction Portable Generators Market Revenue Million Forecast, by Fuel Type 2020 & 2033
- Table 68: Global Construction Portable Generators Market Volume K Unit Forecast, by Fuel Type 2020 & 2033
- Table 69: Global Construction Portable Generators Market Revenue Million Forecast, by Country 2020 & 2033
- Table 70: Global Construction Portable Generators Market Volume K Unit Forecast, by Country 2020 & 2033
- Table 71: Brazil Construction Portable Generators Market Revenue (Million) Forecast, by Application 2020 & 2033
- Table 72: Brazil Construction Portable Generators Market Volume (K Unit) Forecast, by Application 2020 & 2033
- Table 73: Argentina Construction Portable Generators Market Revenue (Million) Forecast, by Application 2020 & 2033
- Table 74: Argentina Construction Portable Generators Market Volume (K Unit) Forecast, by Application 2020 & 2033
- Table 75: Colombia Construction Portable Generators Market Revenue (Million) Forecast, by Application 2020 & 2033
- Table 76: Colombia Construction Portable Generators Market Volume (K Unit) Forecast, by Application 2020 & 2033
- Table 77: Rest of South America Construction Portable Generators Market Revenue (Million) Forecast, by Application 2020 & 2033
- Table 78: Rest of South America Construction Portable Generators Market Volume (K Unit) Forecast, by Application 2020 & 2033
- Table 79: Global Construction Portable Generators Market Revenue Million Forecast, by Power Rating 2020 & 2033
- Table 80: Global Construction Portable Generators Market Volume K Unit Forecast, by Power Rating 2020 & 2033
- Table 81: Global Construction Portable Generators Market Revenue Million Forecast, by Fuel Type 2020 & 2033
- Table 82: Global Construction Portable Generators Market Volume K Unit Forecast, by Fuel Type 2020 & 2033
- Table 83: Global Construction Portable Generators Market Revenue Million Forecast, by Country 2020 & 2033
- Table 84: Global Construction Portable Generators Market Volume K Unit Forecast, by Country 2020 & 2033
- Table 85: Saudi Arabia Construction Portable Generators Market Revenue (Million) Forecast, by Application 2020 & 2033
- Table 86: Saudi Arabia Construction Portable Generators Market Volume (K Unit) Forecast, by Application 2020 & 2033
- Table 87: United Arab Emirates Construction Portable Generators Market Revenue (Million) Forecast, by Application 2020 & 2033
- Table 88: United Arab Emirates Construction Portable Generators Market Volume (K Unit) Forecast, by Application 2020 & 2033
- Table 89: South Africa Construction Portable Generators Market Revenue (Million) Forecast, by Application 2020 & 2033
- Table 90: South Africa Construction Portable Generators Market Volume (K Unit) Forecast, by Application 2020 & 2033
- Table 91: Egypt Construction Portable Generators Market Revenue (Million) Forecast, by Application 2020 & 2033
- Table 92: Egypt Construction Portable Generators Market Volume (K Unit) Forecast, by Application 2020 & 2033
- Table 93: Nigeria Construction Portable Generators Market Revenue (Million) Forecast, by Application 2020 & 2033
- Table 94: Nigeria Construction Portable Generators Market Volume (K Unit) Forecast, by Application 2020 & 2033
- Table 95: Qatar Construction Portable Generators Market Revenue (Million) Forecast, by Application 2020 & 2033
- Table 96: Qatar Construction Portable Generators Market Volume (K Unit) Forecast, by Application 2020 & 2033
- Table 97: Rest of Middle East and Africa Construction Portable Generators Market Revenue (Million) Forecast, by Application 2020 & 2033
- Table 98: Rest of Middle East and Africa Construction Portable Generators Market Volume (K Unit) Forecast, by Application 2020 & 2033
Frequently Asked Questions
1. What is the projected Compound Annual Growth Rate (CAGR) of the Construction Portable Generators Market?
The projected CAGR is approximately 5.50%.
2. Which companies are prominent players in the Construction Portable Generators Market?
Key companies in the market include Briggs & Stratton Corporation, Atlas Copco AB, Yamaha Motor Co Ltd *List Not Exhaustive 6 4 Market Ranking/Share (%) Analysi, Eaton Corporation PLC, Caterpillar Inc, Honda Siel Power Products Ltd, Kohler Power Systems, Wacker Neuson SE, Generac Holdings Inc.
3. What are the main segments of the Construction Portable Generators Market?
The market segments include Power Rating, Fuel Type.
4. Can you provide details about the market size?
The market size is estimated to be USD 4.90 Million as of 2022.
5. What are some drivers contributing to market growth?
4.; Increasing Demand for portable power source4.; Increasing investments in Construction Sector across the Globe.
6. What are the notable trends driving market growth?
Above 10 KW to be a Significant Market Segment.
7. Are there any restraints impacting market growth?
4.; Increasing Demand for Battery Storage Systems and other Cleaner Sources of Standby Power.
8. Can you provide examples of recent developments in the market?
N/A
9. What pricing options are available for accessing the report?
Pricing options include single-user, multi-user, and enterprise licenses priced at USD 4750, USD 5250, and USD 8750 respectively.
10. Is the market size provided in terms of value or volume?
The market size is provided in terms of value, measured in Million and volume, measured in K Unit.
11. Are there any specific market keywords associated with the report?
Yes, the market keyword associated with the report is "Construction Portable Generators Market," which aids in identifying and referencing the specific market segment covered.
12. How do I determine which pricing option suits my needs best?
The pricing options vary based on user requirements and access needs. Individual users may opt for single-user licenses, while businesses requiring broader access may choose multi-user or enterprise licenses for cost-effective access to the report.
13. Are there any additional resources or data provided in the Construction Portable Generators Market report?
While the report offers comprehensive insights, it's advisable to review the specific contents or supplementary materials provided to ascertain if additional resources or data are available.
14. How can I stay updated on further developments or reports in the Construction Portable Generators Market?
To stay informed about further developments, trends, and reports in the Construction Portable Generators Market, consider subscribing to industry newsletters, following relevant companies and organizations, or regularly checking reputable industry news sources and publications.
Methodology
Step 1 - Identification of Relevant Samples Size from Population Database


Step 2 - Approaches for Defining Global Market Size (Value, Volume* & Price*)

Note*: In applicable scenarios
Step 3 - Data Sources
Primary Research
- Web Analytics
- Survey Reports
- Research Institute
- Latest Research Reports
- Opinion Leaders
Secondary Research
- Annual Reports
- White Paper
- Latest Press Release
- Industry Association
- Paid Database
- Investor Presentations

Step 4 - Data Triangulation
Involves using different sources of information in order to increase the validity of a study
These sources are likely to be stakeholders in a program - participants, other researchers, program staff, other community members, and so on.
Then we put all data in single framework & apply various statistical tools to find out the dynamic on the market.
During the analysis stage, feedback from the stakeholder groups would be compared to determine areas of agreement as well as areas of divergence