

Key Insights
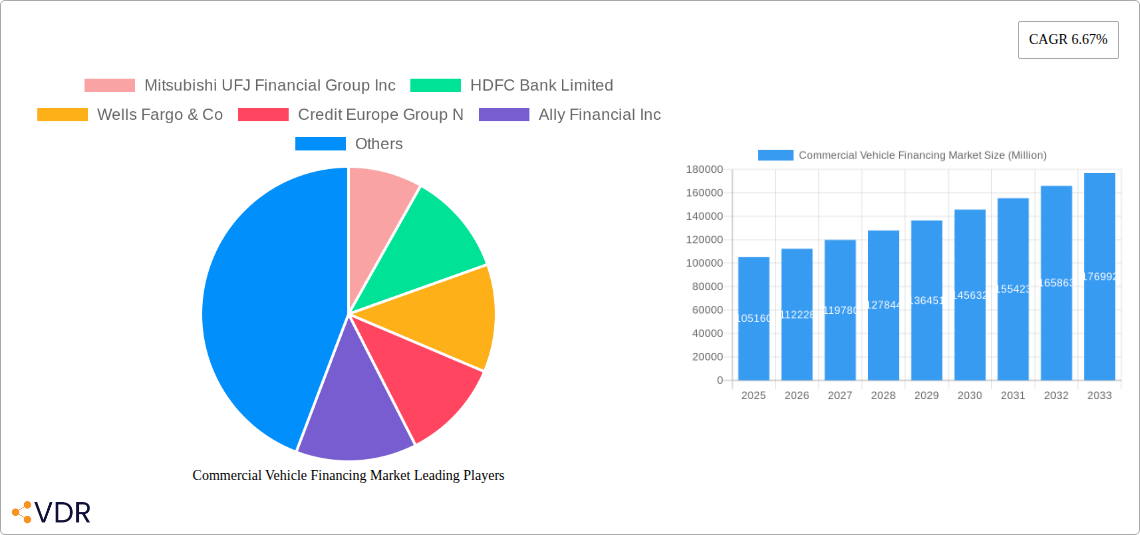
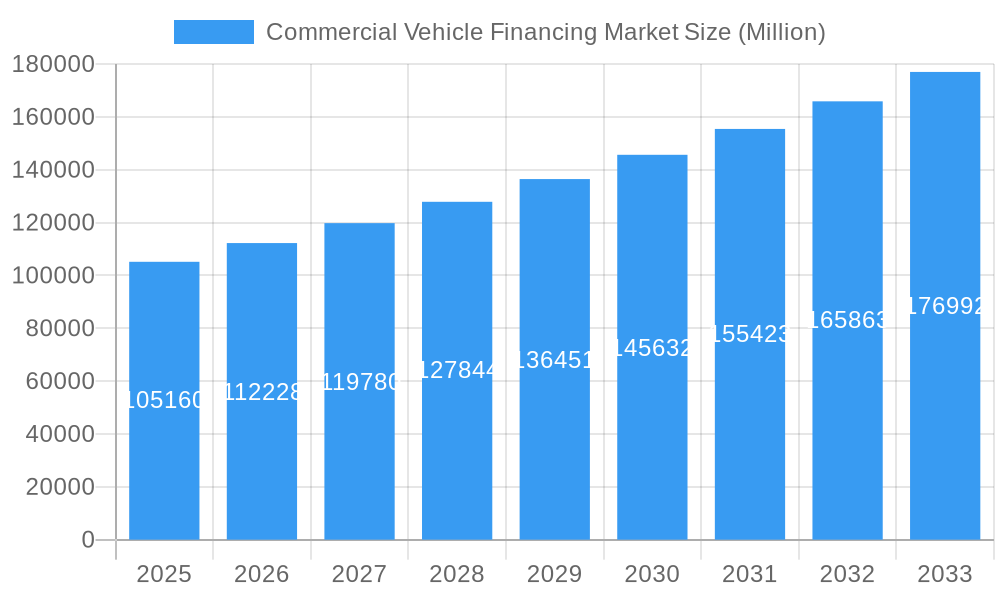
The global Commercial Vehicle Financing Market, valued at $105.16 billion in 2025, is projected to experience robust growth, driven by a Compound Annual Growth Rate (CAGR) of 6.67% from 2025 to 2033. This expansion is fueled by several key factors. The increasing demand for commercial vehicles across various sectors, including logistics, transportation, and construction, is a primary driver. Furthermore, favorable government policies promoting infrastructure development and easing lending regulations in several regions contribute to market growth. The rising adoption of online financing platforms and digital lending solutions streamlines the process, making financing more accessible to a wider range of businesses. Growth is also spurred by the increasing preference for leasing options, offering greater flexibility and reduced upfront capital expenditure for businesses. However, economic fluctuations, particularly interest rate hikes and potential recessions, pose a significant restraint on market growth. Fluctuations in fuel prices and the overall economic health of key commercial vehicle-dependent industries also create uncertainty. The market is segmented by provider type (banks, OEMs, NBFCs, others), financing type (loans, leasing), vehicle condition (new, used), and vehicle type (light, medium & heavy-duty, buses & coaches). This segmentation reflects the diverse nature of the market and the varying needs of different customer segments. The geographic distribution reveals strong growth potential across various regions, particularly in rapidly developing economies of Asia-Pacific, where infrastructure development is driving demand for commercial vehicles.
Commercial Vehicle Financing Market Market Size (In Billion)
The competitive landscape is characterized by a mix of established banks, specialized financial institutions, and OEM captive finance arms. Key players like Mitsubishi UFJ Financial Group, HDFC Bank, Wells Fargo, and others are vying for market share through innovative product offerings, competitive pricing, and strategic partnerships. The market is expected to witness further consolidation as larger players acquire smaller entities to enhance their market reach and service capabilities. The increasing integration of technology and data analytics allows for more sophisticated risk assessment and personalized financing solutions, further shaping market dynamics. While economic headwinds might temporarily dampen growth, the long-term outlook remains positive, driven by sustained demand for commercial vehicles and innovative financing options. The market is poised to witness significant transformation in the coming years, characterized by increasing digitization, enhanced customer experience, and more sustainable financing solutions.
Commercial Vehicle Financing Market Company Market Share
Commercial Vehicle Financing Market: A Comprehensive Report (2019-2033)
This in-depth report provides a comprehensive analysis of the Commercial Vehicle Financing Market, encompassing market dynamics, growth trends, regional insights, and key players. The report covers the period from 2019 to 2033, with a base year of 2025 and a forecast period from 2025 to 2033. It segments the market by provider type (Banks, OEMs, NBFCs, Others), financing type (Loans, Leasing), vehicle condition (New, Used), and vehicle type (Light Commercial Vehicles, Medium & Heavy-Duty Commercial Vehicles, Buses & Coaches). The market size is presented in million units.
Commercial Vehicle Financing Market Dynamics & Structure
The Commercial Vehicle Financing Market is characterized by a moderately concentrated landscape, with key players holding significant market shares. The market's structure is influenced by technological innovation, regulatory frameworks, and the presence of competitive product substitutes. End-user demographics, particularly the growth of e-commerce and last-mile delivery services, significantly impact demand for commercial vehicles and associated financing. Mergers and acquisitions (M&A) activity contributes to market consolidation and expansion.
- Market Concentration: The top 5 players hold approximately xx% of the market share in 2025 (estimated).
- Technological Innovation: Digitalization and fintech solutions are driving efficiency and accessibility in financing options. However, challenges remain in integrating legacy systems and ensuring data security.
- Regulatory Frameworks: Varying regulations across regions affect lending practices and interest rates, creating opportunities for specialized providers.
- Competitive Substitutes: Alternative financing options, such as peer-to-peer lending platforms, pose a growing competitive threat.
- End-User Demographics: The increasing demand for e-commerce deliveries and improved logistics are fueling the growth of the light commercial vehicle segment.
- M&A Trends: An average of xx M&A deals per year were observed during the historical period (2019-2024), primarily focused on expanding geographic reach and service offerings.
Commercial Vehicle Financing Market Growth Trends & Insights
The Commercial Vehicle Financing Market is experiencing robust growth, driven by increasing commercial vehicle sales, favorable economic conditions in key regions, and the rising adoption of financing options by businesses of all sizes. Technological disruptions, such as the emergence of digital lending platforms and online financing options, are streamlining the process and expanding accessibility. Consumer behavior shifts, including a preference for leasing over outright purchase in some segments, are shaping market dynamics.
The market size is projected to reach xx million units by 2033, with a Compound Annual Growth Rate (CAGR) of xx% during the forecast period (2025-2033). Market penetration is expected to increase by xx% by 2033. This growth is fueled by factors such as government initiatives promoting infrastructure development and the expansion of logistics networks. Technological advancements, such as telematics-based risk assessment, improve lending decisions and reduce defaults.
Dominant Regions, Countries, or Segments in Commercial Vehicle Financing Market
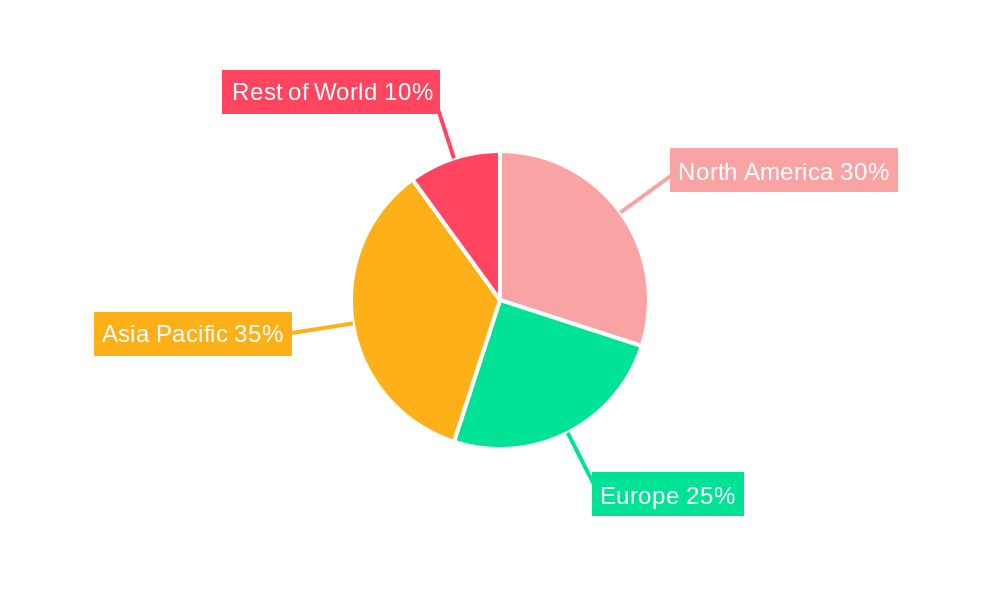
The Asia-Pacific region is currently the dominant market, driven by strong economic growth, a large and expanding commercial vehicle fleet, and favorable government policies. Within this region, India and China are key contributors. However, Europe and North America also exhibit significant market potential, particularly within the segments of medium and heavy-duty vehicles and specialized commercial vehicles.
By Provider Type: Banks hold the largest market share, followed by NBFCs and OEMs.
- Banks: Benefit from extensive branch networks and established customer relationships.
- OEMs: Offer captive financing solutions, enhancing customer loyalty and streamlining the sales process.
- NBFCs: Provide flexible and specialized financing options catering to niche customer segments.
By Financing Type: Loans currently dominate the market, while leasing is experiencing a steady growth rate, particularly in the segments of medium and heavy-duty vehicles and new commercial vehicles.
- Loans: Offer predictable repayment schedules and are preferred by businesses with stable cash flows.
- Leasing: Reduces upfront capital expenditure and offers greater flexibility in managing vehicle assets.
By Vehicle Condition: Financing for new commercial vehicles constitutes the largest segment; however, the market for used commercial vehicle financing is growing rapidly.
Commercial Vehicle Financing Market Product Landscape
The commercial vehicle financing landscape is witnessing innovations in digital platforms that offer seamless online applications, faster approvals, and transparent pricing. These platforms utilize data analytics and machine learning to assess creditworthiness and personalize financing options. The increasing adoption of telematics technologies enhances risk management by enabling real-time monitoring of vehicle usage and performance, leading to more accurate assessments and improved risk mitigation strategies. Unique selling propositions focus on customized financing solutions tailored to specific customer needs and industry segments.
Key Drivers, Barriers & Challenges in Commercial Vehicle Financing Market
Key Drivers:
- Growing demand for commercial vehicles, driven by e-commerce and logistics expansion.
- Favorable government policies promoting infrastructure development and economic growth in emerging markets.
- Technological advancements simplifying the financing process and enhancing risk assessment.
Challenges and Restraints:
- Economic downturns and interest rate volatility can impact lending activities and increase default rates. (Estimated impact: xx% reduction in market growth during recessionary periods.)
- Stringent regulatory requirements and compliance costs can increase operational expenses for lenders.
- Intense competition among established players and the emergence of alternative financing options put pressure on profit margins.
Emerging Opportunities in Commercial Vehicle Financing Market
- Expansion into untapped markets in developing economies.
- Development of specialized financing solutions for electric and alternative fuel commercial vehicles.
- Increasing adoption of digital technologies to improve customer experience and operational efficiency.
Growth Accelerators in the Commercial Vehicle Financing Market Industry
Technological innovations, such as AI-powered credit scoring and blockchain-based secure transaction platforms, will significantly enhance efficiency and transparency. Strategic partnerships between financing institutions and commercial vehicle manufacturers are streamlining the financing process and improving customer access. The expansion of financing options into emerging markets with high growth potential will contribute to sustained market growth.
Key Players Shaping the Commercial Vehicle Financing Market Market
- Mitsubishi UFJ Financial Group Inc
- HDFC Bank Limited
- Wells Fargo & Co
- Credit Europe Group N
- Ally Financial Inc
- Volkswagen Financial Services
- Tata Motors Finance
- Bank of China
- NatWest (Lombard North Central)
- Mahindra Finance
- Standard Bank Group Ltd
- Toyota Financial Services
- Bank of America Corporation
Notable Milestones in Commercial Vehicle Financing Sector
- February 2024: Tata Motors and Bandhan Bank partnership for commercial vehicle financing in India.
- December 2023: HDFC Bank and Tata Motors collaboration on digital financing solutions.
- October 2023: Zeekr's partnership with BNP Paribas and Arval for financing, leasing, and insurance services in Europe.
In-Depth Commercial Vehicle Financing Market Outlook
The Commercial Vehicle Financing Market exhibits substantial growth potential, fueled by the increasing adoption of commercial vehicles across various industries and the continuous evolution of financing solutions. Strategic partnerships, technological advancements, and expansion into underserved markets present significant opportunities for growth and innovation. The market's future is bright, promising considerable returns for investors and stakeholders who actively participate and adapt to emerging trends.
Commercial Vehicle Financing Market Segmentation
-
1. Provider Type
- 1.1. Banks
- 1.2. Original Equipment Manufacturers (OEMs)
- 1.3. Non-Banking Financial Companies (NBFCs)
- 1.4. Others (Credit Unions, etc.)
-
2. Financing Type
- 2.1. Loans
- 2.2. Leasing
-
3. Vehicle Condition
- 3.1. New Commercial Vehicles
- 3.2. Used Commercial Vehicles
-
4. Vehicle Type
- 4.1. Light Commercial Vehicles
- 4.2. Medium and Heavy-Duty Commercial Vehicles
- 4.3. Buses and Coaches
Commercial Vehicle Financing Market Segmentation By Geography
-
1. North America
- 1.1. United States
- 1.2. Canada
- 1.3. Rest of North America
-
2. Europe
- 2.1. Germany
- 2.2. United Kingdom
- 2.3. France
- 2.4. Italy
- 2.5. Rest of Europe
-
3. Asia Pacific
- 3.1. China
- 3.2. India
- 3.3. Japan
- 3.4. South Korea
- 3.5. Rest of Asia Pacific
-
4. Rest of the World
- 4.1. South America
- 4.2. Middle East and Africa
Commercial Vehicle Financing Market Regional Market Share
Geographic Coverage of Commercial Vehicle Financing Market
Commercial Vehicle Financing Market REPORT HIGHLIGHTS
| Aspects | Details |
|---|---|
| Study Period | 2020-2034 |
| Base Year | 2025 |
| Estimated Year | 2026 |
| Forecast Period | 2026-2034 |
| Historical Period | 2020-2025 |
| Growth Rate | CAGR of 6.67% from 2020-2034 |
| Segmentation |
|
Table of Contents
- 1. Introduction
- 1.1. Research Scope
- 1.2. Market Segmentation
- 1.3. Research Objective
- 1.4. Definitions and Assumptions
- 2. Executive Summary
- 2.1. Market Snapshot
- 3. Market Dynamics
- 3.1. Market Drivers
- 3.2. Market Restrains
- 3.3. Market Trends
- 3.4. Market Opportunities
- 4. Market Factor Analysis
- 4.1. Porters Five Forces
- 4.1.1. Bargaining Power of Suppliers
- 4.1.2. Bargaining Power of Buyers
- 4.1.3. Threat of New Entrants
- 4.1.4. Threat of Substitutes
- 4.1.5. Competitive Rivalry
- 4.2. PESTEL analysis
- 4.3. BCG Analysis
- 4.3.1. Stars (High Growth, High Market Share)
- 4.3.2. Cash Cows (Low Growth, High Market Share)
- 4.3.3. Question Mark (High Growth, Low Market Share)
- 4.3.4. Dogs (Low Growth, Low Market Share)
- 4.4. Ansoff Matrix Analysis
- 4.5. Supply Chain Analysis
- 4.6. Regulatory Landscape
- 4.7. Current Market Potential and Opportunity Assessment (TAM–SAM–SOM Framework)
- 4.8. VDR Analyst Note
- 4.1. Porters Five Forces
- 5. Market Analysis, Insights and Forecast 2021-2033
- 5.1. Market Analysis, Insights and Forecast - by Provider Type
- 5.1.1. Banks
- 5.1.2. Original Equipment Manufacturers (OEMs)
- 5.1.3. Non-Banking Financial Companies (NBFCs)
- 5.1.4. Others (Credit Unions, etc.)
- 5.2. Market Analysis, Insights and Forecast - by Financing Type
- 5.2.1. Loans
- 5.2.2. Leasing
- 5.3. Market Analysis, Insights and Forecast - by Vehicle Condition
- 5.3.1. New Commercial Vehicles
- 5.3.2. Used Commercial Vehicles
- 5.4. Market Analysis, Insights and Forecast - by Vehicle Type
- 5.4.1. Light Commercial Vehicles
- 5.4.2. Medium and Heavy-Duty Commercial Vehicles
- 5.4.3. Buses and Coaches
- 5.5. Market Analysis, Insights and Forecast - by Region
- 5.5.1. North America
- 5.5.2. Europe
- 5.5.3. Asia Pacific
- 5.5.4. Rest of the World
- 5.1. Market Analysis, Insights and Forecast - by Provider Type
- 6. Global Commercial Vehicle Financing Market Analysis, Insights and Forecast, 2021-2033
- 6.1. Market Analysis, Insights and Forecast - by Provider Type
- 6.1.1. Banks
- 6.1.2. Original Equipment Manufacturers (OEMs)
- 6.1.3. Non-Banking Financial Companies (NBFCs)
- 6.1.4. Others (Credit Unions, etc.)
- 6.2. Market Analysis, Insights and Forecast - by Financing Type
- 6.2.1. Loans
- 6.2.2. Leasing
- 6.3. Market Analysis, Insights and Forecast - by Vehicle Condition
- 6.3.1. New Commercial Vehicles
- 6.3.2. Used Commercial Vehicles
- 6.4. Market Analysis, Insights and Forecast - by Vehicle Type
- 6.4.1. Light Commercial Vehicles
- 6.4.2. Medium and Heavy-Duty Commercial Vehicles
- 6.4.3. Buses and Coaches
- 6.1. Market Analysis, Insights and Forecast - by Provider Type
- 7. North America Commercial Vehicle Financing Market Analysis, Insights and Forecast, 2021-2033
- 7.1. Market Analysis, Insights and Forecast - by Provider Type
- 7.1.1. Banks
- 7.1.2. Original Equipment Manufacturers (OEMs)
- 7.1.3. Non-Banking Financial Companies (NBFCs)
- 7.1.4. Others (Credit Unions, etc.)
- 7.2. Market Analysis, Insights and Forecast - by Financing Type
- 7.2.1. Loans
- 7.2.2. Leasing
- 7.3. Market Analysis, Insights and Forecast - by Vehicle Condition
- 7.3.1. New Commercial Vehicles
- 7.3.2. Used Commercial Vehicles
- 7.4. Market Analysis, Insights and Forecast - by Vehicle Type
- 7.4.1. Light Commercial Vehicles
- 7.4.2. Medium and Heavy-Duty Commercial Vehicles
- 7.4.3. Buses and Coaches
- 7.1. Market Analysis, Insights and Forecast - by Provider Type
- 8. Europe Commercial Vehicle Financing Market Analysis, Insights and Forecast, 2021-2033
- 8.1. Market Analysis, Insights and Forecast - by Provider Type
- 8.1.1. Banks
- 8.1.2. Original Equipment Manufacturers (OEMs)
- 8.1.3. Non-Banking Financial Companies (NBFCs)
- 8.1.4. Others (Credit Unions, etc.)
- 8.2. Market Analysis, Insights and Forecast - by Financing Type
- 8.2.1. Loans
- 8.2.2. Leasing
- 8.3. Market Analysis, Insights and Forecast - by Vehicle Condition
- 8.3.1. New Commercial Vehicles
- 8.3.2. Used Commercial Vehicles
- 8.4. Market Analysis, Insights and Forecast - by Vehicle Type
- 8.4.1. Light Commercial Vehicles
- 8.4.2. Medium and Heavy-Duty Commercial Vehicles
- 8.4.3. Buses and Coaches
- 8.1. Market Analysis, Insights and Forecast - by Provider Type
- 9. Asia Pacific Commercial Vehicle Financing Market Analysis, Insights and Forecast, 2021-2033
- 9.1. Market Analysis, Insights and Forecast - by Provider Type
- 9.1.1. Banks
- 9.1.2. Original Equipment Manufacturers (OEMs)
- 9.1.3. Non-Banking Financial Companies (NBFCs)
- 9.1.4. Others (Credit Unions, etc.)
- 9.2. Market Analysis, Insights and Forecast - by Financing Type
- 9.2.1. Loans
- 9.2.2. Leasing
- 9.3. Market Analysis, Insights and Forecast - by Vehicle Condition
- 9.3.1. New Commercial Vehicles
- 9.3.2. Used Commercial Vehicles
- 9.4. Market Analysis, Insights and Forecast - by Vehicle Type
- 9.4.1. Light Commercial Vehicles
- 9.4.2. Medium and Heavy-Duty Commercial Vehicles
- 9.4.3. Buses and Coaches
- 9.1. Market Analysis, Insights and Forecast - by Provider Type
- 10. Rest of the World Commercial Vehicle Financing Market Analysis, Insights and Forecast, 2021-2033
- 10.1. Market Analysis, Insights and Forecast - by Provider Type
- 10.1.1. Banks
- 10.1.2. Original Equipment Manufacturers (OEMs)
- 10.1.3. Non-Banking Financial Companies (NBFCs)
- 10.1.4. Others (Credit Unions, etc.)
- 10.2. Market Analysis, Insights and Forecast - by Financing Type
- 10.2.1. Loans
- 10.2.2. Leasing
- 10.3. Market Analysis, Insights and Forecast - by Vehicle Condition
- 10.3.1. New Commercial Vehicles
- 10.3.2. Used Commercial Vehicles
- 10.4. Market Analysis, Insights and Forecast - by Vehicle Type
- 10.4.1. Light Commercial Vehicles
- 10.4.2. Medium and Heavy-Duty Commercial Vehicles
- 10.4.3. Buses and Coaches
- 10.1. Market Analysis, Insights and Forecast - by Provider Type
- 11. Competitive Analysis
- 11.1. Company Profiles
- 11.1.1 Mitsubishi UFJ Financial Group Inc
- 11.1.1.1. Company Overview
- 11.1.1.2. Products
- 11.1.1.3. Company Financials
- 11.1.1.4. SWOT Analysis
- 11.1.2 HDFC Bank Limited
- 11.1.2.1. Company Overview
- 11.1.2.2. Products
- 11.1.2.3. Company Financials
- 11.1.2.4. SWOT Analysis
- 11.1.3 Wells Fargo & Co
- 11.1.3.1. Company Overview
- 11.1.3.2. Products
- 11.1.3.3. Company Financials
- 11.1.3.4. SWOT Analysis
- 11.1.4 Credit Europe Group N
- 11.1.4.1. Company Overview
- 11.1.4.2. Products
- 11.1.4.3. Company Financials
- 11.1.4.4. SWOT Analysis
- 11.1.5 Ally Financial Inc
- 11.1.5.1. Company Overview
- 11.1.5.2. Products
- 11.1.5.3. Company Financials
- 11.1.5.4. SWOT Analysis
- 11.1.6 Volkswagen Financial Services
- 11.1.6.1. Company Overview
- 11.1.6.2. Products
- 11.1.6.3. Company Financials
- 11.1.6.4. SWOT Analysis
- 11.1.7 Tata Motors Finance
- 11.1.7.1. Company Overview
- 11.1.7.2. Products
- 11.1.7.3. Company Financials
- 11.1.7.4. SWOT Analysis
- 11.1.8 Bank of China
- 11.1.8.1. Company Overview
- 11.1.8.2. Products
- 11.1.8.3. Company Financials
- 11.1.8.4. SWOT Analysis
- 11.1.9 NatWest (Lombard North Central)
- 11.1.9.1. Company Overview
- 11.1.9.2. Products
- 11.1.9.3. Company Financials
- 11.1.9.4. SWOT Analysis
- 11.1.10 Mahindra Finance
- 11.1.10.1. Company Overview
- 11.1.10.2. Products
- 11.1.10.3. Company Financials
- 11.1.10.4. SWOT Analysis
- 11.1.11 Standard Bank Group Ltd
- 11.1.11.1. Company Overview
- 11.1.11.2. Products
- 11.1.11.3. Company Financials
- 11.1.11.4. SWOT Analysis
- 11.1.12 Toyota Financial Services
- 11.1.12.1. Company Overview
- 11.1.12.2. Products
- 11.1.12.3. Company Financials
- 11.1.12.4. SWOT Analysis
- 11.1.13 Bank of America Corporation
- 11.1.13.1. Company Overview
- 11.1.13.2. Products
- 11.1.13.3. Company Financials
- 11.1.13.4. SWOT Analysis
- 11.1.1 Mitsubishi UFJ Financial Group Inc
- 11.2. Market Entropy
- 11.2.1 Company's Key Areas Served
- 11.2.2 Recent Developments
- 11.3. Company Market Share Analysis 2025
- 11.3.1 Top 5 Companies Market Share Analysis
- 11.3.2 Top 3 Companies Market Share Analysis
- 11.4. List of Potential Customers
- 12. Research Methodology
List of Figures
- Figure 1: Global Commercial Vehicle Financing Market Revenue Breakdown (Million, %) by Region 2025 & 2033
- Figure 2: North America Commercial Vehicle Financing Market Revenue (Million), by Provider Type 2025 & 2033
- Figure 3: North America Commercial Vehicle Financing Market Revenue Share (%), by Provider Type 2025 & 2033
- Figure 4: North America Commercial Vehicle Financing Market Revenue (Million), by Financing Type 2025 & 2033
- Figure 5: North America Commercial Vehicle Financing Market Revenue Share (%), by Financing Type 2025 & 2033
- Figure 6: North America Commercial Vehicle Financing Market Revenue (Million), by Vehicle Condition 2025 & 2033
- Figure 7: North America Commercial Vehicle Financing Market Revenue Share (%), by Vehicle Condition 2025 & 2033
- Figure 8: North America Commercial Vehicle Financing Market Revenue (Million), by Vehicle Type 2025 & 2033
- Figure 9: North America Commercial Vehicle Financing Market Revenue Share (%), by Vehicle Type 2025 & 2033
- Figure 10: North America Commercial Vehicle Financing Market Revenue (Million), by Country 2025 & 2033
- Figure 11: North America Commercial Vehicle Financing Market Revenue Share (%), by Country 2025 & 2033
- Figure 12: Europe Commercial Vehicle Financing Market Revenue (Million), by Provider Type 2025 & 2033
- Figure 13: Europe Commercial Vehicle Financing Market Revenue Share (%), by Provider Type 2025 & 2033
- Figure 14: Europe Commercial Vehicle Financing Market Revenue (Million), by Financing Type 2025 & 2033
- Figure 15: Europe Commercial Vehicle Financing Market Revenue Share (%), by Financing Type 2025 & 2033
- Figure 16: Europe Commercial Vehicle Financing Market Revenue (Million), by Vehicle Condition 2025 & 2033
- Figure 17: Europe Commercial Vehicle Financing Market Revenue Share (%), by Vehicle Condition 2025 & 2033
- Figure 18: Europe Commercial Vehicle Financing Market Revenue (Million), by Vehicle Type 2025 & 2033
- Figure 19: Europe Commercial Vehicle Financing Market Revenue Share (%), by Vehicle Type 2025 & 2033
- Figure 20: Europe Commercial Vehicle Financing Market Revenue (Million), by Country 2025 & 2033
- Figure 21: Europe Commercial Vehicle Financing Market Revenue Share (%), by Country 2025 & 2033
- Figure 22: Asia Pacific Commercial Vehicle Financing Market Revenue (Million), by Provider Type 2025 & 2033
- Figure 23: Asia Pacific Commercial Vehicle Financing Market Revenue Share (%), by Provider Type 2025 & 2033
- Figure 24: Asia Pacific Commercial Vehicle Financing Market Revenue (Million), by Financing Type 2025 & 2033
- Figure 25: Asia Pacific Commercial Vehicle Financing Market Revenue Share (%), by Financing Type 2025 & 2033
- Figure 26: Asia Pacific Commercial Vehicle Financing Market Revenue (Million), by Vehicle Condition 2025 & 2033
- Figure 27: Asia Pacific Commercial Vehicle Financing Market Revenue Share (%), by Vehicle Condition 2025 & 2033
- Figure 28: Asia Pacific Commercial Vehicle Financing Market Revenue (Million), by Vehicle Type 2025 & 2033
- Figure 29: Asia Pacific Commercial Vehicle Financing Market Revenue Share (%), by Vehicle Type 2025 & 2033
- Figure 30: Asia Pacific Commercial Vehicle Financing Market Revenue (Million), by Country 2025 & 2033
- Figure 31: Asia Pacific Commercial Vehicle Financing Market Revenue Share (%), by Country 2025 & 2033
- Figure 32: Rest of the World Commercial Vehicle Financing Market Revenue (Million), by Provider Type 2025 & 2033
- Figure 33: Rest of the World Commercial Vehicle Financing Market Revenue Share (%), by Provider Type 2025 & 2033
- Figure 34: Rest of the World Commercial Vehicle Financing Market Revenue (Million), by Financing Type 2025 & 2033
- Figure 35: Rest of the World Commercial Vehicle Financing Market Revenue Share (%), by Financing Type 2025 & 2033
- Figure 36: Rest of the World Commercial Vehicle Financing Market Revenue (Million), by Vehicle Condition 2025 & 2033
- Figure 37: Rest of the World Commercial Vehicle Financing Market Revenue Share (%), by Vehicle Condition 2025 & 2033
- Figure 38: Rest of the World Commercial Vehicle Financing Market Revenue (Million), by Vehicle Type 2025 & 2033
- Figure 39: Rest of the World Commercial Vehicle Financing Market Revenue Share (%), by Vehicle Type 2025 & 2033
- Figure 40: Rest of the World Commercial Vehicle Financing Market Revenue (Million), by Country 2025 & 2033
- Figure 41: Rest of the World Commercial Vehicle Financing Market Revenue Share (%), by Country 2025 & 2033
List of Tables
- Table 1: Global Commercial Vehicle Financing Market Revenue Million Forecast, by Provider Type 2020 & 2033
- Table 2: Global Commercial Vehicle Financing Market Revenue Million Forecast, by Financing Type 2020 & 2033
- Table 3: Global Commercial Vehicle Financing Market Revenue Million Forecast, by Vehicle Condition 2020 & 2033
- Table 4: Global Commercial Vehicle Financing Market Revenue Million Forecast, by Vehicle Type 2020 & 2033
- Table 5: Global Commercial Vehicle Financing Market Revenue Million Forecast, by Region 2020 & 2033
- Table 6: Global Commercial Vehicle Financing Market Revenue Million Forecast, by Provider Type 2020 & 2033
- Table 7: Global Commercial Vehicle Financing Market Revenue Million Forecast, by Financing Type 2020 & 2033
- Table 8: Global Commercial Vehicle Financing Market Revenue Million Forecast, by Vehicle Condition 2020 & 2033
- Table 9: Global Commercial Vehicle Financing Market Revenue Million Forecast, by Vehicle Type 2020 & 2033
- Table 10: Global Commercial Vehicle Financing Market Revenue Million Forecast, by Country 2020 & 2033
- Table 11: United States Commercial Vehicle Financing Market Revenue (Million) Forecast, by Application 2020 & 2033
- Table 12: Canada Commercial Vehicle Financing Market Revenue (Million) Forecast, by Application 2020 & 2033
- Table 13: Rest of North America Commercial Vehicle Financing Market Revenue (Million) Forecast, by Application 2020 & 2033
- Table 14: Global Commercial Vehicle Financing Market Revenue Million Forecast, by Provider Type 2020 & 2033
- Table 15: Global Commercial Vehicle Financing Market Revenue Million Forecast, by Financing Type 2020 & 2033
- Table 16: Global Commercial Vehicle Financing Market Revenue Million Forecast, by Vehicle Condition 2020 & 2033
- Table 17: Global Commercial Vehicle Financing Market Revenue Million Forecast, by Vehicle Type 2020 & 2033
- Table 18: Global Commercial Vehicle Financing Market Revenue Million Forecast, by Country 2020 & 2033
- Table 19: Germany Commercial Vehicle Financing Market Revenue (Million) Forecast, by Application 2020 & 2033
- Table 20: United Kingdom Commercial Vehicle Financing Market Revenue (Million) Forecast, by Application 2020 & 2033
- Table 21: France Commercial Vehicle Financing Market Revenue (Million) Forecast, by Application 2020 & 2033
- Table 22: Italy Commercial Vehicle Financing Market Revenue (Million) Forecast, by Application 2020 & 2033
- Table 23: Rest of Europe Commercial Vehicle Financing Market Revenue (Million) Forecast, by Application 2020 & 2033
- Table 24: Global Commercial Vehicle Financing Market Revenue Million Forecast, by Provider Type 2020 & 2033
- Table 25: Global Commercial Vehicle Financing Market Revenue Million Forecast, by Financing Type 2020 & 2033
- Table 26: Global Commercial Vehicle Financing Market Revenue Million Forecast, by Vehicle Condition 2020 & 2033
- Table 27: Global Commercial Vehicle Financing Market Revenue Million Forecast, by Vehicle Type 2020 & 2033
- Table 28: Global Commercial Vehicle Financing Market Revenue Million Forecast, by Country 2020 & 2033
- Table 29: China Commercial Vehicle Financing Market Revenue (Million) Forecast, by Application 2020 & 2033
- Table 30: India Commercial Vehicle Financing Market Revenue (Million) Forecast, by Application 2020 & 2033
- Table 31: Japan Commercial Vehicle Financing Market Revenue (Million) Forecast, by Application 2020 & 2033
- Table 32: South Korea Commercial Vehicle Financing Market Revenue (Million) Forecast, by Application 2020 & 2033
- Table 33: Rest of Asia Pacific Commercial Vehicle Financing Market Revenue (Million) Forecast, by Application 2020 & 2033
- Table 34: Global Commercial Vehicle Financing Market Revenue Million Forecast, by Provider Type 2020 & 2033
- Table 35: Global Commercial Vehicle Financing Market Revenue Million Forecast, by Financing Type 2020 & 2033
- Table 36: Global Commercial Vehicle Financing Market Revenue Million Forecast, by Vehicle Condition 2020 & 2033
- Table 37: Global Commercial Vehicle Financing Market Revenue Million Forecast, by Vehicle Type 2020 & 2033
- Table 38: Global Commercial Vehicle Financing Market Revenue Million Forecast, by Country 2020 & 2033
- Table 39: South America Commercial Vehicle Financing Market Revenue (Million) Forecast, by Application 2020 & 2033
- Table 40: Middle East and Africa Commercial Vehicle Financing Market Revenue (Million) Forecast, by Application 2020 & 2033
Frequently Asked Questions
1. What is the projected Compound Annual Growth Rate (CAGR) of the Commercial Vehicle Financing Market?
The projected CAGR is approximately 6.67%.
2. Which companies are prominent players in the Commercial Vehicle Financing Market?
Key companies in the market include Mitsubishi UFJ Financial Group Inc, HDFC Bank Limited, Wells Fargo & Co, Credit Europe Group N, Ally Financial Inc, Volkswagen Financial Services, Tata Motors Finance, Bank of China, NatWest (Lombard North Central), Mahindra Finance, Standard Bank Group Ltd, Toyota Financial Services, Bank of America Corporation.
3. What are the main segments of the Commercial Vehicle Financing Market?
The market segments include Provider Type, Financing Type, Vehicle Condition, Vehicle Type.
4. Can you provide details about the market size?
The market size is estimated to be USD 105.16 Million as of 2022.
5. What are some drivers contributing to market growth?
Increasing Commercial Vehicle Sales to Foster the Growth of the Market.
6. What are the notable trends driving market growth?
The Light Commercial Vehicle Segment is Expected to Gain Traction Between 2024 and 2029.
7. Are there any restraints impacting market growth?
Fluctuations in Interest Rates to Hamper the Growth of the Market.
8. Can you provide examples of recent developments in the market?
February 2024: Tata Motors signed a MoU with Bandhan Bank to offer convenient financing solutions to its commercial vehicle customers in India. As per the agreement, Bandhan Bank will offer financing solutions across the entire commercial vehicle portfolio of Tata Motors to ensure that customers can benefit from the bank’s wide network and specially curated easy repayment plans.
9. What pricing options are available for accessing the report?
Pricing options include single-user, multi-user, and enterprise licenses priced at USD 4750, USD 5250, and USD 8750 respectively.
10. Is the market size provided in terms of value or volume?
The market size is provided in terms of value, measured in Million.
11. Are there any specific market keywords associated with the report?
Yes, the market keyword associated with the report is "Commercial Vehicle Financing Market," which aids in identifying and referencing the specific market segment covered.
12. How do I determine which pricing option suits my needs best?
The pricing options vary based on user requirements and access needs. Individual users may opt for single-user licenses, while businesses requiring broader access may choose multi-user or enterprise licenses for cost-effective access to the report.
13. Are there any additional resources or data provided in the Commercial Vehicle Financing Market report?
While the report offers comprehensive insights, it's advisable to review the specific contents or supplementary materials provided to ascertain if additional resources or data are available.
14. How can I stay updated on further developments or reports in the Commercial Vehicle Financing Market?
To stay informed about further developments, trends, and reports in the Commercial Vehicle Financing Market, consider subscribing to industry newsletters, following relevant companies and organizations, or regularly checking reputable industry news sources and publications.
Methodology
Step 1 - Identification of Relevant Samples Size from Population Database


Step 2 - Approaches for Defining Global Market Size (Value, Volume* & Price*)

Note*: In applicable scenarios
Step 3 - Data Sources
Primary Research
- Web Analytics
- Survey Reports
- Research Institute
- Latest Research Reports
- Opinion Leaders
Secondary Research
- Annual Reports
- White Paper
- Latest Press Release
- Industry Association
- Paid Database
- Investor Presentations

Step 4 - Data Triangulation
Involves using different sources of information in order to increase the validity of a study
These sources are likely to be stakeholders in a program - participants, other researchers, program staff, other community members, and so on.
Then we put all data in single framework & apply various statistical tools to find out the dynamic on the market.
During the analysis stage, feedback from the stakeholder groups would be compared to determine areas of agreement as well as areas of divergence