

Key Insights
The global clean coal technology market is poised for significant expansion, driven by escalating energy needs and stringent environmental mandates to curb greenhouse gas emissions. The market, valued at approximately $4.57 billion in the base year 2025, is projected to grow at a robust compound annual growth rate (CAGR) of 6.39% from 2025 to 2033. Key growth drivers include advancements in Carbon Capture, Utilization, and Storage (CCUS), which enhance the sustainability of coal-fired power generation. Furthermore, the widespread adoption of advanced combustion technologies and Flue Gas Desulfurization (FGD) systems in power and industrial sectors significantly reduces harmful emissions like sulfur dioxide. Selective Catalytic Reduction (SCR) systems further improve air quality by mitigating nitrogen oxide emissions. Supportive government incentives and policies, acknowledging coal's continued energy role in certain regions, are also stimulating investment in clean coal solutions.
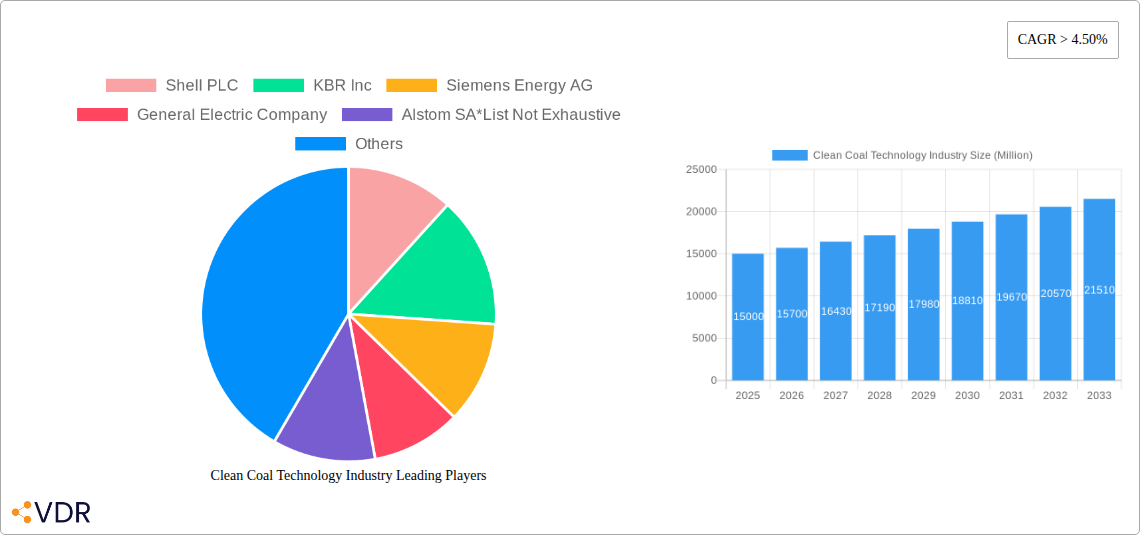
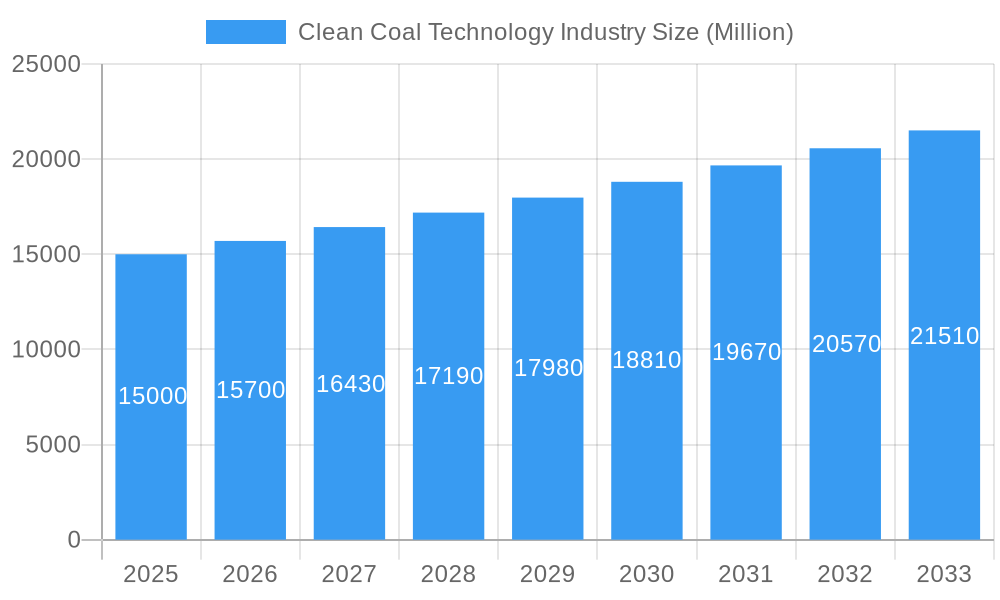
Clean Coal Technology Industry Market Size (In Billion)
Despite a positive growth trajectory, the clean coal technology market encounters challenges, primarily the substantial capital investment required for technology implementation, posing a barrier for smaller enterprises and developing economies. Public perception regarding coal's environmental footprint, even with mitigation technologies, also influences investment and policy decisions. The power generation sector currently leads market segmentation, with growing opportunities in cleaner heating solutions for residential and commercial applications. North America and Asia-Pacific are dominant regions due to established coal infrastructure and ongoing investments. Emerging economies are also demonstrating considerable market expansion as they prioritize emission reduction strategies. Key industry players shaping innovation and competition include Shell PLC, KBR Inc, Siemens Energy AG, General Electric Company, and Alstom SA.
Clean Coal Technology Industry Company Market Share
Clean Coal Technology Industry Market Report: 2019-2033
This comprehensive report provides a detailed analysis of the Clean Coal Technology (CCT) industry, offering invaluable insights for industry professionals, investors, and policymakers. With a focus on market dynamics, growth trends, and key players, this report covers the period from 2019 to 2033, with a base year of 2025. The report segments the market by technology (CCS, Advanced Combustion, FGD, SCR) and application (Power Generation, Industrial Processes, Residential & Commercial Heating), providing a granular understanding of this evolving sector. The total market size is projected to reach xx Million by 2033.
Clean Coal Technology Industry Market Dynamics & Structure
The Clean Coal Technology market is characterized by a moderately concentrated landscape with several multinational corporations holding significant market share. Technological innovation, particularly in carbon capture and storage (CCS), is a key driver, alongside increasingly stringent environmental regulations pushing for cleaner energy solutions. Competition from renewable energy sources presents a significant challenge, while mergers and acquisitions (M&A) activity remains a strategic tool for market consolidation.
- Market Concentration: The top 5 players hold approximately xx% of the global market share in 2025.
- Technological Innovation: Significant investments in R&D are focused on improving CCS efficiency and reducing costs, while advanced combustion technologies are gaining traction.
- Regulatory Framework: Government policies and carbon emission regulations heavily influence market growth, creating both opportunities and challenges.
- Competitive Substitutes: Renewable energy sources (solar, wind, hydro) pose the most significant competitive threat.
- End-User Demographics: The power generation sector remains the largest end-user, followed by industrial processes. Residential and commercial applications are growing but still represent a smaller segment.
- M&A Trends: The number of M&A deals in the CCT sector averaged xx per year during the historical period (2019-2024), primarily driven by strategic acquisitions to expand technological capabilities and market reach.
Clean Coal Technology Industry Growth Trends & Insights
The global Clean Coal Technology market experienced a Compound Annual Growth Rate (CAGR) of xx% during the historical period (2019-2024) and is projected to maintain a CAGR of xx% from 2025 to 2033. This growth is driven by increasing demand for electricity, particularly in developing economies, coupled with the need to mitigate greenhouse gas emissions from coal-fired power plants. However, the adoption rate of CCT technologies varies significantly across regions due to factors like economic development, regulatory environments, and technological readiness. Technological advancements, particularly in CCS and advanced combustion, are key catalysts for market expansion. Consumer behavior, while largely indirect, influences growth through energy demand and environmental consciousness. Market penetration of CCS is expected to reach xx% by 2033, while advanced combustion technologies will likely reach xx%.
Dominant Regions, Countries, or Segments in Clean Coal Technology Industry
The Asia-Pacific region is expected to dominate the Clean Coal Technology market throughout the forecast period, driven primarily by China and India's substantial coal-fired power generation capacity and ongoing investments in CCT technologies. Europe also holds a significant market share due to stringent environmental regulations and government support for clean energy initiatives. Within the technology segments, CCS is projected to experience the highest growth rate, driven by increasing carbon pricing and the need to decarbonize the power sector. In terms of applications, the power generation sector will continue to be the largest consumer of CCT technologies.
- Key Drivers in Asia-Pacific: Rapid industrialization, increasing energy demand, and supportive government policies.
- Key Drivers in Europe: Stringent environmental regulations, carbon pricing mechanisms, and investments in clean energy research.
- Technology Segment Dominance: CCS is projected to dominate due to its potential for significant emissions reduction.
- Application Segment Dominance: Power generation remains the largest application segment.
Clean Coal Technology Industry Product Landscape
The CCT market offers a diverse range of products, including CCS systems (pre-combustion, post-combustion, oxy-fuel), advanced combustion technologies (pulverized coal, fluidized bed combustion), FGD systems, and SCR systems. Innovation focuses on improving the efficiency and cost-effectiveness of these technologies, alongside reducing their environmental footprint. Key selling propositions include emissions reduction, enhanced energy efficiency, and improved plant reliability. Technological advancements are centered on developing more efficient and cost-effective CCS solutions, along with integrating multiple CCT technologies for maximized impact.
Key Drivers, Barriers & Challenges in Clean Coal Technology Industry
Key Drivers: Stringent environmental regulations, increasing energy demand, advancements in CCS technology, and government incentives for clean coal technologies are primary drivers. For example, the EU Emissions Trading System (ETS) has incentivized the adoption of CCT technologies.
Challenges: High capital costs associated with implementing CCT technologies, technological complexities in deploying CCS, and competition from renewable energy sources pose significant challenges. Supply chain disruptions related to critical components can also impact project timelines and costs. Regulatory uncertainties and inconsistent policy frameworks create barriers to investment. The estimated cost of implementing CCS technology is currently a major restraint, with an estimated additional cost of xx Million per GW of power plant capacity.
Emerging Opportunities in Clean Coal Technology Industry
Emerging opportunities lie in integrating CCT technologies with renewable energy sources (hybrid power plants), expanding into developing economies with large coal-fired power plants, and developing innovative applications in industrial processes beyond power generation. The focus on carbon capture utilization and storage (CCUS) presents a significant opportunity for value creation beyond simple emissions reduction. Furthermore, advancements in AI and machine learning offer potential for optimizing CCT system performance and reducing operational costs.
Growth Accelerators in the Clean Coal Technology Industry
Technological breakthroughs in CCS and advanced combustion, particularly in reducing costs and improving efficiency, are crucial growth accelerators. Strategic partnerships between technology providers, power plant operators, and government agencies are vital for facilitating technology deployment. Expansion into new markets, especially in developing countries, and diversification into industrial process applications, contribute to long-term market expansion.
Key Players Shaping the Clean Coal Technology Industry Market
- Shell PLC
- KBR Inc
- Siemens Energy AG
- General Electric Company
- Alstom SA
- List Not Exhaustive
Notable Milestones in Clean Coal Technology Industry Sector
- February 2022: The Indian Institute of Chemical Technology (IICT) announced a collaborative project with Northern Coalfields Limits (NCL) for R&D in sustainable mining and clean coal technologies.
- October 2021: Adani Power Limited announced plans to commission the Godda Ultra Super Critical coal thermal power project, increasing the demand for CCT technologies.
In-Depth Clean Coal Technology Industry Market Outlook
The Clean Coal Technology market is poised for significant growth over the next decade, driven by the continued need to reduce greenhouse gas emissions from coal-fired power plants and the ongoing advancements in CCS and other CCT technologies. Strategic investments in R&D, supportive government policies, and strategic partnerships will play a crucial role in shaping the future of this industry. The potential for CCUS technologies to unlock new revenue streams presents a compelling opportunity for market expansion and innovation.
Clean Coal Technology Industry Segmentation
- 1. Production Analysis
- 2. Consumption Analysis
- 3. Import Market Analysis (Value & Volume)
- 4. Export Market Analysis (Value & Volume)
- 5. Price Trend Analysis
Clean Coal Technology Industry Segmentation By Geography
- 1. North America
- 2. Europe
- 3. Asia Pacific
- 4. Middle East and Africa
- 5. South America
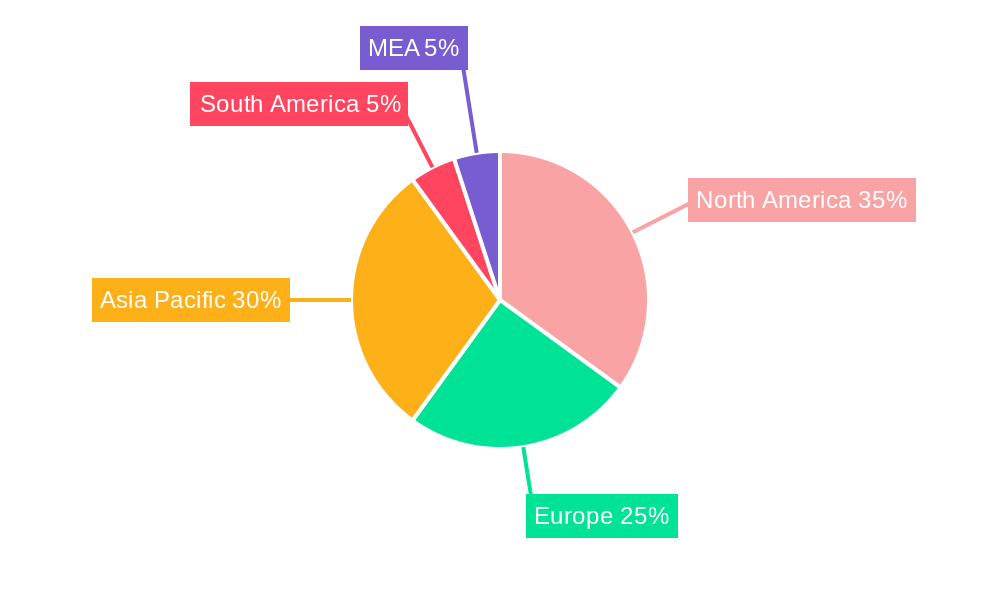
Clean Coal Technology Industry Regional Market Share
Geographic Coverage of Clean Coal Technology Industry
Clean Coal Technology Industry REPORT HIGHLIGHTS
| Aspects | Details |
|---|---|
| Study Period | 2020-2034 |
| Base Year | 2025 |
| Estimated Year | 2026 |
| Forecast Period | 2026-2034 |
| Historical Period | 2020-2025 |
| Growth Rate | CAGR of 6.39% from 2020-2034 |
| Segmentation |
|
Table of Contents
- 1. Introduction
- 1.1. Research Scope
- 1.2. Market Segmentation
- 1.3. Research Objective
- 1.4. Definitions and Assumptions
- 2. Executive Summary
- 2.1. Market Snapshot
- 3. Market Dynamics
- 3.1. Market Drivers
- 3.2. Market Restrains
- 3.3. Market Trends
- 3.4. Market Opportunities
- 4. Market Factor Analysis
- 4.1. Porters Five Forces
- 4.1.1. Bargaining Power of Suppliers
- 4.1.2. Bargaining Power of Buyers
- 4.1.3. Threat of New Entrants
- 4.1.4. Threat of Substitutes
- 4.1.5. Competitive Rivalry
- 4.2. PESTEL analysis
- 4.3. BCG Analysis
- 4.3.1. Stars (High Growth, High Market Share)
- 4.3.2. Cash Cows (Low Growth, High Market Share)
- 4.3.3. Question Mark (High Growth, Low Market Share)
- 4.3.4. Dogs (Low Growth, Low Market Share)
- 4.4. Ansoff Matrix Analysis
- 4.5. Supply Chain Analysis
- 4.6. Regulatory Landscape
- 4.7. Current Market Potential and Opportunity Assessment (TAM–SAM–SOM Framework)
- 4.8. VDR Analyst Note
- 4.1. Porters Five Forces
- 5. Market Analysis, Insights and Forecast 2021-2033
- 5.1. Market Analysis, Insights and Forecast - by Production Analysis
- 5.2. Market Analysis, Insights and Forecast - by Consumption Analysis
- 5.3. Market Analysis, Insights and Forecast - by Import Market Analysis (Value & Volume)
- 5.4. Market Analysis, Insights and Forecast - by Export Market Analysis (Value & Volume)
- 5.5. Market Analysis, Insights and Forecast - by Price Trend Analysis
- 5.6. Market Analysis, Insights and Forecast - by Region
- 5.6.1. North America
- 5.6.2. Europe
- 5.6.3. Asia Pacific
- 5.6.4. Middle East and Africa
- 5.6.5. South America
- 6. Global Clean Coal Technology Industry Analysis, Insights and Forecast, 2021-2033
- 6.1. Market Analysis, Insights and Forecast - by Production Analysis
- 6.2. Market Analysis, Insights and Forecast - by Consumption Analysis
- 6.3. Market Analysis, Insights and Forecast - by Import Market Analysis (Value & Volume)
- 6.4. Market Analysis, Insights and Forecast - by Export Market Analysis (Value & Volume)
- 6.5. Market Analysis, Insights and Forecast - by Price Trend Analysis
- 7. North America Clean Coal Technology Industry Analysis, Insights and Forecast, 2021-2033
- 7.1. Market Analysis, Insights and Forecast - by Production Analysis
- 7.2. Market Analysis, Insights and Forecast - by Consumption Analysis
- 7.3. Market Analysis, Insights and Forecast - by Import Market Analysis (Value & Volume)
- 7.4. Market Analysis, Insights and Forecast - by Export Market Analysis (Value & Volume)
- 7.5. Market Analysis, Insights and Forecast - by Price Trend Analysis
- 8. Europe Clean Coal Technology Industry Analysis, Insights and Forecast, 2021-2033
- 8.1. Market Analysis, Insights and Forecast - by Production Analysis
- 8.2. Market Analysis, Insights and Forecast - by Consumption Analysis
- 8.3. Market Analysis, Insights and Forecast - by Import Market Analysis (Value & Volume)
- 8.4. Market Analysis, Insights and Forecast - by Export Market Analysis (Value & Volume)
- 8.5. Market Analysis, Insights and Forecast - by Price Trend Analysis
- 9. Asia Pacific Clean Coal Technology Industry Analysis, Insights and Forecast, 2021-2033
- 9.1. Market Analysis, Insights and Forecast - by Production Analysis
- 9.2. Market Analysis, Insights and Forecast - by Consumption Analysis
- 9.3. Market Analysis, Insights and Forecast - by Import Market Analysis (Value & Volume)
- 9.4. Market Analysis, Insights and Forecast - by Export Market Analysis (Value & Volume)
- 9.5. Market Analysis, Insights and Forecast - by Price Trend Analysis
- 10. Middle East and Africa Clean Coal Technology Industry Analysis, Insights and Forecast, 2021-2033
- 10.1. Market Analysis, Insights and Forecast - by Production Analysis
- 10.2. Market Analysis, Insights and Forecast - by Consumption Analysis
- 10.3. Market Analysis, Insights and Forecast - by Import Market Analysis (Value & Volume)
- 10.4. Market Analysis, Insights and Forecast - by Export Market Analysis (Value & Volume)
- 10.5. Market Analysis, Insights and Forecast - by Price Trend Analysis
- 11. South America Clean Coal Technology Industry Analysis, Insights and Forecast, 2021-2033
- 11.1. Market Analysis, Insights and Forecast - by Production Analysis
- 11.2. Market Analysis, Insights and Forecast - by Consumption Analysis
- 11.3. Market Analysis, Insights and Forecast - by Import Market Analysis (Value & Volume)
- 11.4. Market Analysis, Insights and Forecast - by Export Market Analysis (Value & Volume)
- 11.5. Market Analysis, Insights and Forecast - by Price Trend Analysis
- 12. Competitive Analysis
- 12.1. Company Profiles
- 12.1.1 Shell PLC
- 12.1.1.1. Company Overview
- 12.1.1.2. Products
- 12.1.1.3. Company Financials
- 12.1.1.4. SWOT Analysis
- 12.1.2 KBR Inc
- 12.1.2.1. Company Overview
- 12.1.2.2. Products
- 12.1.2.3. Company Financials
- 12.1.2.4. SWOT Analysis
- 12.1.3 Siemens Energy AG
- 12.1.3.1. Company Overview
- 12.1.3.2. Products
- 12.1.3.3. Company Financials
- 12.1.3.4. SWOT Analysis
- 12.1.4 General Electric Company
- 12.1.4.1. Company Overview
- 12.1.4.2. Products
- 12.1.4.3. Company Financials
- 12.1.4.4. SWOT Analysis
- 12.1.5 Alstom SA*List Not Exhaustive
- 12.1.5.1. Company Overview
- 12.1.5.2. Products
- 12.1.5.3. Company Financials
- 12.1.5.4. SWOT Analysis
- 12.1.1 Shell PLC
- 12.2. Market Entropy
- 12.2.1 Company's Key Areas Served
- 12.2.2 Recent Developments
- 12.3. Company Market Share Analysis 2025
- 12.3.1 Top 5 Companies Market Share Analysis
- 12.3.2 Top 3 Companies Market Share Analysis
- 12.4. List of Potential Customers
- 13. Research Methodology
List of Figures
- Figure 1: Global Clean Coal Technology Industry Revenue Breakdown (billion, %) by Region 2025 & 2033
- Figure 2: North America Clean Coal Technology Industry Revenue (billion), by Production Analysis 2025 & 2033
- Figure 3: North America Clean Coal Technology Industry Revenue Share (%), by Production Analysis 2025 & 2033
- Figure 4: North America Clean Coal Technology Industry Revenue (billion), by Consumption Analysis 2025 & 2033
- Figure 5: North America Clean Coal Technology Industry Revenue Share (%), by Consumption Analysis 2025 & 2033
- Figure 6: North America Clean Coal Technology Industry Revenue (billion), by Import Market Analysis (Value & Volume) 2025 & 2033
- Figure 7: North America Clean Coal Technology Industry Revenue Share (%), by Import Market Analysis (Value & Volume) 2025 & 2033
- Figure 8: North America Clean Coal Technology Industry Revenue (billion), by Export Market Analysis (Value & Volume) 2025 & 2033
- Figure 9: North America Clean Coal Technology Industry Revenue Share (%), by Export Market Analysis (Value & Volume) 2025 & 2033
- Figure 10: North America Clean Coal Technology Industry Revenue (billion), by Price Trend Analysis 2025 & 2033
- Figure 11: North America Clean Coal Technology Industry Revenue Share (%), by Price Trend Analysis 2025 & 2033
- Figure 12: North America Clean Coal Technology Industry Revenue (billion), by Country 2025 & 2033
- Figure 13: North America Clean Coal Technology Industry Revenue Share (%), by Country 2025 & 2033
- Figure 14: Europe Clean Coal Technology Industry Revenue (billion), by Production Analysis 2025 & 2033
- Figure 15: Europe Clean Coal Technology Industry Revenue Share (%), by Production Analysis 2025 & 2033
- Figure 16: Europe Clean Coal Technology Industry Revenue (billion), by Consumption Analysis 2025 & 2033
- Figure 17: Europe Clean Coal Technology Industry Revenue Share (%), by Consumption Analysis 2025 & 2033
- Figure 18: Europe Clean Coal Technology Industry Revenue (billion), by Import Market Analysis (Value & Volume) 2025 & 2033
- Figure 19: Europe Clean Coal Technology Industry Revenue Share (%), by Import Market Analysis (Value & Volume) 2025 & 2033
- Figure 20: Europe Clean Coal Technology Industry Revenue (billion), by Export Market Analysis (Value & Volume) 2025 & 2033
- Figure 21: Europe Clean Coal Technology Industry Revenue Share (%), by Export Market Analysis (Value & Volume) 2025 & 2033
- Figure 22: Europe Clean Coal Technology Industry Revenue (billion), by Price Trend Analysis 2025 & 2033
- Figure 23: Europe Clean Coal Technology Industry Revenue Share (%), by Price Trend Analysis 2025 & 2033
- Figure 24: Europe Clean Coal Technology Industry Revenue (billion), by Country 2025 & 2033
- Figure 25: Europe Clean Coal Technology Industry Revenue Share (%), by Country 2025 & 2033
- Figure 26: Asia Pacific Clean Coal Technology Industry Revenue (billion), by Production Analysis 2025 & 2033
- Figure 27: Asia Pacific Clean Coal Technology Industry Revenue Share (%), by Production Analysis 2025 & 2033
- Figure 28: Asia Pacific Clean Coal Technology Industry Revenue (billion), by Consumption Analysis 2025 & 2033
- Figure 29: Asia Pacific Clean Coal Technology Industry Revenue Share (%), by Consumption Analysis 2025 & 2033
- Figure 30: Asia Pacific Clean Coal Technology Industry Revenue (billion), by Import Market Analysis (Value & Volume) 2025 & 2033
- Figure 31: Asia Pacific Clean Coal Technology Industry Revenue Share (%), by Import Market Analysis (Value & Volume) 2025 & 2033
- Figure 32: Asia Pacific Clean Coal Technology Industry Revenue (billion), by Export Market Analysis (Value & Volume) 2025 & 2033
- Figure 33: Asia Pacific Clean Coal Technology Industry Revenue Share (%), by Export Market Analysis (Value & Volume) 2025 & 2033
- Figure 34: Asia Pacific Clean Coal Technology Industry Revenue (billion), by Price Trend Analysis 2025 & 2033
- Figure 35: Asia Pacific Clean Coal Technology Industry Revenue Share (%), by Price Trend Analysis 2025 & 2033
- Figure 36: Asia Pacific Clean Coal Technology Industry Revenue (billion), by Country 2025 & 2033
- Figure 37: Asia Pacific Clean Coal Technology Industry Revenue Share (%), by Country 2025 & 2033
- Figure 38: Middle East and Africa Clean Coal Technology Industry Revenue (billion), by Production Analysis 2025 & 2033
- Figure 39: Middle East and Africa Clean Coal Technology Industry Revenue Share (%), by Production Analysis 2025 & 2033
- Figure 40: Middle East and Africa Clean Coal Technology Industry Revenue (billion), by Consumption Analysis 2025 & 2033
- Figure 41: Middle East and Africa Clean Coal Technology Industry Revenue Share (%), by Consumption Analysis 2025 & 2033
- Figure 42: Middle East and Africa Clean Coal Technology Industry Revenue (billion), by Import Market Analysis (Value & Volume) 2025 & 2033
- Figure 43: Middle East and Africa Clean Coal Technology Industry Revenue Share (%), by Import Market Analysis (Value & Volume) 2025 & 2033
- Figure 44: Middle East and Africa Clean Coal Technology Industry Revenue (billion), by Export Market Analysis (Value & Volume) 2025 & 2033
- Figure 45: Middle East and Africa Clean Coal Technology Industry Revenue Share (%), by Export Market Analysis (Value & Volume) 2025 & 2033
- Figure 46: Middle East and Africa Clean Coal Technology Industry Revenue (billion), by Price Trend Analysis 2025 & 2033
- Figure 47: Middle East and Africa Clean Coal Technology Industry Revenue Share (%), by Price Trend Analysis 2025 & 2033
- Figure 48: Middle East and Africa Clean Coal Technology Industry Revenue (billion), by Country 2025 & 2033
- Figure 49: Middle East and Africa Clean Coal Technology Industry Revenue Share (%), by Country 2025 & 2033
- Figure 50: South America Clean Coal Technology Industry Revenue (billion), by Production Analysis 2025 & 2033
- Figure 51: South America Clean Coal Technology Industry Revenue Share (%), by Production Analysis 2025 & 2033
- Figure 52: South America Clean Coal Technology Industry Revenue (billion), by Consumption Analysis 2025 & 2033
- Figure 53: South America Clean Coal Technology Industry Revenue Share (%), by Consumption Analysis 2025 & 2033
- Figure 54: South America Clean Coal Technology Industry Revenue (billion), by Import Market Analysis (Value & Volume) 2025 & 2033
- Figure 55: South America Clean Coal Technology Industry Revenue Share (%), by Import Market Analysis (Value & Volume) 2025 & 2033
- Figure 56: South America Clean Coal Technology Industry Revenue (billion), by Export Market Analysis (Value & Volume) 2025 & 2033
- Figure 57: South America Clean Coal Technology Industry Revenue Share (%), by Export Market Analysis (Value & Volume) 2025 & 2033
- Figure 58: South America Clean Coal Technology Industry Revenue (billion), by Price Trend Analysis 2025 & 2033
- Figure 59: South America Clean Coal Technology Industry Revenue Share (%), by Price Trend Analysis 2025 & 2033
- Figure 60: South America Clean Coal Technology Industry Revenue (billion), by Country 2025 & 2033
- Figure 61: South America Clean Coal Technology Industry Revenue Share (%), by Country 2025 & 2033
List of Tables
- Table 1: Global Clean Coal Technology Industry Revenue billion Forecast, by Production Analysis 2020 & 2033
- Table 2: Global Clean Coal Technology Industry Revenue billion Forecast, by Consumption Analysis 2020 & 2033
- Table 3: Global Clean Coal Technology Industry Revenue billion Forecast, by Import Market Analysis (Value & Volume) 2020 & 2033
- Table 4: Global Clean Coal Technology Industry Revenue billion Forecast, by Export Market Analysis (Value & Volume) 2020 & 2033
- Table 5: Global Clean Coal Technology Industry Revenue billion Forecast, by Price Trend Analysis 2020 & 2033
- Table 6: Global Clean Coal Technology Industry Revenue billion Forecast, by Region 2020 & 2033
- Table 7: Global Clean Coal Technology Industry Revenue billion Forecast, by Production Analysis 2020 & 2033
- Table 8: Global Clean Coal Technology Industry Revenue billion Forecast, by Consumption Analysis 2020 & 2033
- Table 9: Global Clean Coal Technology Industry Revenue billion Forecast, by Import Market Analysis (Value & Volume) 2020 & 2033
- Table 10: Global Clean Coal Technology Industry Revenue billion Forecast, by Export Market Analysis (Value & Volume) 2020 & 2033
- Table 11: Global Clean Coal Technology Industry Revenue billion Forecast, by Price Trend Analysis 2020 & 2033
- Table 12: Global Clean Coal Technology Industry Revenue billion Forecast, by Country 2020 & 2033
- Table 13: Global Clean Coal Technology Industry Revenue billion Forecast, by Production Analysis 2020 & 2033
- Table 14: Global Clean Coal Technology Industry Revenue billion Forecast, by Consumption Analysis 2020 & 2033
- Table 15: Global Clean Coal Technology Industry Revenue billion Forecast, by Import Market Analysis (Value & Volume) 2020 & 2033
- Table 16: Global Clean Coal Technology Industry Revenue billion Forecast, by Export Market Analysis (Value & Volume) 2020 & 2033
- Table 17: Global Clean Coal Technology Industry Revenue billion Forecast, by Price Trend Analysis 2020 & 2033
- Table 18: Global Clean Coal Technology Industry Revenue billion Forecast, by Country 2020 & 2033
- Table 19: Global Clean Coal Technology Industry Revenue billion Forecast, by Production Analysis 2020 & 2033
- Table 20: Global Clean Coal Technology Industry Revenue billion Forecast, by Consumption Analysis 2020 & 2033
- Table 21: Global Clean Coal Technology Industry Revenue billion Forecast, by Import Market Analysis (Value & Volume) 2020 & 2033
- Table 22: Global Clean Coal Technology Industry Revenue billion Forecast, by Export Market Analysis (Value & Volume) 2020 & 2033
- Table 23: Global Clean Coal Technology Industry Revenue billion Forecast, by Price Trend Analysis 2020 & 2033
- Table 24: Global Clean Coal Technology Industry Revenue billion Forecast, by Country 2020 & 2033
- Table 25: Global Clean Coal Technology Industry Revenue billion Forecast, by Production Analysis 2020 & 2033
- Table 26: Global Clean Coal Technology Industry Revenue billion Forecast, by Consumption Analysis 2020 & 2033
- Table 27: Global Clean Coal Technology Industry Revenue billion Forecast, by Import Market Analysis (Value & Volume) 2020 & 2033
- Table 28: Global Clean Coal Technology Industry Revenue billion Forecast, by Export Market Analysis (Value & Volume) 2020 & 2033
- Table 29: Global Clean Coal Technology Industry Revenue billion Forecast, by Price Trend Analysis 2020 & 2033
- Table 30: Global Clean Coal Technology Industry Revenue billion Forecast, by Country 2020 & 2033
- Table 31: Global Clean Coal Technology Industry Revenue billion Forecast, by Production Analysis 2020 & 2033
- Table 32: Global Clean Coal Technology Industry Revenue billion Forecast, by Consumption Analysis 2020 & 2033
- Table 33: Global Clean Coal Technology Industry Revenue billion Forecast, by Import Market Analysis (Value & Volume) 2020 & 2033
- Table 34: Global Clean Coal Technology Industry Revenue billion Forecast, by Export Market Analysis (Value & Volume) 2020 & 2033
- Table 35: Global Clean Coal Technology Industry Revenue billion Forecast, by Price Trend Analysis 2020 & 2033
- Table 36: Global Clean Coal Technology Industry Revenue billion Forecast, by Country 2020 & 2033
Frequently Asked Questions
1. What is the projected Compound Annual Growth Rate (CAGR) of the Clean Coal Technology Industry?
The projected CAGR is approximately 6.39%.
2. Which companies are prominent players in the Clean Coal Technology Industry?
Key companies in the market include Shell PLC, KBR Inc, Siemens Energy AG, General Electric Company, Alstom SA*List Not Exhaustive.
3. What are the main segments of the Clean Coal Technology Industry?
The market segments include Production Analysis, Consumption Analysis, Import Market Analysis (Value & Volume), Export Market Analysis (Value & Volume), Price Trend Analysis.
4. Can you provide details about the market size?
The market size is estimated to be USD 4.57 billion as of 2022.
5. What are some drivers contributing to market growth?
4.; Modernization and Upgrades of Existing Military Aircraft Fleets4.; Increasing Defense Budgets.
6. What are the notable trends driving market growth?
Growth in Power Consumption is Likely to Drive the Market.
7. Are there any restraints impacting market growth?
4.; Shift Toward Unmanned Aircraft.
8. Can you provide examples of recent developments in the market?
In February 2022, the Indian Institute of Chemical Technology (IICT) announced a collaborative project of approximately INR 7.31 core with Northern Coalfields Limits (NCL), Madhya Pradesh (MP), to take up research and development in the field of sustainable mining and clean coal technologies (CCT).
9. What pricing options are available for accessing the report?
Pricing options include single-user, multi-user, and enterprise licenses priced at USD 4750, USD 5250, and USD 8750 respectively.
10. Is the market size provided in terms of value or volume?
The market size is provided in terms of value, measured in billion.
11. Are there any specific market keywords associated with the report?
Yes, the market keyword associated with the report is "Clean Coal Technology Industry," which aids in identifying and referencing the specific market segment covered.
12. How do I determine which pricing option suits my needs best?
The pricing options vary based on user requirements and access needs. Individual users may opt for single-user licenses, while businesses requiring broader access may choose multi-user or enterprise licenses for cost-effective access to the report.
13. Are there any additional resources or data provided in the Clean Coal Technology Industry report?
While the report offers comprehensive insights, it's advisable to review the specific contents or supplementary materials provided to ascertain if additional resources or data are available.
14. How can I stay updated on further developments or reports in the Clean Coal Technology Industry?
To stay informed about further developments, trends, and reports in the Clean Coal Technology Industry, consider subscribing to industry newsletters, following relevant companies and organizations, or regularly checking reputable industry news sources and publications.
Methodology
Step 1 - Identification of Relevant Samples Size from Population Database


Step 2 - Approaches for Defining Global Market Size (Value, Volume* & Price*)

Note*: In applicable scenarios
Step 3 - Data Sources
Primary Research
- Web Analytics
- Survey Reports
- Research Institute
- Latest Research Reports
- Opinion Leaders
Secondary Research
- Annual Reports
- White Paper
- Latest Press Release
- Industry Association
- Paid Database
- Investor Presentations

Step 4 - Data Triangulation
Involves using different sources of information in order to increase the validity of a study
These sources are likely to be stakeholders in a program - participants, other researchers, program staff, other community members, and so on.
Then we put all data in single framework & apply various statistical tools to find out the dynamic on the market.
During the analysis stage, feedback from the stakeholder groups would be compared to determine areas of agreement as well as areas of divergence