

Key Insights
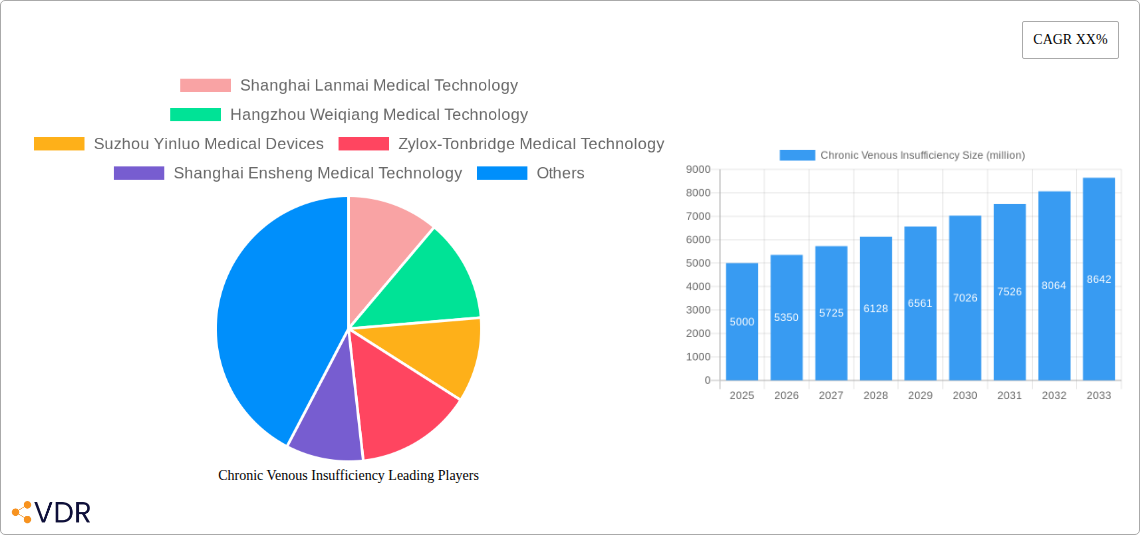
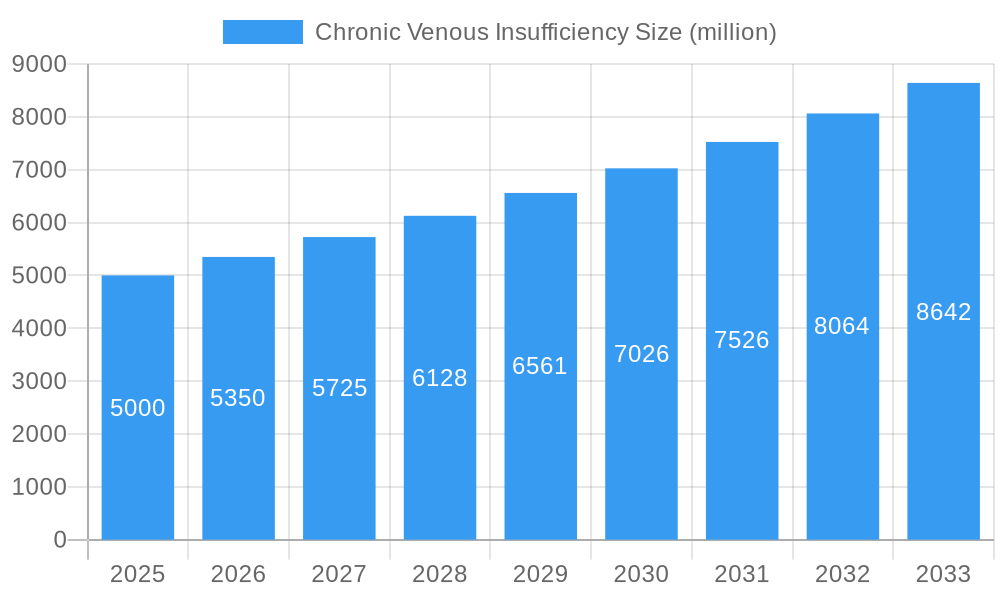
The global chronic venous insufficiency (CVI) market is experiencing robust growth, driven by an aging population, increasing prevalence of obesity and sedentary lifestyles, and rising awareness of CVI's debilitating effects. The market, estimated at $5 billion in 2025, is projected to exhibit a Compound Annual Growth Rate (CAGR) of approximately 7% from 2025 to 2033. This growth is fueled by technological advancements in minimally invasive treatment options, such as endovenous ablation and sclerotherapy, which offer less invasive alternatives to traditional surgical interventions. Furthermore, the increasing demand for improved patient outcomes and reduced healthcare costs is pushing the adoption of advanced diagnostic techniques and therapeutic devices. Key players in the market, including BD (Angiomed), Boston Scientific, Cook Ireland, Medtronic, and several prominent Asian companies like Shanghai Lanmai Medical Technology and Hangzhou Weiqiang Medical Technology, are actively engaged in research and development, contributing to the market's expansion through product innovation and strategic partnerships.
Chronic Venous Insufficiency Market Size (In Billion)
Significant regional variations are anticipated, with North America and Europe likely to maintain a considerable market share due to established healthcare infrastructure, high healthcare expenditure, and advanced medical technology adoption. However, developing economies in Asia and Latin America are expected to witness accelerated growth, driven by rising disposable incomes, improved healthcare access, and increasing awareness regarding CVI. Market restraints include the relatively high cost of advanced treatment procedures and the potential for complications associated with certain interventions. Nevertheless, the overall market trajectory suggests a positive outlook, with continuous growth anticipated throughout the forecast period due to the escalating prevalence of CVI globally and ongoing innovation in treatment modalities.
Chronic Venous Insufficiency Company Market Share
Chronic Venous Insufficiency Market Report: 2019-2033
This comprehensive report provides a detailed analysis of the Chronic Venous Insufficiency (CVI) market, encompassing market dynamics, growth trends, regional segmentation, product landscape, key players, and future outlook. The study period covers 2019-2033, with 2025 serving as the base and estimated year. The forecast period spans 2025-2033, and the historical period encompasses 2019-2024. The report caters to industry professionals, investors, and stakeholders seeking in-depth insights into this significant healthcare market. The total market size in 2025 is estimated at $XX billion.
Chronic Venous Insufficiency Market Dynamics & Structure
This section analyzes the competitive landscape, technological advancements, regulatory influences, and market trends within the CVI market. The global market is moderately fragmented, with key players holding significant market share, but a number of smaller players also playing a role. The market is driven by increasing prevalence of CVI, aging population, and technological advancements in diagnostic and treatment modalities.
- Market Concentration: Moderately fragmented, with the top 5 players accounting for approximately XX% of the market in 2025.
- Technological Innovation: Significant advancements in compression therapy, minimally invasive procedures, and drug development are driving market growth.
- Regulatory Frameworks: Stringent regulatory approvals and reimbursement policies influence market access and growth.
- Competitive Product Substitutes: Limited effective substitutes exist, strengthening the market's growth trajectory.
- End-User Demographics: Primarily driven by the aging population and increased prevalence of risk factors like obesity and sedentary lifestyles.
- M&A Trends: An average of XX M&A deals per year were observed during the historical period (2019-2024). This is expected to increase to XX deals per year during the forecast period. These deals predominantly involve smaller companies being acquired by larger players to expand their product portfolio and geographical reach. Innovation barriers include high research and development costs, stringent regulatory requirements, and the need for large-scale clinical trials.
Chronic Venous Insufficiency Growth Trends & Insights
The CVI market exhibits substantial growth potential, fueled by rising prevalence, improved diagnostics, and expanding treatment options. The market is expected to grow at a CAGR of XX% during the forecast period (2025-2033), reaching a projected value of $XX billion by 2033. This growth is influenced by factors such as increasing awareness among patients and healthcare providers, technological advancements leading to better treatment outcomes, and expansion of healthcare infrastructure, particularly in developing countries. Market penetration of advanced treatment methods remains relatively low, indicating considerable untapped potential for market expansion.
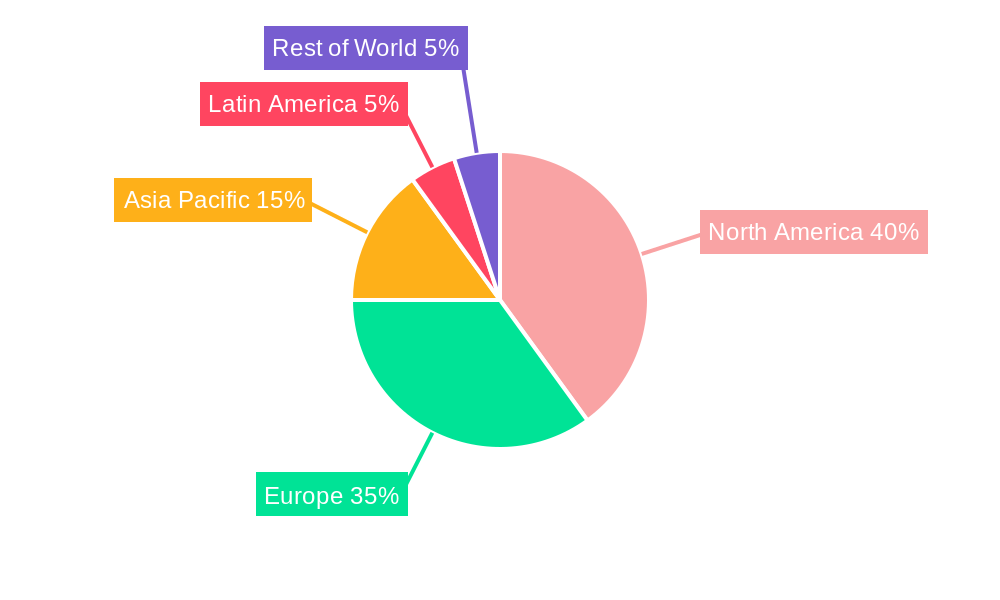
Dominant Regions, Countries, or Segments in Chronic Venous Insufficiency
North America currently holds the largest market share, driven by high healthcare expenditure, advanced healthcare infrastructure, and a significant aging population. However, rapid growth is anticipated in Asia-Pacific, particularly in countries like China and India, due to rising prevalence of CVI and increasing affordability of healthcare services.
- North America: High prevalence, advanced medical infrastructure, and high healthcare expenditure contribute to market dominance.
- Europe: Mature market with steady growth, driven by increasing geriatric population and rising healthcare awareness.
- Asia-Pacific: Fastest-growing region, fuelled by rising prevalence, increasing healthcare spending, and growing awareness of CVI.
- Rest of the World: Experiencing moderate growth, with potential for expansion in emerging economies.
The venous ulcer segment holds the largest market share due to the high prevalence and significant unmet medical needs.
Chronic Venous Insufficiency Product Landscape
The CVI product landscape encompasses a range of therapies, including compression therapy (stockings, bandages), minimally invasive procedures (e.g., endovenous ablation), and pharmaceuticals (e.g., phlebotonics). Recent innovations focus on improving the efficacy and comfort of compression therapy, developing less invasive procedures with faster recovery times, and exploring new pharmacological agents with enhanced therapeutic benefits. Unique selling propositions include improved patient comfort, reduced treatment time, and enhanced clinical outcomes.
Key Drivers, Barriers & Challenges in Chronic Venous Insufficiency
Key Drivers: Rising prevalence of CVI, aging population, increasing healthcare expenditure, technological advancements, growing awareness among patients and healthcare professionals.
Challenges & Restraints: High cost of advanced treatments, limited access to healthcare in developing countries, reimbursement challenges, and potential side effects associated with certain treatment modalities. The lack of awareness in certain regions also acts as a significant barrier, leading to delayed diagnosis and treatment. Supply chain disruptions during the past few years has also impacted market growth, with estimates suggesting a XX% decrease in sales during peak disruptions.
Emerging Opportunities in Chronic Venous Insufficiency
Emerging opportunities include the development of novel therapeutic agents, minimally invasive treatment approaches, and telemedicine solutions for remote patient monitoring. Untapped markets exist in developing countries with high prevalence of CVI but limited access to advanced treatment options. Personalized medicine approaches could potentially optimize treatment strategies based on individual patient characteristics.
Growth Accelerators in the Chronic Venous Insufficiency Industry
Technological breakthroughs in minimally invasive procedures, strategic partnerships between pharmaceutical and medical device companies, and expansion into underserved markets are expected to accelerate long-term growth. Increased investment in research and development will further enhance the innovation pipeline, driving the development of more effective and safe treatments.
Key Players Shaping the Chronic Venous Insufficiency Market
- BD (Angiomed)
- Boston Scientific
- Cook Ireland
- Medtronic
- optimed Medizinische Instrumente
- Philips
- 3M
- Teva
- Mylan
- Pfizer
- AbbVie
- Abbott
- Allergan
- Sun Pharma
- Shanghai Lanmai Medical Technology
- Hangzhou Weiqiang Medical Technology
- Suzhou Yinluo Medical Devices
- Zylox-Tonbridge Medical Technology
- Shanghai Ensheng Medical Technology
- Suzhou Tianhong Shengjie Medical Devices
Notable Milestones in Chronic Venous Insufficiency Sector
- 2020: FDA approval of a new minimally invasive procedure for CVI treatment.
- 2021: Launch of a novel compression therapy product with enhanced comfort and efficacy.
- 2022: Major pharmaceutical company initiates a large-scale clinical trial for a new drug targeting CVI.
- 2023: Acquisition of a small medical device company specializing in CVI treatment by a large multinational corporation.
- 2024: Publication of landmark clinical trial results demonstrating the efficacy of a new treatment modality.
In-Depth Chronic Venous Insufficiency Market Outlook
The CVI market is poised for significant growth over the forecast period, driven by continuous technological advancements, increased market penetration of innovative therapies, and expanding healthcare infrastructure globally. Strategic partnerships and investments in research and development will further enhance the market's trajectory, creating lucrative opportunities for market players. The focus on minimally invasive procedures and personalized medicine will further enhance the market prospects.
Chronic Venous Insufficiency Segmentation
-
1. Application
- 1.1. Hospital
- 1.2. Clinic
- 1.3. Other
-
2. Types
- 2.1. Medical Equipment and Consumables
- 2.2. Drugs
Chronic Venous Insufficiency Segmentation By Geography
-
1. North America
- 1.1. United States
- 1.2. Canada
- 1.3. Mexico
-
2. South America
- 2.1. Brazil
- 2.2. Argentina
- 2.3. Rest of South America
-
3. Europe
- 3.1. United Kingdom
- 3.2. Germany
- 3.3. France
- 3.4. Italy
- 3.5. Spain
- 3.6. Russia
- 3.7. Benelux
- 3.8. Nordics
- 3.9. Rest of Europe
-
4. Middle East & Africa
- 4.1. Turkey
- 4.2. Israel
- 4.3. GCC
- 4.4. North Africa
- 4.5. South Africa
- 4.6. Rest of Middle East & Africa
-
5. Asia Pacific
- 5.1. China
- 5.2. India
- 5.3. Japan
- 5.4. South Korea
- 5.5. ASEAN
- 5.6. Oceania
- 5.7. Rest of Asia Pacific
Chronic Venous Insufficiency Regional Market Share
Geographic Coverage of Chronic Venous Insufficiency
Chronic Venous Insufficiency REPORT HIGHLIGHTS
| Aspects | Details |
|---|---|
| Study Period | 2020-2034 |
| Base Year | 2025 |
| Estimated Year | 2026 |
| Forecast Period | 2026-2034 |
| Historical Period | 2020-2025 |
| Growth Rate | CAGR of 6.3% from 2020-2034 |
| Segmentation |
|
Table of Contents
- 1. Introduction
- 1.1. Research Scope
- 1.2. Market Segmentation
- 1.3. Research Methodology
- 1.4. Definitions and Assumptions
- 2. Executive Summary
- 2.1. Introduction
- 3. Market Dynamics
- 3.1. Introduction
- 3.2. Market Drivers
- 3.3. Market Restrains
- 3.4. Market Trends
- 4. Market Factor Analysis
- 4.1. Porters Five Forces
- 4.2. Supply/Value Chain
- 4.3. PESTEL analysis
- 4.4. Market Entropy
- 4.5. Patent/Trademark Analysis
- 5. Global Chronic Venous Insufficiency Analysis, Insights and Forecast, 2020-2032
- 5.1. Market Analysis, Insights and Forecast - by Application
- 5.1.1. Hospital
- 5.1.2. Clinic
- 5.1.3. Other
- 5.2. Market Analysis, Insights and Forecast - by Types
- 5.2.1. Medical Equipment and Consumables
- 5.2.2. Drugs
- 5.3. Market Analysis, Insights and Forecast - by Region
- 5.3.1. North America
- 5.3.2. South America
- 5.3.3. Europe
- 5.3.4. Middle East & Africa
- 5.3.5. Asia Pacific
- 5.1. Market Analysis, Insights and Forecast - by Application
- 6. North America Chronic Venous Insufficiency Analysis, Insights and Forecast, 2020-2032
- 6.1. Market Analysis, Insights and Forecast - by Application
- 6.1.1. Hospital
- 6.1.2. Clinic
- 6.1.3. Other
- 6.2. Market Analysis, Insights and Forecast - by Types
- 6.2.1. Medical Equipment and Consumables
- 6.2.2. Drugs
- 6.1. Market Analysis, Insights and Forecast - by Application
- 7. South America Chronic Venous Insufficiency Analysis, Insights and Forecast, 2020-2032
- 7.1. Market Analysis, Insights and Forecast - by Application
- 7.1.1. Hospital
- 7.1.2. Clinic
- 7.1.3. Other
- 7.2. Market Analysis, Insights and Forecast - by Types
- 7.2.1. Medical Equipment and Consumables
- 7.2.2. Drugs
- 7.1. Market Analysis, Insights and Forecast - by Application
- 8. Europe Chronic Venous Insufficiency Analysis, Insights and Forecast, 2020-2032
- 8.1. Market Analysis, Insights and Forecast - by Application
- 8.1.1. Hospital
- 8.1.2. Clinic
- 8.1.3. Other
- 8.2. Market Analysis, Insights and Forecast - by Types
- 8.2.1. Medical Equipment and Consumables
- 8.2.2. Drugs
- 8.1. Market Analysis, Insights and Forecast - by Application
- 9. Middle East & Africa Chronic Venous Insufficiency Analysis, Insights and Forecast, 2020-2032
- 9.1. Market Analysis, Insights and Forecast - by Application
- 9.1.1. Hospital
- 9.1.2. Clinic
- 9.1.3. Other
- 9.2. Market Analysis, Insights and Forecast - by Types
- 9.2.1. Medical Equipment and Consumables
- 9.2.2. Drugs
- 9.1. Market Analysis, Insights and Forecast - by Application
- 10. Asia Pacific Chronic Venous Insufficiency Analysis, Insights and Forecast, 2020-2032
- 10.1. Market Analysis, Insights and Forecast - by Application
- 10.1.1. Hospital
- 10.1.2. Clinic
- 10.1.3. Other
- 10.2. Market Analysis, Insights and Forecast - by Types
- 10.2.1. Medical Equipment and Consumables
- 10.2.2. Drugs
- 10.1. Market Analysis, Insights and Forecast - by Application
- 11. Competitive Analysis
- 11.1. Global Market Share Analysis 2025
- 11.2. Company Profiles
- 11.2.1 Shanghai Lanmai Medical Technology
- 11.2.1.1. Overview
- 11.2.1.2. Products
- 11.2.1.3. SWOT Analysis
- 11.2.1.4. Recent Developments
- 11.2.1.5. Financials (Based on Availability)
- 11.2.2 Hangzhou Weiqiang Medical Technology
- 11.2.2.1. Overview
- 11.2.2.2. Products
- 11.2.2.3. SWOT Analysis
- 11.2.2.4. Recent Developments
- 11.2.2.5. Financials (Based on Availability)
- 11.2.3 Suzhou Yinluo Medical Devices
- 11.2.3.1. Overview
- 11.2.3.2. Products
- 11.2.3.3. SWOT Analysis
- 11.2.3.4. Recent Developments
- 11.2.3.5. Financials (Based on Availability)
- 11.2.4 Zylox-Tonbridge Medical Technology
- 11.2.4.1. Overview
- 11.2.4.2. Products
- 11.2.4.3. SWOT Analysis
- 11.2.4.4. Recent Developments
- 11.2.4.5. Financials (Based on Availability)
- 11.2.5 Shanghai Ensheng Medical Technology
- 11.2.5.1. Overview
- 11.2.5.2. Products
- 11.2.5.3. SWOT Analysis
- 11.2.5.4. Recent Developments
- 11.2.5.5. Financials (Based on Availability)
- 11.2.6 Suzhou Tianhong Shengjie Medical Devices
- 11.2.6.1. Overview
- 11.2.6.2. Products
- 11.2.6.3. SWOT Analysis
- 11.2.6.4. Recent Developments
- 11.2.6.5. Financials (Based on Availability)
- 11.2.7 BD(Angiomed)
- 11.2.7.1. Overview
- 11.2.7.2. Products
- 11.2.7.3. SWOT Analysis
- 11.2.7.4. Recent Developments
- 11.2.7.5. Financials (Based on Availability)
- 11.2.8 Boston Scientific
- 11.2.8.1. Overview
- 11.2.8.2. Products
- 11.2.8.3. SWOT Analysis
- 11.2.8.4. Recent Developments
- 11.2.8.5. Financials (Based on Availability)
- 11.2.9 Cook Ireland
- 11.2.9.1. Overview
- 11.2.9.2. Products
- 11.2.9.3. SWOT Analysis
- 11.2.9.4. Recent Developments
- 11.2.9.5. Financials (Based on Availability)
- 11.2.10 Medtronic
- 11.2.10.1. Overview
- 11.2.10.2. Products
- 11.2.10.3. SWOT Analysis
- 11.2.10.4. Recent Developments
- 11.2.10.5. Financials (Based on Availability)
- 11.2.11 optimed Medizinische Instrumente
- 11.2.11.1. Overview
- 11.2.11.2. Products
- 11.2.11.3. SWOT Analysis
- 11.2.11.4. Recent Developments
- 11.2.11.5. Financials (Based on Availability)
- 11.2.12 Philips
- 11.2.12.1. Overview
- 11.2.12.2. Products
- 11.2.12.3. SWOT Analysis
- 11.2.12.4. Recent Developments
- 11.2.12.5. Financials (Based on Availability)
- 11.2.13 3M
- 11.2.13.1. Overview
- 11.2.13.2. Products
- 11.2.13.3. SWOT Analysis
- 11.2.13.4. Recent Developments
- 11.2.13.5. Financials (Based on Availability)
- 11.2.14 Teva
- 11.2.14.1. Overview
- 11.2.14.2. Products
- 11.2.14.3. SWOT Analysis
- 11.2.14.4. Recent Developments
- 11.2.14.5. Financials (Based on Availability)
- 11.2.15 Mylan
- 11.2.15.1. Overview
- 11.2.15.2. Products
- 11.2.15.3. SWOT Analysis
- 11.2.15.4. Recent Developments
- 11.2.15.5. Financials (Based on Availability)
- 11.2.16 Pfizer
- 11.2.16.1. Overview
- 11.2.16.2. Products
- 11.2.16.3. SWOT Analysis
- 11.2.16.4. Recent Developments
- 11.2.16.5. Financials (Based on Availability)
- 11.2.17 AbbVie
- 11.2.17.1. Overview
- 11.2.17.2. Products
- 11.2.17.3. SWOT Analysis
- 11.2.17.4. Recent Developments
- 11.2.17.5. Financials (Based on Availability)
- 11.2.18 Abbott
- 11.2.18.1. Overview
- 11.2.18.2. Products
- 11.2.18.3. SWOT Analysis
- 11.2.18.4. Recent Developments
- 11.2.18.5. Financials (Based on Availability)
- 11.2.19 Allergan
- 11.2.19.1. Overview
- 11.2.19.2. Products
- 11.2.19.3. SWOT Analysis
- 11.2.19.4. Recent Developments
- 11.2.19.5. Financials (Based on Availability)
- 11.2.20 Sun Pharma
- 11.2.20.1. Overview
- 11.2.20.2. Products
- 11.2.20.3. SWOT Analysis
- 11.2.20.4. Recent Developments
- 11.2.20.5. Financials (Based on Availability)
- 11.2.1 Shanghai Lanmai Medical Technology
List of Figures
- Figure 1: Global Chronic Venous Insufficiency Revenue Breakdown (undefined, %) by Region 2025 & 2033
- Figure 2: North America Chronic Venous Insufficiency Revenue (undefined), by Application 2025 & 2033
- Figure 3: North America Chronic Venous Insufficiency Revenue Share (%), by Application 2025 & 2033
- Figure 4: North America Chronic Venous Insufficiency Revenue (undefined), by Types 2025 & 2033
- Figure 5: North America Chronic Venous Insufficiency Revenue Share (%), by Types 2025 & 2033
- Figure 6: North America Chronic Venous Insufficiency Revenue (undefined), by Country 2025 & 2033
- Figure 7: North America Chronic Venous Insufficiency Revenue Share (%), by Country 2025 & 2033
- Figure 8: South America Chronic Venous Insufficiency Revenue (undefined), by Application 2025 & 2033
- Figure 9: South America Chronic Venous Insufficiency Revenue Share (%), by Application 2025 & 2033
- Figure 10: South America Chronic Venous Insufficiency Revenue (undefined), by Types 2025 & 2033
- Figure 11: South America Chronic Venous Insufficiency Revenue Share (%), by Types 2025 & 2033
- Figure 12: South America Chronic Venous Insufficiency Revenue (undefined), by Country 2025 & 2033
- Figure 13: South America Chronic Venous Insufficiency Revenue Share (%), by Country 2025 & 2033
- Figure 14: Europe Chronic Venous Insufficiency Revenue (undefined), by Application 2025 & 2033
- Figure 15: Europe Chronic Venous Insufficiency Revenue Share (%), by Application 2025 & 2033
- Figure 16: Europe Chronic Venous Insufficiency Revenue (undefined), by Types 2025 & 2033
- Figure 17: Europe Chronic Venous Insufficiency Revenue Share (%), by Types 2025 & 2033
- Figure 18: Europe Chronic Venous Insufficiency Revenue (undefined), by Country 2025 & 2033
- Figure 19: Europe Chronic Venous Insufficiency Revenue Share (%), by Country 2025 & 2033
- Figure 20: Middle East & Africa Chronic Venous Insufficiency Revenue (undefined), by Application 2025 & 2033
- Figure 21: Middle East & Africa Chronic Venous Insufficiency Revenue Share (%), by Application 2025 & 2033
- Figure 22: Middle East & Africa Chronic Venous Insufficiency Revenue (undefined), by Types 2025 & 2033
- Figure 23: Middle East & Africa Chronic Venous Insufficiency Revenue Share (%), by Types 2025 & 2033
- Figure 24: Middle East & Africa Chronic Venous Insufficiency Revenue (undefined), by Country 2025 & 2033
- Figure 25: Middle East & Africa Chronic Venous Insufficiency Revenue Share (%), by Country 2025 & 2033
- Figure 26: Asia Pacific Chronic Venous Insufficiency Revenue (undefined), by Application 2025 & 2033
- Figure 27: Asia Pacific Chronic Venous Insufficiency Revenue Share (%), by Application 2025 & 2033
- Figure 28: Asia Pacific Chronic Venous Insufficiency Revenue (undefined), by Types 2025 & 2033
- Figure 29: Asia Pacific Chronic Venous Insufficiency Revenue Share (%), by Types 2025 & 2033
- Figure 30: Asia Pacific Chronic Venous Insufficiency Revenue (undefined), by Country 2025 & 2033
- Figure 31: Asia Pacific Chronic Venous Insufficiency Revenue Share (%), by Country 2025 & 2033
List of Tables
- Table 1: Global Chronic Venous Insufficiency Revenue undefined Forecast, by Application 2020 & 2033
- Table 2: Global Chronic Venous Insufficiency Revenue undefined Forecast, by Types 2020 & 2033
- Table 3: Global Chronic Venous Insufficiency Revenue undefined Forecast, by Region 2020 & 2033
- Table 4: Global Chronic Venous Insufficiency Revenue undefined Forecast, by Application 2020 & 2033
- Table 5: Global Chronic Venous Insufficiency Revenue undefined Forecast, by Types 2020 & 2033
- Table 6: Global Chronic Venous Insufficiency Revenue undefined Forecast, by Country 2020 & 2033
- Table 7: United States Chronic Venous Insufficiency Revenue (undefined) Forecast, by Application 2020 & 2033
- Table 8: Canada Chronic Venous Insufficiency Revenue (undefined) Forecast, by Application 2020 & 2033
- Table 9: Mexico Chronic Venous Insufficiency Revenue (undefined) Forecast, by Application 2020 & 2033
- Table 10: Global Chronic Venous Insufficiency Revenue undefined Forecast, by Application 2020 & 2033
- Table 11: Global Chronic Venous Insufficiency Revenue undefined Forecast, by Types 2020 & 2033
- Table 12: Global Chronic Venous Insufficiency Revenue undefined Forecast, by Country 2020 & 2033
- Table 13: Brazil Chronic Venous Insufficiency Revenue (undefined) Forecast, by Application 2020 & 2033
- Table 14: Argentina Chronic Venous Insufficiency Revenue (undefined) Forecast, by Application 2020 & 2033
- Table 15: Rest of South America Chronic Venous Insufficiency Revenue (undefined) Forecast, by Application 2020 & 2033
- Table 16: Global Chronic Venous Insufficiency Revenue undefined Forecast, by Application 2020 & 2033
- Table 17: Global Chronic Venous Insufficiency Revenue undefined Forecast, by Types 2020 & 2033
- Table 18: Global Chronic Venous Insufficiency Revenue undefined Forecast, by Country 2020 & 2033
- Table 19: United Kingdom Chronic Venous Insufficiency Revenue (undefined) Forecast, by Application 2020 & 2033
- Table 20: Germany Chronic Venous Insufficiency Revenue (undefined) Forecast, by Application 2020 & 2033
- Table 21: France Chronic Venous Insufficiency Revenue (undefined) Forecast, by Application 2020 & 2033
- Table 22: Italy Chronic Venous Insufficiency Revenue (undefined) Forecast, by Application 2020 & 2033
- Table 23: Spain Chronic Venous Insufficiency Revenue (undefined) Forecast, by Application 2020 & 2033
- Table 24: Russia Chronic Venous Insufficiency Revenue (undefined) Forecast, by Application 2020 & 2033
- Table 25: Benelux Chronic Venous Insufficiency Revenue (undefined) Forecast, by Application 2020 & 2033
- Table 26: Nordics Chronic Venous Insufficiency Revenue (undefined) Forecast, by Application 2020 & 2033
- Table 27: Rest of Europe Chronic Venous Insufficiency Revenue (undefined) Forecast, by Application 2020 & 2033
- Table 28: Global Chronic Venous Insufficiency Revenue undefined Forecast, by Application 2020 & 2033
- Table 29: Global Chronic Venous Insufficiency Revenue undefined Forecast, by Types 2020 & 2033
- Table 30: Global Chronic Venous Insufficiency Revenue undefined Forecast, by Country 2020 & 2033
- Table 31: Turkey Chronic Venous Insufficiency Revenue (undefined) Forecast, by Application 2020 & 2033
- Table 32: Israel Chronic Venous Insufficiency Revenue (undefined) Forecast, by Application 2020 & 2033
- Table 33: GCC Chronic Venous Insufficiency Revenue (undefined) Forecast, by Application 2020 & 2033
- Table 34: North Africa Chronic Venous Insufficiency Revenue (undefined) Forecast, by Application 2020 & 2033
- Table 35: South Africa Chronic Venous Insufficiency Revenue (undefined) Forecast, by Application 2020 & 2033
- Table 36: Rest of Middle East & Africa Chronic Venous Insufficiency Revenue (undefined) Forecast, by Application 2020 & 2033
- Table 37: Global Chronic Venous Insufficiency Revenue undefined Forecast, by Application 2020 & 2033
- Table 38: Global Chronic Venous Insufficiency Revenue undefined Forecast, by Types 2020 & 2033
- Table 39: Global Chronic Venous Insufficiency Revenue undefined Forecast, by Country 2020 & 2033
- Table 40: China Chronic Venous Insufficiency Revenue (undefined) Forecast, by Application 2020 & 2033
- Table 41: India Chronic Venous Insufficiency Revenue (undefined) Forecast, by Application 2020 & 2033
- Table 42: Japan Chronic Venous Insufficiency Revenue (undefined) Forecast, by Application 2020 & 2033
- Table 43: South Korea Chronic Venous Insufficiency Revenue (undefined) Forecast, by Application 2020 & 2033
- Table 44: ASEAN Chronic Venous Insufficiency Revenue (undefined) Forecast, by Application 2020 & 2033
- Table 45: Oceania Chronic Venous Insufficiency Revenue (undefined) Forecast, by Application 2020 & 2033
- Table 46: Rest of Asia Pacific Chronic Venous Insufficiency Revenue (undefined) Forecast, by Application 2020 & 2033
Frequently Asked Questions
1. What is the projected Compound Annual Growth Rate (CAGR) of the Chronic Venous Insufficiency?
The projected CAGR is approximately 6.3%.
2. Which companies are prominent players in the Chronic Venous Insufficiency?
Key companies in the market include Shanghai Lanmai Medical Technology, Hangzhou Weiqiang Medical Technology, Suzhou Yinluo Medical Devices, Zylox-Tonbridge Medical Technology, Shanghai Ensheng Medical Technology, Suzhou Tianhong Shengjie Medical Devices, BD(Angiomed), Boston Scientific, Cook Ireland, Medtronic, optimed Medizinische Instrumente, Philips, 3M, Teva, Mylan, Pfizer, AbbVie, Abbott, Allergan, Sun Pharma.
3. What are the main segments of the Chronic Venous Insufficiency?
The market segments include Application, Types.
4. Can you provide details about the market size?
The market size is estimated to be USD XXX N/A as of 2022.
5. What are some drivers contributing to market growth?
N/A
6. What are the notable trends driving market growth?
N/A
7. Are there any restraints impacting market growth?
N/A
8. Can you provide examples of recent developments in the market?
N/A
9. What pricing options are available for accessing the report?
Pricing options include single-user, multi-user, and enterprise licenses priced at USD 4350.00, USD 6525.00, and USD 8700.00 respectively.
10. Is the market size provided in terms of value or volume?
The market size is provided in terms of value, measured in N/A.
11. Are there any specific market keywords associated with the report?
Yes, the market keyword associated with the report is "Chronic Venous Insufficiency," which aids in identifying and referencing the specific market segment covered.
12. How do I determine which pricing option suits my needs best?
The pricing options vary based on user requirements and access needs. Individual users may opt for single-user licenses, while businesses requiring broader access may choose multi-user or enterprise licenses for cost-effective access to the report.
13. Are there any additional resources or data provided in the Chronic Venous Insufficiency report?
While the report offers comprehensive insights, it's advisable to review the specific contents or supplementary materials provided to ascertain if additional resources or data are available.
14. How can I stay updated on further developments or reports in the Chronic Venous Insufficiency?
To stay informed about further developments, trends, and reports in the Chronic Venous Insufficiency, consider subscribing to industry newsletters, following relevant companies and organizations, or regularly checking reputable industry news sources and publications.
Methodology
Step 1 - Identification of Relevant Samples Size from Population Database


Step 2 - Approaches for Defining Global Market Size (Value, Volume* & Price*)

Note*: In applicable scenarios
Step 3 - Data Sources
Primary Research
- Web Analytics
- Survey Reports
- Research Institute
- Latest Research Reports
- Opinion Leaders
Secondary Research
- Annual Reports
- White Paper
- Latest Press Release
- Industry Association
- Paid Database
- Investor Presentations

Step 4 - Data Triangulation
Involves using different sources of information in order to increase the validity of a study
These sources are likely to be stakeholders in a program - participants, other researchers, program staff, other community members, and so on.
Then we put all data in single framework & apply various statistical tools to find out the dynamic on the market.
During the analysis stage, feedback from the stakeholder groups would be compared to determine areas of agreement as well as areas of divergence