
Key Insights
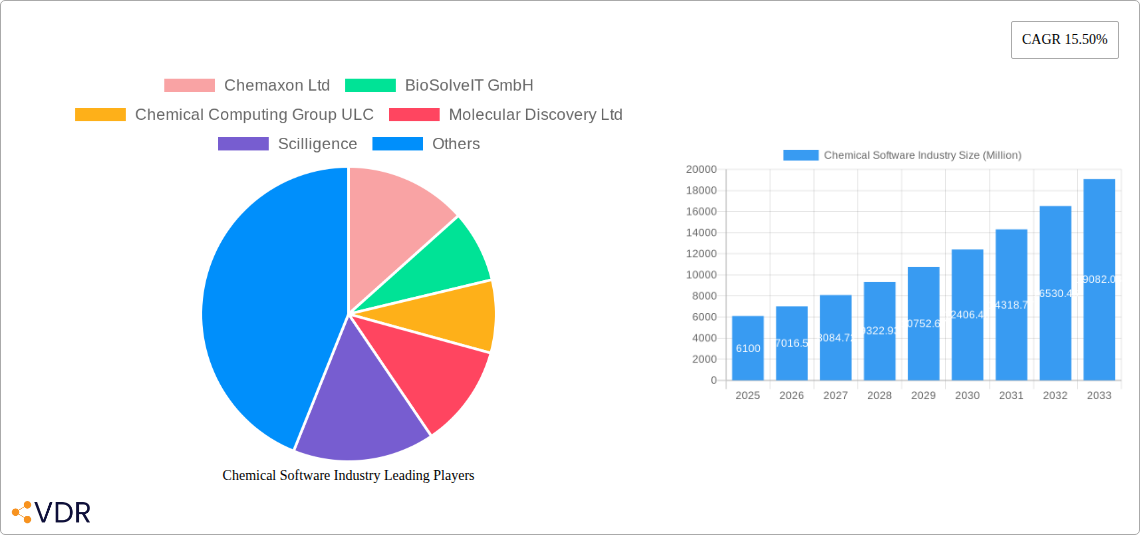
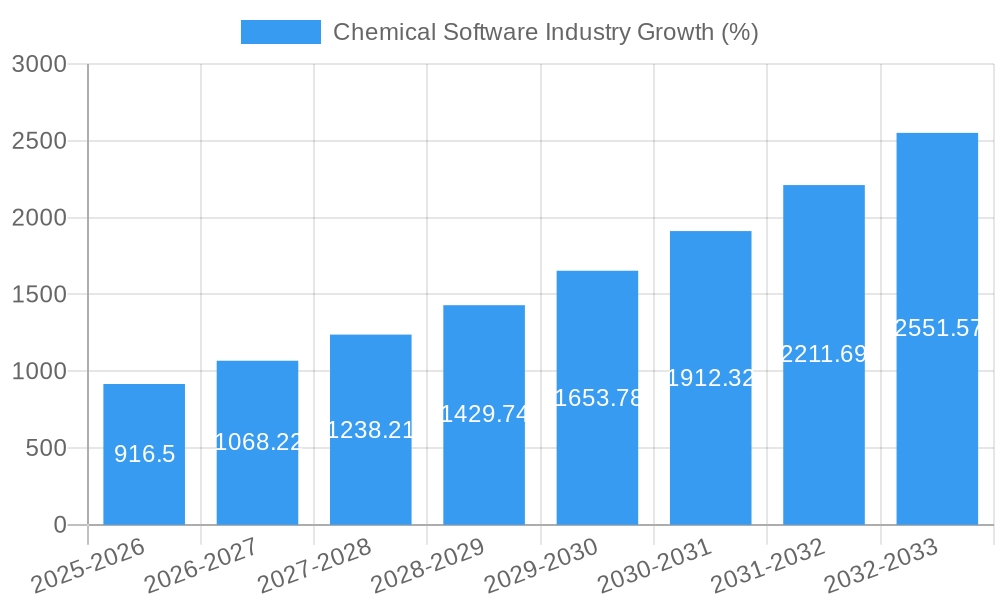
The chemical software market, valued at $6.10 billion in 2025, is projected to experience robust growth, driven by the increasing need for efficient drug discovery and development, the rising adoption of virtual screening techniques, and the growing demand for advanced chemical analysis tools across various industries. A Compound Annual Growth Rate (CAGR) of 15.50% from 2025 to 2033 indicates a significant expansion in market size, reaching an estimated $20.6 billion by 2033. This growth is fueled by several key factors. Firstly, the pharmaceutical and biotechnology sectors are heavily investing in computational tools to accelerate drug discovery pipelines, reducing research and development costs and time-to-market. Secondly, the increasing complexity of chemical compounds requires sophisticated software for analysis and modeling, driving demand for advanced functionalities. Finally, the growing adoption of cloud-based solutions and AI/ML integration within chemical software is enhancing accessibility, collaboration, and predictive capabilities.
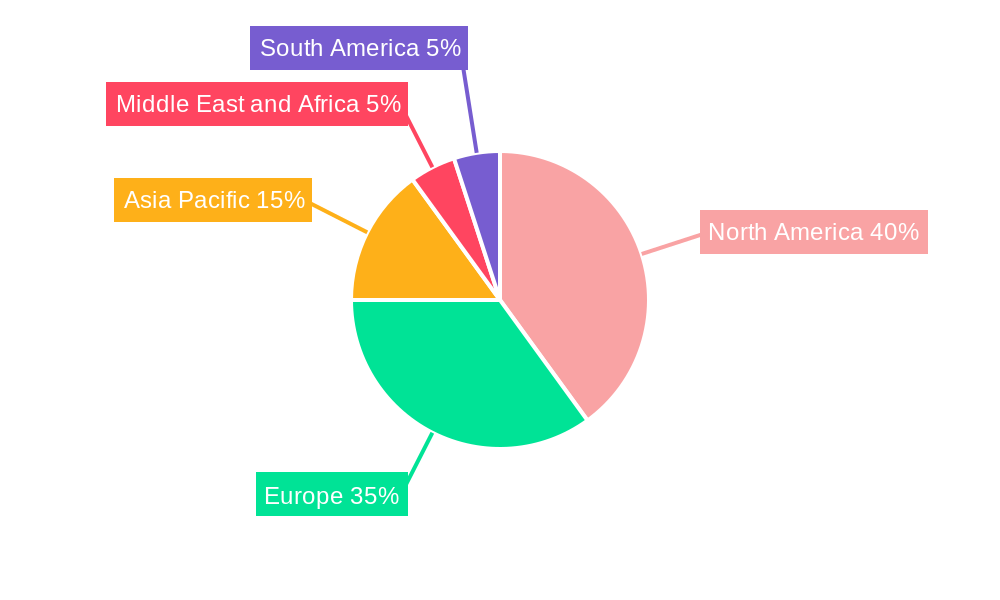
Market segmentation reveals that the application segment, particularly encompassing drug discovery and validation as well as virtual screening, holds a substantial share, reflecting the industry's focus on innovation and efficiency. Geographically, North America and Europe currently dominate the market, due to the presence of established pharmaceutical companies and advanced research institutions. However, the Asia-Pacific region, particularly China and India, is anticipated to witness rapid growth in the coming years, propelled by increasing R&D investments and a growing demand for cost-effective solutions. While the market faces challenges such as the high cost of advanced software and the need for specialized expertise, the overall trajectory points towards sustained and significant expansion in the chemical software market through 2033. Competition is fierce, with major players like Chemaxon, BioSolveIT, and Schrödinger vying for market share through continuous innovation and strategic partnerships.
Chemical Software Industry Market Report: 2019-2033
This comprehensive report provides a detailed analysis of the Chemical Software market, encompassing market dynamics, growth trends, regional analysis, product landscape, key players, and future outlook. The report covers the period from 2019 to 2033, with a focus on the 2025-2033 forecast period. The study uses 2025 as its base year. Market values are presented in millions of units.
Target Audience: This report is essential for chemical industry professionals, software developers, investors, researchers, and anyone seeking to understand the dynamics and future of this rapidly evolving sector. It offers in-depth insights into the parent market (Chemical Software) and its key child markets (Chemical Analysis, Drug Discovery and Validation, Virtual Screening, and other applications).
Chemical Software Industry Market Dynamics & Structure
The chemical software market is characterized by a moderately concentrated landscape, with several key players holding significant market share. Technological innovation is a primary driver, with advancements in artificial intelligence (AI), machine learning (ML), and high-performance computing fueling the development of sophisticated software solutions. Regulatory frameworks, particularly those related to data privacy and intellectual property, influence market dynamics. The market also faces competition from alternative analytical methods and open-source software. End-users span across various sectors, including pharmaceuticals, agrochemicals, and materials science. M&A activity has been moderate, with larger companies strategically acquiring smaller firms to enhance their technology portfolios.
- Market Concentration: Moderately concentrated, with top 5 players holding approximately xx% market share in 2025.
- Technological Innovation: AI, ML, and HPC are key drivers of innovation.
- Regulatory Framework: Data privacy and IP regulations impact market growth.
- Competitive Substitutes: Alternative analytical methods and open-source software pose competition.
- End-User Demographics: Pharmaceuticals, agrochemicals, and materials science are major end-users.
- M&A Trends: Moderate M&A activity, focused on technology acquisition and market expansion. xx M&A deals observed between 2019-2024.
Chemical Software Industry Growth Trends & Insights
The chemical software market witnessed significant growth during the historical period (2019-2024), driven by increased adoption of advanced analytical techniques and the growing need for efficient drug discovery and development. The market is expected to continue its growth trajectory, with a projected CAGR of xx% during the forecast period (2025-2033). This growth is fueled by technological disruptions, including the integration of AI and ML into chemical software, enhancing prediction accuracy and accelerating the drug development process. Consumer behavior is shifting towards cloud-based solutions, driving demand for accessible and scalable software. Market penetration is steadily increasing, particularly in emerging economies. The global market size is expected to reach xx Million by 2033 from xx Million in 2025.
Dominant Regions, Countries, or Segments in Chemical Software Industry
North America currently holds the largest market share in the chemical software industry, driven by strong R&D investments in the pharmaceutical and biotech sectors. Europe follows as a significant market, with a robust chemical industry and substantial government support for technological innovation. Within application segments, Drug Discovery and Validation is the dominant segment, followed by Chemical Analysis and Virtual Screening. This is primarily due to the high demand for efficient and accurate tools for drug development and validation in the pharmaceutical industry.
- North America: High R&D investment, robust pharmaceutical sector.
- Europe: Strong chemical industry, significant government support for innovation.
- Asia-Pacific: Growing pharmaceutical industry, increasing adoption of advanced technologies.
- Dominant Segment: Drug Discovery and Validation, driven by high demand in pharmaceutical industry.
- Key Drivers: Strong R&D spending, government support, growing pharmaceutical and biotech industries.
Chemical Software Industry Product Landscape
The chemical software market offers a diverse range of products, from basic molecular modeling tools to sophisticated AI-powered platforms for drug design and material discovery. These products incorporate advanced algorithms, intuitive interfaces, and high-performance computing capabilities to accelerate research and development. Unique selling propositions often include specialized functionalities for specific chemical applications, seamless integration with other laboratory instruments, or cloud-based accessibility. Recent technological advancements include the increased use of AI and machine learning for prediction and automation.
Key Drivers, Barriers & Challenges in Chemical Software Industry
Key Drivers:
- Increasing demand for efficient drug discovery and development.
- Growing adoption of advanced analytical techniques.
- Technological advancements in AI, ML, and HPC.
- Government support for R&D in the chemical and pharmaceutical industries.
Key Barriers & Challenges:
- High cost of software and implementation.
- Data security and privacy concerns.
- Lack of skilled professionals to operate and interpret complex software.
- Competition from open-source alternatives. The competitive landscape impacts market share with an estimated xx% decrease in market share for smaller players due to competition from established players.
Emerging Opportunities in Chemical Software Industry
- Growing demand for cloud-based solutions.
- Expansion into new application areas, such as materials science and environmental chemistry.
- Integration of chemical software with other laboratory instruments.
- Development of specialized software for specific chemical applications.
Growth Accelerators in the Chemical Software Industry
Technological breakthroughs, particularly in AI and ML, are key growth accelerators. Strategic partnerships between software companies and pharmaceutical/chemical companies foster innovation and market expansion. Government initiatives supporting R&D and digitalization further accelerate market growth. The expanding use of cloud computing and big data analytics enhance scalability and data accessibility, fueling growth.
Key Players Shaping the Chemical Software Industry Market
- Chemaxon Ltd
- BioSolveIT GmbH
- Chemical Computing Group ULC
- Molecular Discovery Ltd
- Scilligence
- Collaborative Drug Discovery Inc
- Jubilant Biosys Ltd
- Cadence Design Systems Inc (OpenEye Scientific Software Inc)
- Schrödinger Inc
- Dassault Systemes
Notable Milestones in Chemical Software Industry Sector
- October 2023: Cadence Molecular Sciences (OpenEye) announces Pfizer Inc. extends and expands access to its products.
- June 2023: Vox Biomedical receives funding to develop an AI-based chemical identification library using GC-DMS.
In-Depth Chemical Software Industry Market Outlook
The chemical software market is poised for continued robust growth, driven by ongoing technological advancements, increased adoption rates, and expansion into new application areas. Strategic partnerships and investments in R&D will further fuel market expansion. Companies focusing on innovative solutions, user-friendly interfaces, and cloud-based accessibility will be well-positioned to capitalize on emerging opportunities and achieve market leadership.
Chemical Software Industry Segmentation
-
1. Application
-
1.1. Chemical Analysis
- 1.1.1. Chemical Databases
- 1.1.2. Chemometrics
- 1.1.3. Molecular Modelling
- 1.1.4. Other Chemical Analysis
- 1.2. Drug Discovery and Validation
- 1.3. Virtual Screening
- 1.4. Other Applications
-
1.1. Chemical Analysis
Chemical Software Industry Segmentation By Geography
-
1. North America
- 1.1. United States
- 1.2. Canada
- 1.3. Mexico
-
2. Europe
- 2.1. Germany
- 2.2. United Kingdom
- 2.3. France
- 2.4. Italy
- 2.5. Spain
- 2.6. Rest of Europe
-
3. Asia Pacific
- 3.1. China
- 3.2. Japan
- 3.3. India
- 3.4. Australia
- 3.5. South Korea
- 3.6. Rest of Asia Pacific
-
4. Middle East and Africa
- 4.1. GCC
- 4.2. South Africa
- 4.3. Rest of Middle East and Africa
-
5. South America
- 5.1. Brazil
- 5.2. Argentina
- 5.3. Rest of South America
Chemical Software Industry REPORT HIGHLIGHTS
| Aspects | Details |
|---|---|
| Study Period | 2019-2033 |
| Base Year | 2024 |
| Estimated Year | 2025 |
| Forecast Period | 2025-2033 |
| Historical Period | 2019-2024 |
| Growth Rate | CAGR of 15.50% from 2019-2033 |
| Segmentation |
|
Table of Contents
- 1. Introduction
- 1.1. Research Scope
- 1.2. Market Segmentation
- 1.3. Research Methodology
- 1.4. Definitions and Assumptions
- 2. Executive Summary
- 2.1. Introduction
- 3. Market Dynamics
- 3.1. Introduction
- 3.2. Market Drivers
- 3.2.1. Innovations and Advancements in the Drug Development Process; Increased Demand of Personalized Medicine
- 3.3. Market Restrains
- 3.3.1. Lack of Skilled Labors
- 3.4. Market Trends
- 3.4.1. Virtual Screening Segment is Expected to Witness Growth in the Market Over the Forecast Period
- 4. Market Factor Analysis
- 4.1. Porters Five Forces
- 4.2. Supply/Value Chain
- 4.3. PESTEL analysis
- 4.4. Market Entropy
- 4.5. Patent/Trademark Analysis
- 5. Global Chemical Software Industry Analysis, Insights and Forecast, 2019-2031
- 5.1. Market Analysis, Insights and Forecast - by Application
- 5.1.1. Chemical Analysis
- 5.1.1.1. Chemical Databases
- 5.1.1.2. Chemometrics
- 5.1.1.3. Molecular Modelling
- 5.1.1.4. Other Chemical Analysis
- 5.1.2. Drug Discovery and Validation
- 5.1.3. Virtual Screening
- 5.1.4. Other Applications
- 5.1.1. Chemical Analysis
- 5.2. Market Analysis, Insights and Forecast - by Region
- 5.2.1. North America
- 5.2.2. Europe
- 5.2.3. Asia Pacific
- 5.2.4. Middle East and Africa
- 5.2.5. South America
- 5.1. Market Analysis, Insights and Forecast - by Application
- 6. North America Chemical Software Industry Analysis, Insights and Forecast, 2019-2031
- 6.1. Market Analysis, Insights and Forecast - by Application
- 6.1.1. Chemical Analysis
- 6.1.1.1. Chemical Databases
- 6.1.1.2. Chemometrics
- 6.1.1.3. Molecular Modelling
- 6.1.1.4. Other Chemical Analysis
- 6.1.2. Drug Discovery and Validation
- 6.1.3. Virtual Screening
- 6.1.4. Other Applications
- 6.1.1. Chemical Analysis
- 6.1. Market Analysis, Insights and Forecast - by Application
- 7. Europe Chemical Software Industry Analysis, Insights and Forecast, 2019-2031
- 7.1. Market Analysis, Insights and Forecast - by Application
- 7.1.1. Chemical Analysis
- 7.1.1.1. Chemical Databases
- 7.1.1.2. Chemometrics
- 7.1.1.3. Molecular Modelling
- 7.1.1.4. Other Chemical Analysis
- 7.1.2. Drug Discovery and Validation
- 7.1.3. Virtual Screening
- 7.1.4. Other Applications
- 7.1.1. Chemical Analysis
- 7.1. Market Analysis, Insights and Forecast - by Application
- 8. Asia Pacific Chemical Software Industry Analysis, Insights and Forecast, 2019-2031
- 8.1. Market Analysis, Insights and Forecast - by Application
- 8.1.1. Chemical Analysis
- 8.1.1.1. Chemical Databases
- 8.1.1.2. Chemometrics
- 8.1.1.3. Molecular Modelling
- 8.1.1.4. Other Chemical Analysis
- 8.1.2. Drug Discovery and Validation
- 8.1.3. Virtual Screening
- 8.1.4. Other Applications
- 8.1.1. Chemical Analysis
- 8.1. Market Analysis, Insights and Forecast - by Application
- 9. Middle East and Africa Chemical Software Industry Analysis, Insights and Forecast, 2019-2031
- 9.1. Market Analysis, Insights and Forecast - by Application
- 9.1.1. Chemical Analysis
- 9.1.1.1. Chemical Databases
- 9.1.1.2. Chemometrics
- 9.1.1.3. Molecular Modelling
- 9.1.1.4. Other Chemical Analysis
- 9.1.2. Drug Discovery and Validation
- 9.1.3. Virtual Screening
- 9.1.4. Other Applications
- 9.1.1. Chemical Analysis
- 9.1. Market Analysis, Insights and Forecast - by Application
- 10. South America Chemical Software Industry Analysis, Insights and Forecast, 2019-2031
- 10.1. Market Analysis, Insights and Forecast - by Application
- 10.1.1. Chemical Analysis
- 10.1.1.1. Chemical Databases
- 10.1.1.2. Chemometrics
- 10.1.1.3. Molecular Modelling
- 10.1.1.4. Other Chemical Analysis
- 10.1.2. Drug Discovery and Validation
- 10.1.3. Virtual Screening
- 10.1.4. Other Applications
- 10.1.1. Chemical Analysis
- 10.1. Market Analysis, Insights and Forecast - by Application
- 11. North America Chemical Software Industry Analysis, Insights and Forecast, 2019-2031
- 11.1. Market Analysis, Insights and Forecast - By Country/Sub-region
- 11.1.1 United States
- 11.1.2 Canada
- 11.1.3 Mexico
- 12. Europe Chemical Software Industry Analysis, Insights and Forecast, 2019-2031
- 12.1. Market Analysis, Insights and Forecast - By Country/Sub-region
- 12.1.1 Germany
- 12.1.2 United Kingdom
- 12.1.3 France
- 12.1.4 Italy
- 12.1.5 Spain
- 12.1.6 Rest of Europe
- 13. Asia Pacific Chemical Software Industry Analysis, Insights and Forecast, 2019-2031
- 13.1. Market Analysis, Insights and Forecast - By Country/Sub-region
- 13.1.1 China
- 13.1.2 Japan
- 13.1.3 India
- 13.1.4 Australia
- 13.1.5 South Korea
- 13.1.6 Rest of Asia Pacific
- 14. Middle East and Africa Chemical Software Industry Analysis, Insights and Forecast, 2019-2031
- 14.1. Market Analysis, Insights and Forecast - By Country/Sub-region
- 14.1.1 GCC
- 14.1.2 South Africa
- 14.1.3 Rest of Middle East and Africa
- 15. South America Chemical Software Industry Analysis, Insights and Forecast, 2019-2031
- 15.1. Market Analysis, Insights and Forecast - By Country/Sub-region
- 15.1.1 Brazil
- 15.1.2 Argentina
- 15.1.3 Rest of South America
- 16. Competitive Analysis
- 16.1. Global Market Share Analysis 2024
- 16.2. Company Profiles
- 16.2.1 Chemaxon Ltd
- 16.2.1.1. Overview
- 16.2.1.2. Products
- 16.2.1.3. SWOT Analysis
- 16.2.1.4. Recent Developments
- 16.2.1.5. Financials (Based on Availability)
- 16.2.2 BioSolveIT GmbH
- 16.2.2.1. Overview
- 16.2.2.2. Products
- 16.2.2.3. SWOT Analysis
- 16.2.2.4. Recent Developments
- 16.2.2.5. Financials (Based on Availability)
- 16.2.3 Chemical Computing Group ULC
- 16.2.3.1. Overview
- 16.2.3.2. Products
- 16.2.3.3. SWOT Analysis
- 16.2.3.4. Recent Developments
- 16.2.3.5. Financials (Based on Availability)
- 16.2.4 Molecular Discovery Ltd
- 16.2.4.1. Overview
- 16.2.4.2. Products
- 16.2.4.3. SWOT Analysis
- 16.2.4.4. Recent Developments
- 16.2.4.5. Financials (Based on Availability)
- 16.2.5 Scilligence
- 16.2.5.1. Overview
- 16.2.5.2. Products
- 16.2.5.3. SWOT Analysis
- 16.2.5.4. Recent Developments
- 16.2.5.5. Financials (Based on Availability)
- 16.2.6 Collaborative Drug Discovery Inc
- 16.2.6.1. Overview
- 16.2.6.2. Products
- 16.2.6.3. SWOT Analysis
- 16.2.6.4. Recent Developments
- 16.2.6.5. Financials (Based on Availability)
- 16.2.7 Jubilant Biosys Ltd
- 16.2.7.1. Overview
- 16.2.7.2. Products
- 16.2.7.3. SWOT Analysis
- 16.2.7.4. Recent Developments
- 16.2.7.5. Financials (Based on Availability)
- 16.2.8 Cadence Design Systems Inc (OpenEye Scientific Software Inc )
- 16.2.8.1. Overview
- 16.2.8.2. Products
- 16.2.8.3. SWOT Analysis
- 16.2.8.4. Recent Developments
- 16.2.8.5. Financials (Based on Availability)
- 16.2.9 Schrödinger Inc
- 16.2.9.1. Overview
- 16.2.9.2. Products
- 16.2.9.3. SWOT Analysis
- 16.2.9.4. Recent Developments
- 16.2.9.5. Financials (Based on Availability)
- 16.2.10 Dassault Systemes
- 16.2.10.1. Overview
- 16.2.10.2. Products
- 16.2.10.3. SWOT Analysis
- 16.2.10.4. Recent Developments
- 16.2.10.5. Financials (Based on Availability)
- 16.2.1 Chemaxon Ltd
List of Figures
- Figure 1: Global Chemical Software Industry Revenue Breakdown (Million, %) by Region 2024 & 2032
- Figure 2: North America Chemical Software Industry Revenue (Million), by Country 2024 & 2032
- Figure 3: North America Chemical Software Industry Revenue Share (%), by Country 2024 & 2032
- Figure 4: Europe Chemical Software Industry Revenue (Million), by Country 2024 & 2032
- Figure 5: Europe Chemical Software Industry Revenue Share (%), by Country 2024 & 2032
- Figure 6: Asia Pacific Chemical Software Industry Revenue (Million), by Country 2024 & 2032
- Figure 7: Asia Pacific Chemical Software Industry Revenue Share (%), by Country 2024 & 2032
- Figure 8: Middle East and Africa Chemical Software Industry Revenue (Million), by Country 2024 & 2032
- Figure 9: Middle East and Africa Chemical Software Industry Revenue Share (%), by Country 2024 & 2032
- Figure 10: South America Chemical Software Industry Revenue (Million), by Country 2024 & 2032
- Figure 11: South America Chemical Software Industry Revenue Share (%), by Country 2024 & 2032
- Figure 12: North America Chemical Software Industry Revenue (Million), by Application 2024 & 2032
- Figure 13: North America Chemical Software Industry Revenue Share (%), by Application 2024 & 2032
- Figure 14: North America Chemical Software Industry Revenue (Million), by Country 2024 & 2032
- Figure 15: North America Chemical Software Industry Revenue Share (%), by Country 2024 & 2032
- Figure 16: Europe Chemical Software Industry Revenue (Million), by Application 2024 & 2032
- Figure 17: Europe Chemical Software Industry Revenue Share (%), by Application 2024 & 2032
- Figure 18: Europe Chemical Software Industry Revenue (Million), by Country 2024 & 2032
- Figure 19: Europe Chemical Software Industry Revenue Share (%), by Country 2024 & 2032
- Figure 20: Asia Pacific Chemical Software Industry Revenue (Million), by Application 2024 & 2032
- Figure 21: Asia Pacific Chemical Software Industry Revenue Share (%), by Application 2024 & 2032
- Figure 22: Asia Pacific Chemical Software Industry Revenue (Million), by Country 2024 & 2032
- Figure 23: Asia Pacific Chemical Software Industry Revenue Share (%), by Country 2024 & 2032
- Figure 24: Middle East and Africa Chemical Software Industry Revenue (Million), by Application 2024 & 2032
- Figure 25: Middle East and Africa Chemical Software Industry Revenue Share (%), by Application 2024 & 2032
- Figure 26: Middle East and Africa Chemical Software Industry Revenue (Million), by Country 2024 & 2032
- Figure 27: Middle East and Africa Chemical Software Industry Revenue Share (%), by Country 2024 & 2032
- Figure 28: South America Chemical Software Industry Revenue (Million), by Application 2024 & 2032
- Figure 29: South America Chemical Software Industry Revenue Share (%), by Application 2024 & 2032
- Figure 30: South America Chemical Software Industry Revenue (Million), by Country 2024 & 2032
- Figure 31: South America Chemical Software Industry Revenue Share (%), by Country 2024 & 2032
List of Tables
- Table 1: Global Chemical Software Industry Revenue Million Forecast, by Region 2019 & 2032
- Table 2: Global Chemical Software Industry Revenue Million Forecast, by Application 2019 & 2032
- Table 3: Global Chemical Software Industry Revenue Million Forecast, by Region 2019 & 2032
- Table 4: Global Chemical Software Industry Revenue Million Forecast, by Country 2019 & 2032
- Table 5: United States Chemical Software Industry Revenue (Million) Forecast, by Application 2019 & 2032
- Table 6: Canada Chemical Software Industry Revenue (Million) Forecast, by Application 2019 & 2032
- Table 7: Mexico Chemical Software Industry Revenue (Million) Forecast, by Application 2019 & 2032
- Table 8: Global Chemical Software Industry Revenue Million Forecast, by Country 2019 & 2032
- Table 9: Germany Chemical Software Industry Revenue (Million) Forecast, by Application 2019 & 2032
- Table 10: United Kingdom Chemical Software Industry Revenue (Million) Forecast, by Application 2019 & 2032
- Table 11: France Chemical Software Industry Revenue (Million) Forecast, by Application 2019 & 2032
- Table 12: Italy Chemical Software Industry Revenue (Million) Forecast, by Application 2019 & 2032
- Table 13: Spain Chemical Software Industry Revenue (Million) Forecast, by Application 2019 & 2032
- Table 14: Rest of Europe Chemical Software Industry Revenue (Million) Forecast, by Application 2019 & 2032
- Table 15: Global Chemical Software Industry Revenue Million Forecast, by Country 2019 & 2032
- Table 16: China Chemical Software Industry Revenue (Million) Forecast, by Application 2019 & 2032
- Table 17: Japan Chemical Software Industry Revenue (Million) Forecast, by Application 2019 & 2032
- Table 18: India Chemical Software Industry Revenue (Million) Forecast, by Application 2019 & 2032
- Table 19: Australia Chemical Software Industry Revenue (Million) Forecast, by Application 2019 & 2032
- Table 20: South Korea Chemical Software Industry Revenue (Million) Forecast, by Application 2019 & 2032
- Table 21: Rest of Asia Pacific Chemical Software Industry Revenue (Million) Forecast, by Application 2019 & 2032
- Table 22: Global Chemical Software Industry Revenue Million Forecast, by Country 2019 & 2032
- Table 23: GCC Chemical Software Industry Revenue (Million) Forecast, by Application 2019 & 2032
- Table 24: South Africa Chemical Software Industry Revenue (Million) Forecast, by Application 2019 & 2032
- Table 25: Rest of Middle East and Africa Chemical Software Industry Revenue (Million) Forecast, by Application 2019 & 2032
- Table 26: Global Chemical Software Industry Revenue Million Forecast, by Country 2019 & 2032
- Table 27: Brazil Chemical Software Industry Revenue (Million) Forecast, by Application 2019 & 2032
- Table 28: Argentina Chemical Software Industry Revenue (Million) Forecast, by Application 2019 & 2032
- Table 29: Rest of South America Chemical Software Industry Revenue (Million) Forecast, by Application 2019 & 2032
- Table 30: Global Chemical Software Industry Revenue Million Forecast, by Application 2019 & 2032
- Table 31: Global Chemical Software Industry Revenue Million Forecast, by Country 2019 & 2032
- Table 32: United States Chemical Software Industry Revenue (Million) Forecast, by Application 2019 & 2032
- Table 33: Canada Chemical Software Industry Revenue (Million) Forecast, by Application 2019 & 2032
- Table 34: Mexico Chemical Software Industry Revenue (Million) Forecast, by Application 2019 & 2032
- Table 35: Global Chemical Software Industry Revenue Million Forecast, by Application 2019 & 2032
- Table 36: Global Chemical Software Industry Revenue Million Forecast, by Country 2019 & 2032
- Table 37: Germany Chemical Software Industry Revenue (Million) Forecast, by Application 2019 & 2032
- Table 38: United Kingdom Chemical Software Industry Revenue (Million) Forecast, by Application 2019 & 2032
- Table 39: France Chemical Software Industry Revenue (Million) Forecast, by Application 2019 & 2032
- Table 40: Italy Chemical Software Industry Revenue (Million) Forecast, by Application 2019 & 2032
- Table 41: Spain Chemical Software Industry Revenue (Million) Forecast, by Application 2019 & 2032
- Table 42: Rest of Europe Chemical Software Industry Revenue (Million) Forecast, by Application 2019 & 2032
- Table 43: Global Chemical Software Industry Revenue Million Forecast, by Application 2019 & 2032
- Table 44: Global Chemical Software Industry Revenue Million Forecast, by Country 2019 & 2032
- Table 45: China Chemical Software Industry Revenue (Million) Forecast, by Application 2019 & 2032
- Table 46: Japan Chemical Software Industry Revenue (Million) Forecast, by Application 2019 & 2032
- Table 47: India Chemical Software Industry Revenue (Million) Forecast, by Application 2019 & 2032
- Table 48: Australia Chemical Software Industry Revenue (Million) Forecast, by Application 2019 & 2032
- Table 49: South Korea Chemical Software Industry Revenue (Million) Forecast, by Application 2019 & 2032
- Table 50: Rest of Asia Pacific Chemical Software Industry Revenue (Million) Forecast, by Application 2019 & 2032
- Table 51: Global Chemical Software Industry Revenue Million Forecast, by Application 2019 & 2032
- Table 52: Global Chemical Software Industry Revenue Million Forecast, by Country 2019 & 2032
- Table 53: GCC Chemical Software Industry Revenue (Million) Forecast, by Application 2019 & 2032
- Table 54: South Africa Chemical Software Industry Revenue (Million) Forecast, by Application 2019 & 2032
- Table 55: Rest of Middle East and Africa Chemical Software Industry Revenue (Million) Forecast, by Application 2019 & 2032
- Table 56: Global Chemical Software Industry Revenue Million Forecast, by Application 2019 & 2032
- Table 57: Global Chemical Software Industry Revenue Million Forecast, by Country 2019 & 2032
- Table 58: Brazil Chemical Software Industry Revenue (Million) Forecast, by Application 2019 & 2032
- Table 59: Argentina Chemical Software Industry Revenue (Million) Forecast, by Application 2019 & 2032
- Table 60: Rest of South America Chemical Software Industry Revenue (Million) Forecast, by Application 2019 & 2032
Frequently Asked Questions
1. What is the projected Compound Annual Growth Rate (CAGR) of the Chemical Software Industry?
The projected CAGR is approximately 15.50%.
2. Which companies are prominent players in the Chemical Software Industry?
Key companies in the market include Chemaxon Ltd, BioSolveIT GmbH, Chemical Computing Group ULC, Molecular Discovery Ltd, Scilligence, Collaborative Drug Discovery Inc, Jubilant Biosys Ltd, Cadence Design Systems Inc (OpenEye Scientific Software Inc ), Schrödinger Inc, Dassault Systemes.
3. What are the main segments of the Chemical Software Industry?
The market segments include Application.
4. Can you provide details about the market size?
The market size is estimated to be USD 6.10 Million as of 2022.
5. What are some drivers contributing to market growth?
Innovations and Advancements in the Drug Development Process; Increased Demand of Personalized Medicine.
6. What are the notable trends driving market growth?
Virtual Screening Segment is Expected to Witness Growth in the Market Over the Forecast Period.
7. Are there any restraints impacting market growth?
Lack of Skilled Labors.
8. Can you provide examples of recent developments in the market?
In October 2023, Cadence Molecular Sciences (OpenEye) announced that Pfizer Inc. has signed an agreement to extend and expand access to Cadence products and programming toolkits for advanced molecular design. Cadence Molecular Sciences’ physics-and AI-based modelling and cheminformatics computational software is an enabler of early-stage drug discovery innovation.
9. What pricing options are available for accessing the report?
Pricing options include single-user, multi-user, and enterprise licenses priced at USD 4750, USD 5250, and USD 8750 respectively.
10. Is the market size provided in terms of value or volume?
The market size is provided in terms of value, measured in Million.
11. Are there any specific market keywords associated with the report?
Yes, the market keyword associated with the report is "Chemical Software Industry," which aids in identifying and referencing the specific market segment covered.
12. How do I determine which pricing option suits my needs best?
The pricing options vary based on user requirements and access needs. Individual users may opt for single-user licenses, while businesses requiring broader access may choose multi-user or enterprise licenses for cost-effective access to the report.
13. Are there any additional resources or data provided in the Chemical Software Industry report?
While the report offers comprehensive insights, it's advisable to review the specific contents or supplementary materials provided to ascertain if additional resources or data are available.
14. How can I stay updated on further developments or reports in the Chemical Software Industry?
To stay informed about further developments, trends, and reports in the Chemical Software Industry, consider subscribing to industry newsletters, following relevant companies and organizations, or regularly checking reputable industry news sources and publications.
Methodology
Step 1 - Identification of Relevant Samples Size from Population Database


Step 2 - Approaches for Defining Global Market Size (Value, Volume* & Price*)

Note*: In applicable scenarios
Step 3 - Data Sources
Primary Research
- Web Analytics
- Survey Reports
- Research Institute
- Latest Research Reports
- Opinion Leaders
Secondary Research
- Annual Reports
- White Paper
- Latest Press Release
- Industry Association
- Paid Database
- Investor Presentations

Step 4 - Data Triangulation
Involves using different sources of information in order to increase the validity of a study
These sources are likely to be stakeholders in a program - participants, other researchers, program staff, other community members, and so on.
Then we put all data in single framework & apply various statistical tools to find out the dynamic on the market.
During the analysis stage, feedback from the stakeholder groups would be compared to determine areas of agreement as well as areas of divergence


