

Key Insights
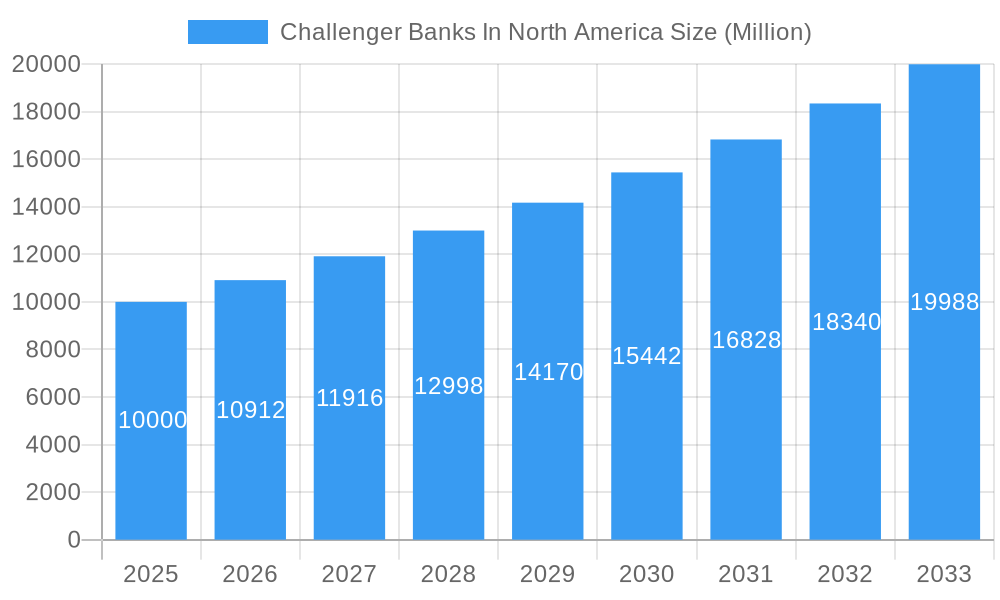
The North American challenger bank market, valued at approximately $10 billion in 2025, is experiencing robust growth, projected to expand at a Compound Annual Growth Rate (CAGR) of 9.12% from 2025 to 2033. This surge is driven by several key factors. Firstly, increasing consumer demand for digital-first banking solutions, characterized by user-friendly mobile apps, streamlined onboarding processes, and personalized financial management tools, fuels the adoption of challenger banks. Secondly, the inherent limitations of traditional banking models, such as high fees and complex processes, are pushing customers towards more transparent and convenient alternatives. Finally, the innovative offerings of challenger banks, including features like budgeting tools, early paycheck access, and investment options integrated within their platforms, are proving particularly attractive to younger demographics and digitally savvy consumers. Competition within the market is fierce, with established players like Chime, Varo, and Aspiration vying for market share alongside newer entrants. The market's continued expansion hinges on the continued success of these banks in attracting and retaining customers, adapting to evolving consumer preferences, and navigating the regulatory landscape.
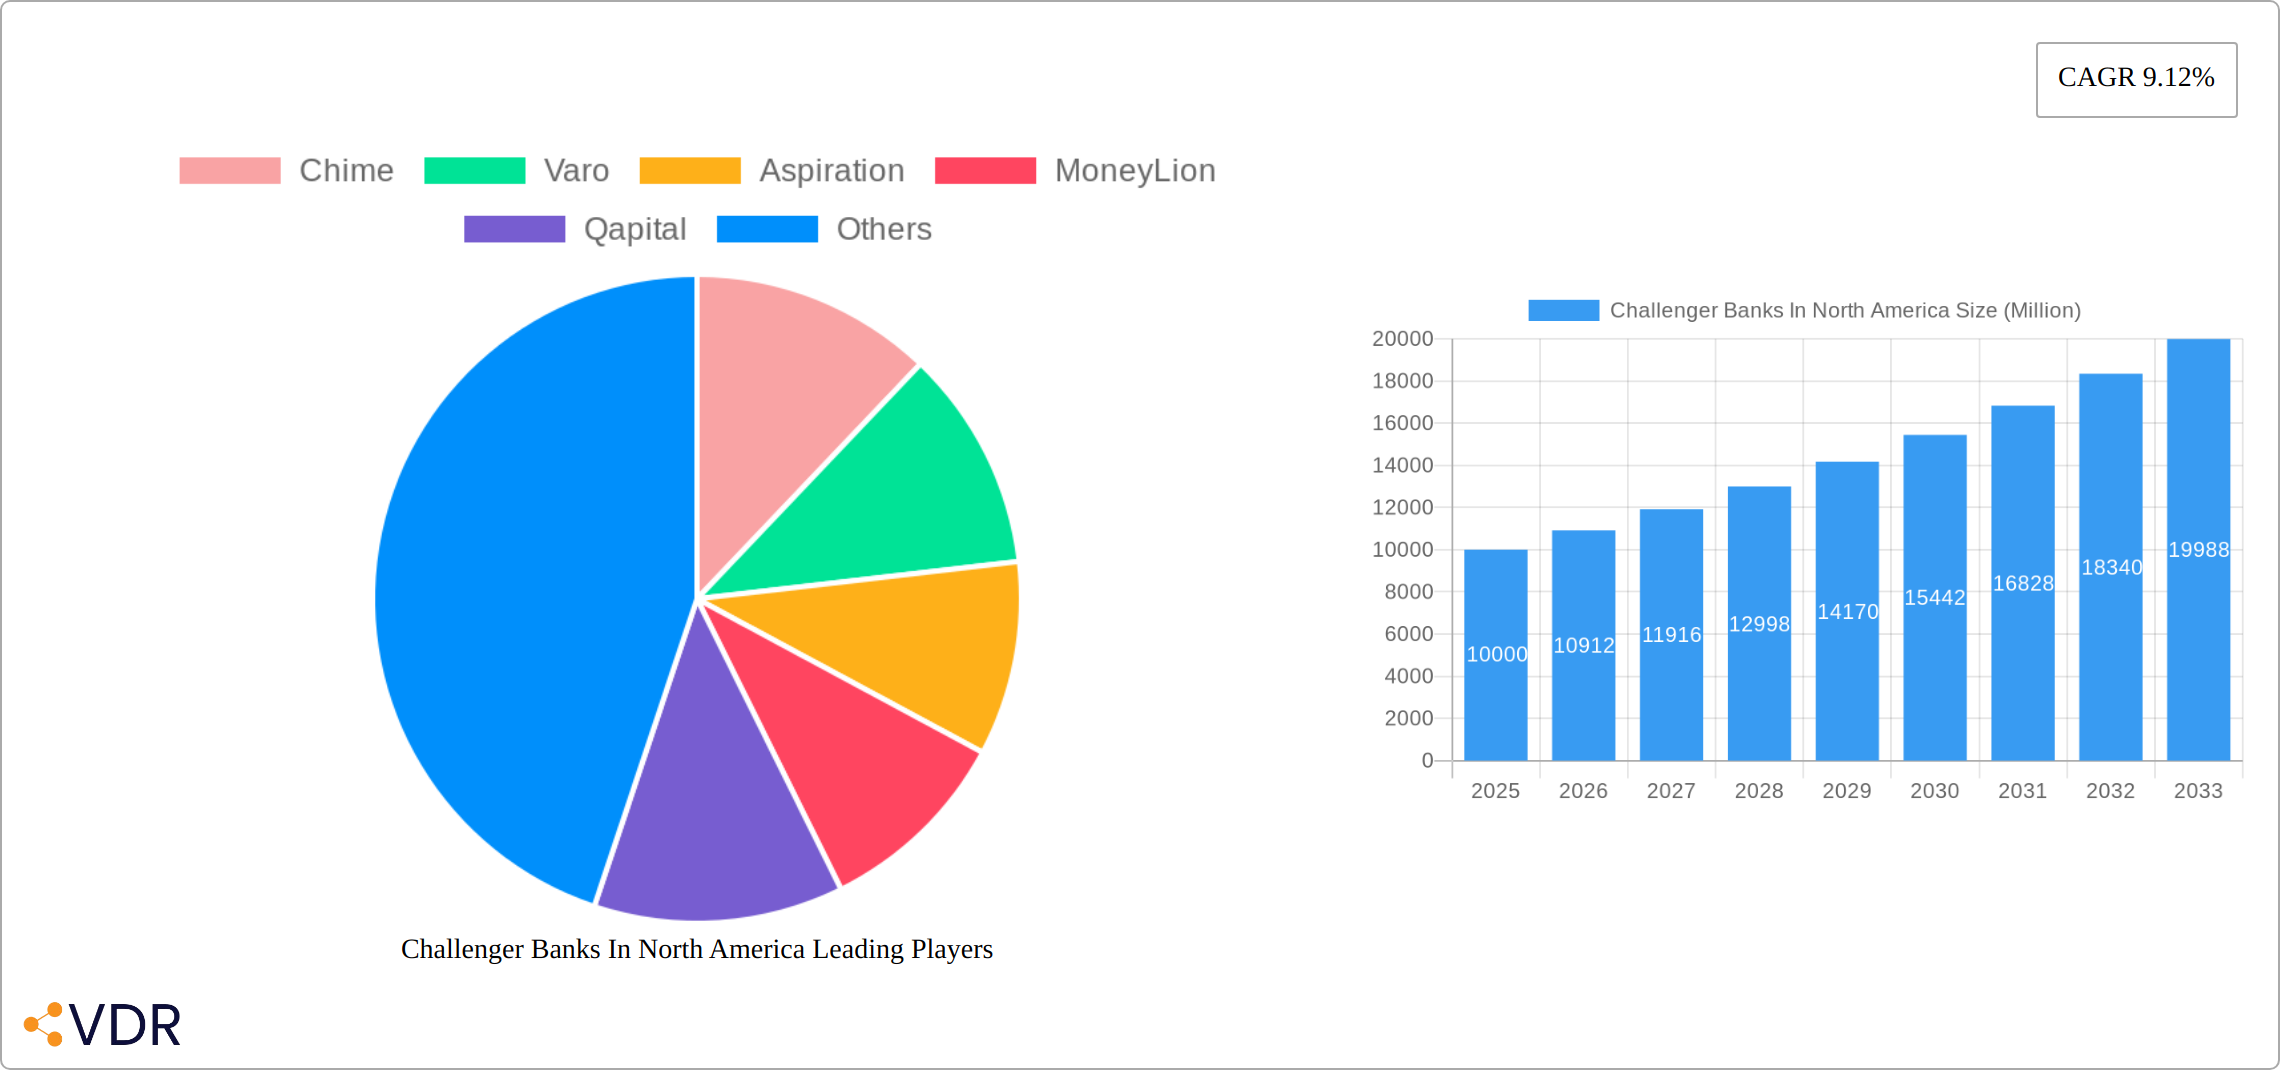
Challenger Banks In North America Market Size (In Billion)
The forecast period (2025-2033) anticipates continued market expansion, fueled by technological advancements and shifting consumer expectations. However, challenges remain. Regulatory scrutiny and the potential for increased competition from established financial institutions could present headwinds. Moreover, maintaining profitability while offering competitive services and managing operational costs will be crucial for challenger banks to succeed long-term. Strategic partnerships and product diversification will likely play significant roles in shaping the competitive landscape and driving innovation within the North American challenger banking sector. The focus on enhancing customer experience, particularly through advanced technologies like AI-powered financial management tools, will be a defining factor in the market's future trajectory.
Challenger Banks In North America Company Market Share
Challenger Banks in North America: Market Report 2019-2033
This comprehensive report provides a detailed analysis of the North American challenger bank market, encompassing market dynamics, growth trends, competitive landscape, and future outlook. The study period covers 2019-2033, with 2025 as the base and estimated year. This report is crucial for investors, financial institutions, fintech companies, and industry professionals seeking to understand and capitalize on the evolving landscape of digital banking. The report analyzes key players such as Chime, Varo, Aspiration, MoneyLion, Qapital, BankMobile, Upgrade, Dave, Zero, Stash, Deserve, and Current (list not exhaustive), across various segments.
Challenger Banks In North America Market Dynamics & Structure
The North American challenger banking sector is a dynamic arena defined by intense competition, rapid technological advancements, evolving regulatory landscapes, and shifting consumer preferences. This interplay of established financial institutions and disruptive newcomers fosters both collaboration and fierce rivalry, shaping the market's structure and trajectory.
- Market Concentration and Competitive Intensity: While a few dominant players hold significant market share, the market exhibits a moderately concentrated structure with numerous smaller, niche players vying for position. This leads to intense competition, forcing continuous innovation and strategic partnerships. The full report provides detailed market share data for key players, including projections for 2025 and beyond (e.g., Chime's projected market share). Furthermore, the report details the projected rate of mergers and acquisitions (M&A) activity within the forecast period, offering insights into consolidation trends.
- Technological Innovation as a Key Differentiator: Mobile-first strategies are paramount, but challenger banks are also leveraging AI-powered personalization, sophisticated data analytics, and open banking APIs to create seamless and highly customized user experiences. These technological advancements drive product innovation and enhance the overall value proposition for customers.
- Navigating the Regulatory Maze: The regulatory environment is a significant factor influencing operational strategies and market entry barriers. Evolving regulations regarding data privacy (e.g., CCPA, GDPR implications), cybersecurity, and financial compliance necessitate robust risk management frameworks and ongoing adaptation by challenger banks.
- Competitive Landscape: A Three-Way Battle: Challenger banks face fierce competition not only from each other but also from established traditional banks and other fintech companies. This necessitates a continuous cycle of innovation, strategic partnerships, and efficient resource allocation to maintain a competitive edge.
- Understanding the Target Demographics: Millennials and Gen Z are key target demographics for challenger banks. Their strong preference for digital-first banking experiences, personalized financial solutions, and seamless user interfaces fuels the demand for innovative products and services tailored to their specific needs.
- M&A Activity and Market Consolidation: Consolidation is anticipated to continue, with larger players strategically acquiring smaller challengers to expand their market reach, product portfolios, and customer base. This trend will likely reshape the competitive landscape in the coming years.
Challenger Banks In North America Growth Trends & Insights
The North American challenger banking market is experiencing robust growth, driven by a confluence of factors including technological disruptions, evolving consumer behavior, and favorable regulatory shifts. This section provides a detailed analysis of market size evolution, adoption rates, and key growth drivers, leveraging proprietary data and industry insights to project market trajectories from 2019 to 2033. The analysis includes:
- CAGR Projections: Detailed Compound Annual Growth Rate (CAGR) projections for the forecast period, providing a clear picture of market expansion.
- Market Penetration Rates: Analysis of market penetration rates across various demographics and geographic regions, highlighting areas of high growth potential.
- Technological Disruptions: In-depth examination of the impact of technological disruptions, such as the rise of embedded finance and the increasing integration of AI and machine learning, on market growth.
- Shifting Consumer Behavior: Analysis of evolving consumer behavior, including increased demand for personalized financial services, mobile-first banking, and seamless digital experiences.
- Detailed Market Size Evolution (2019-2033): A comprehensive breakdown of market size evolution over the forecast period, providing granular insights into growth patterns and underlying drivers. This includes regional and segment-specific analyses.
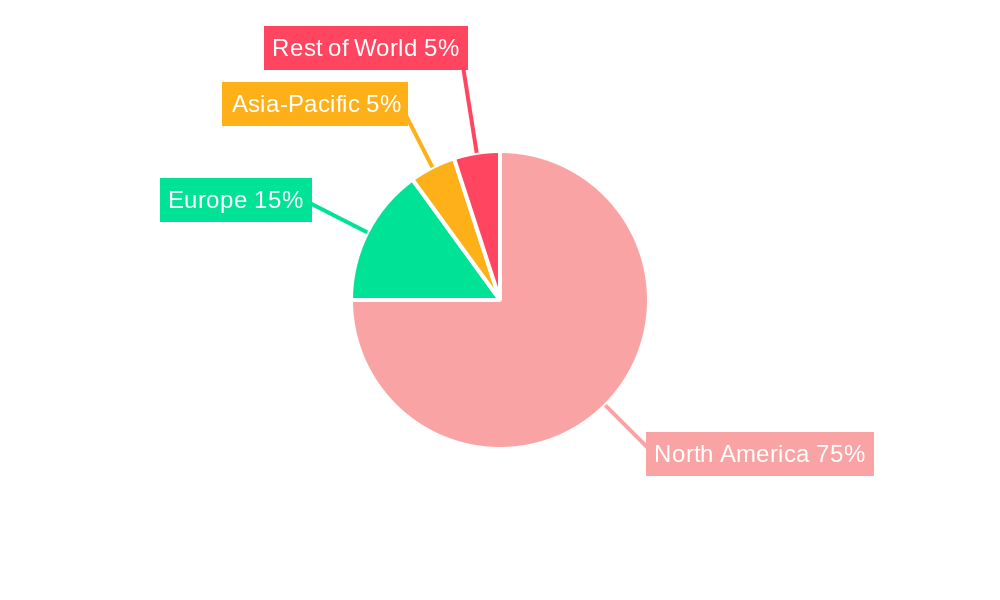
Dominant Regions, Countries, or Segments in Challenger Banks In North America
The United States currently dominates the North American challenger banking market, but Canada presents significant growth potential. This section provides a detailed regional breakdown, highlighting key drivers and growth prospects in each region, and examining the dominance of specific segments (e.g., mobile-only banks versus hybrid models).
- US Market Leadership: The US market dominance is fueled by a combination of factors, including high smartphone penetration rates, a tech-savvy population receptive to digital banking solutions, a relatively favorable regulatory environment compared to other regions, and substantial venture capital funding that supports innovation and growth. The analysis will delve deeper into these drivers, providing specific data and insights.
- Canada's Emerging Potential: Canada's challenger banking sector is experiencing significant growth driven by an expanding fintech ecosystem, increasing adoption of digital banking services, and government initiatives that support financial technology innovation. This section will analyze the specific factors contributing to this growth and assess its future trajectory.
(Detailed market share data by country and region, examining the dominance of specific segments (e.g., mobile-only banks versus those offering hybrid models), and analyzing the future growth potential of different regions and segments will be provided in the full report.)
Challenger Banks In North America Product Landscape
Challenger banks offer a diverse and evolving product landscape, extending beyond traditional banking services. This section examines the range of products and services offered, highlighting key innovations and the role of technology in driving product differentiation and market competition. The analysis will also address key performance indicators (KPIs) used to measure product success.
- Core Offerings: Mobile-first checking and savings accounts form the foundation of most challenger bank offerings. These are frequently complemented by personalized financial management tools designed to enhance user financial literacy and well-being.
- Innovative Lending Solutions: Challenger banks often offer innovative lending solutions, leveraging technology to streamline the application process and offer customized loan options.
- Unique Value-Added Services: Many challenger banks utilize technology to provide unique features such as early paycheck access, budgeting assistance, automated savings plans, and advanced fraud detection, all aimed at enhancing the customer experience and fostering loyalty.
- Key Performance Indicators (KPIs): Metrics such as customer acquisition cost (CAC), customer lifetime value (CLTV), and Net Promoter Score (NPS) are crucial for assessing the success and profitability of challenger bank products and services. The full report will provide detailed analysis of these KPIs.
Key Drivers, Barriers & Challenges in Challenger Banks In North America
The success of challenger banks in North America depends on their ability to navigate a complex interplay of opportunities and challenges. This section provides a balanced overview of the key drivers, barriers, and restraints shaping the market's trajectory.
Key Drivers:
- Soaring Demand for Digital Banking: Consumers increasingly seek convenient, digital-first banking experiences, creating significant growth opportunities for challenger banks.
- Technological Advancements Fuel Innovation: AI, machine learning, open banking, and other technologies are driving product innovation and enabling personalized financial services.
- Regulatory Changes Open Doors: Regulatory changes are creating opportunities for new entrants and encouraging innovation in the financial services industry.
- Increased Adoption of Mobile Payments: The widespread adoption of mobile payments and peer-to-peer (P2P) transfers is driving demand for digital banking solutions.
Key Challenges and Restraints:
- Fierce Competition: Intense competition from established banks and other fintechs requires continuous innovation and strategic differentiation to succeed.
- Regulatory Uncertainty and Compliance Costs: Navigating evolving regulations and compliance requirements adds complexity and increases operational costs.
- Cybersecurity Threats Loom Large: The risk of cybersecurity breaches and data leaks poses a significant challenge, requiring robust security measures and proactive risk management.
- Customer Acquisition and Profitability: Acquiring new customers and achieving profitability can be challenging, particularly given the high customer acquisition costs. (e.g., estimated at xx Million per customer in 2025).
Emerging Opportunities in Challenger Banks In North America
- Expansion into underserved markets (e.g., underbanked populations).
- Development of new financial products catering to specific needs (e.g., student loans, small business loans).
- Leveraging AI and machine learning for personalized financial advice.
- Strategic partnerships with other fintech companies and businesses.
Growth Accelerators in the Challenger Banks In North America Industry
Long-term growth is driven by technological innovation, strategic partnerships, and expansion into new geographic markets and product categories. The increasing adoption of embedded finance, where financial services are integrated into non-financial applications, presents a significant growth opportunity. Furthermore, the growing demand for personalized financial services, driven by AI-powered solutions, will continue to fuel market expansion.
Notable Milestones in Challenger Banks In North America Sector
- October 2022: Aspiration launched its Aspiration Zero Credit Card.
- March 2023: Varo Bank raised USD 50 million at a USD 1.8 billion valuation.
In-Depth Challenger Banks In North America Market Outlook
The North American challenger bank market is poised for continued growth, driven by technological advancements, evolving consumer preferences, and expanding product offerings. Strategic partnerships and expansion into new market segments will be key factors in determining future market leadership. The market is expected to reach xx Million by 2033, presenting significant opportunities for both established players and new entrants.
Challenger Banks In North America Segmentation
-
1. Service Type
- 1.1. Loans
- 1.2. Mobile Banking
- 1.3. Checking & Savings Account
- 1.4. Payment & Money Transfer
- 1.5. Others
-
2. End-User Type
- 2.1. Business
- 2.2. Personal
Challenger Banks In North America Segmentation By Geography
-
1. North America
- 1.1. United States
- 1.2. Canada
- 1.3. Mexico
-
2. South America
- 2.1. Brazil
- 2.2. Argentina
- 2.3. Rest of South America
-
3. Europe
- 3.1. United Kingdom
- 3.2. Germany
- 3.3. France
- 3.4. Italy
- 3.5. Spain
- 3.6. Russia
- 3.7. Benelux
- 3.8. Nordics
- 3.9. Rest of Europe
-
4. Middle East & Africa
- 4.1. Turkey
- 4.2. Israel
- 4.3. GCC
- 4.4. North Africa
- 4.5. South Africa
- 4.6. Rest of Middle East & Africa
-
5. Asia Pacific
- 5.1. China
- 5.2. India
- 5.3. Japan
- 5.4. South Korea
- 5.5. ASEAN
- 5.6. Oceania
- 5.7. Rest of Asia Pacific
Challenger Banks In North America Regional Market Share
Geographic Coverage of Challenger Banks In North America
Challenger Banks In North America REPORT HIGHLIGHTS
| Aspects | Details |
|---|---|
| Study Period | 2020-2034 |
| Base Year | 2025 |
| Estimated Year | 2026 |
| Forecast Period | 2026-2034 |
| Historical Period | 2020-2025 |
| Growth Rate | CAGR of 9.12% from 2020-2034 |
| Segmentation |
|
Table of Contents
- 1. Introduction
- 1.1. Research Scope
- 1.2. Market Segmentation
- 1.3. Research Objective
- 1.4. Definitions and Assumptions
- 2. Executive Summary
- 2.1. Market Snapshot
- 3. Market Dynamics
- 3.1. Market Drivers
- 3.2. Market Restrains
- 3.3. Market Trends
- 3.4. Market Opportunities
- 4. Market Factor Analysis
- 4.1. Porters Five Forces
- 4.1.1. Bargaining Power of Suppliers
- 4.1.2. Bargaining Power of Buyers
- 4.1.3. Threat of New Entrants
- 4.1.4. Threat of Substitutes
- 4.1.5. Competitive Rivalry
- 4.2. PESTEL analysis
- 4.3. BCG Analysis
- 4.3.1. Stars (High Growth, High Market Share)
- 4.3.2. Cash Cows (Low Growth, High Market Share)
- 4.3.3. Question Mark (High Growth, Low Market Share)
- 4.3.4. Dogs (Low Growth, Low Market Share)
- 4.4. Ansoff Matrix Analysis
- 4.5. Supply Chain Analysis
- 4.6. Regulatory Landscape
- 4.7. Current Market Potential and Opportunity Assessment (TAM–SAM–SOM Framework)
- 4.8. VDR Analyst Note
- 4.1. Porters Five Forces
- 5. Market Analysis, Insights and Forecast 2021-2033
- 5.1. Market Analysis, Insights and Forecast - by Service Type
- 5.1.1. Loans
- 5.1.2. Mobile Banking
- 5.1.3. Checking & Savings Account
- 5.1.4. Payment & Money Transfer
- 5.1.5. Others
- 5.2. Market Analysis, Insights and Forecast - by End-User Type
- 5.2.1. Business
- 5.2.2. Personal
- 5.3. Market Analysis, Insights and Forecast - by Region
- 5.3.1. North America
- 5.3.2. South America
- 5.3.3. Europe
- 5.3.4. Middle East & Africa
- 5.3.5. Asia Pacific
- 5.1. Market Analysis, Insights and Forecast - by Service Type
- 6. Global Challenger Banks In North America Analysis, Insights and Forecast, 2021-2033
- 6.1. Market Analysis, Insights and Forecast - by Service Type
- 6.1.1. Loans
- 6.1.2. Mobile Banking
- 6.1.3. Checking & Savings Account
- 6.1.4. Payment & Money Transfer
- 6.1.5. Others
- 6.2. Market Analysis, Insights and Forecast - by End-User Type
- 6.2.1. Business
- 6.2.2. Personal
- 6.1. Market Analysis, Insights and Forecast - by Service Type
- 7. North America Challenger Banks In North America Analysis, Insights and Forecast, 2021-2033
- 7.1. Market Analysis, Insights and Forecast - by Service Type
- 7.1.1. Loans
- 7.1.2. Mobile Banking
- 7.1.3. Checking & Savings Account
- 7.1.4. Payment & Money Transfer
- 7.1.5. Others
- 7.2. Market Analysis, Insights and Forecast - by End-User Type
- 7.2.1. Business
- 7.2.2. Personal
- 7.1. Market Analysis, Insights and Forecast - by Service Type
- 8. South America Challenger Banks In North America Analysis, Insights and Forecast, 2021-2033
- 8.1. Market Analysis, Insights and Forecast - by Service Type
- 8.1.1. Loans
- 8.1.2. Mobile Banking
- 8.1.3. Checking & Savings Account
- 8.1.4. Payment & Money Transfer
- 8.1.5. Others
- 8.2. Market Analysis, Insights and Forecast - by End-User Type
- 8.2.1. Business
- 8.2.2. Personal
- 8.1. Market Analysis, Insights and Forecast - by Service Type
- 9. Europe Challenger Banks In North America Analysis, Insights and Forecast, 2021-2033
- 9.1. Market Analysis, Insights and Forecast - by Service Type
- 9.1.1. Loans
- 9.1.2. Mobile Banking
- 9.1.3. Checking & Savings Account
- 9.1.4. Payment & Money Transfer
- 9.1.5. Others
- 9.2. Market Analysis, Insights and Forecast - by End-User Type
- 9.2.1. Business
- 9.2.2. Personal
- 9.1. Market Analysis, Insights and Forecast - by Service Type
- 10. Middle East & Africa Challenger Banks In North America Analysis, Insights and Forecast, 2021-2033
- 10.1. Market Analysis, Insights and Forecast - by Service Type
- 10.1.1. Loans
- 10.1.2. Mobile Banking
- 10.1.3. Checking & Savings Account
- 10.1.4. Payment & Money Transfer
- 10.1.5. Others
- 10.2. Market Analysis, Insights and Forecast - by End-User Type
- 10.2.1. Business
- 10.2.2. Personal
- 10.1. Market Analysis, Insights and Forecast - by Service Type
- 11. Asia Pacific Challenger Banks In North America Analysis, Insights and Forecast, 2021-2033
- 11.1. Market Analysis, Insights and Forecast - by Service Type
- 11.1.1. Loans
- 11.1.2. Mobile Banking
- 11.1.3. Checking & Savings Account
- 11.1.4. Payment & Money Transfer
- 11.1.5. Others
- 11.2. Market Analysis, Insights and Forecast - by End-User Type
- 11.2.1. Business
- 11.2.2. Personal
- 11.1. Market Analysis, Insights and Forecast - by Service Type
- 12. Competitive Analysis
- 12.1. Company Profiles
- 12.1.1 Chime
- 12.1.1.1. Company Overview
- 12.1.1.2. Products
- 12.1.1.3. Company Financials
- 12.1.1.4. SWOT Analysis
- 12.1.2 Varo
- 12.1.2.1. Company Overview
- 12.1.2.2. Products
- 12.1.2.3. Company Financials
- 12.1.2.4. SWOT Analysis
- 12.1.3 Aspiration
- 12.1.3.1. Company Overview
- 12.1.3.2. Products
- 12.1.3.3. Company Financials
- 12.1.3.4. SWOT Analysis
- 12.1.4 MoneyLion
- 12.1.4.1. Company Overview
- 12.1.4.2. Products
- 12.1.4.3. Company Financials
- 12.1.4.4. SWOT Analysis
- 12.1.5 Qapital
- 12.1.5.1. Company Overview
- 12.1.5.2. Products
- 12.1.5.3. Company Financials
- 12.1.5.4. SWOT Analysis
- 12.1.6 BankMobile
- 12.1.6.1. Company Overview
- 12.1.6.2. Products
- 12.1.6.3. Company Financials
- 12.1.6.4. SWOT Analysis
- 12.1.7 Upgrade
- 12.1.7.1. Company Overview
- 12.1.7.2. Products
- 12.1.7.3. Company Financials
- 12.1.7.4. SWOT Analysis
- 12.1.8 Dave
- 12.1.8.1. Company Overview
- 12.1.8.2. Products
- 12.1.8.3. Company Financials
- 12.1.8.4. SWOT Analysis
- 12.1.9 Zero
- 12.1.9.1. Company Overview
- 12.1.9.2. Products
- 12.1.9.3. Company Financials
- 12.1.9.4. SWOT Analysis
- 12.1.10 Stash
- 12.1.10.1. Company Overview
- 12.1.10.2. Products
- 12.1.10.3. Company Financials
- 12.1.10.4. SWOT Analysis
- 12.1.11 Deserve
- 12.1.11.1. Company Overview
- 12.1.11.2. Products
- 12.1.11.3. Company Financials
- 12.1.11.4. SWOT Analysis
- 12.1.12 Current**List Not Exhaustive
- 12.1.12.1. Company Overview
- 12.1.12.2. Products
- 12.1.12.3. Company Financials
- 12.1.12.4. SWOT Analysis
- 12.1.1 Chime
- 12.2. Market Entropy
- 12.2.1 Company's Key Areas Served
- 12.2.2 Recent Developments
- 12.3. Company Market Share Analysis 2025
- 12.3.1 Top 5 Companies Market Share Analysis
- 12.3.2 Top 3 Companies Market Share Analysis
- 12.4. List of Potential Customers
- 13. Research Methodology
List of Figures
- Figure 1: Global Challenger Banks In North America Revenue Breakdown (Million, %) by Region 2025 & 2033
- Figure 2: Global Challenger Banks In North America Volume Breakdown (Billion, %) by Region 2025 & 2033
- Figure 3: North America Challenger Banks In North America Revenue (Million), by Service Type 2025 & 2033
- Figure 4: North America Challenger Banks In North America Volume (Billion), by Service Type 2025 & 2033
- Figure 5: North America Challenger Banks In North America Revenue Share (%), by Service Type 2025 & 2033
- Figure 6: North America Challenger Banks In North America Volume Share (%), by Service Type 2025 & 2033
- Figure 7: North America Challenger Banks In North America Revenue (Million), by End-User Type 2025 & 2033
- Figure 8: North America Challenger Banks In North America Volume (Billion), by End-User Type 2025 & 2033
- Figure 9: North America Challenger Banks In North America Revenue Share (%), by End-User Type 2025 & 2033
- Figure 10: North America Challenger Banks In North America Volume Share (%), by End-User Type 2025 & 2033
- Figure 11: North America Challenger Banks In North America Revenue (Million), by Country 2025 & 2033
- Figure 12: North America Challenger Banks In North America Volume (Billion), by Country 2025 & 2033
- Figure 13: North America Challenger Banks In North America Revenue Share (%), by Country 2025 & 2033
- Figure 14: North America Challenger Banks In North America Volume Share (%), by Country 2025 & 2033
- Figure 15: South America Challenger Banks In North America Revenue (Million), by Service Type 2025 & 2033
- Figure 16: South America Challenger Banks In North America Volume (Billion), by Service Type 2025 & 2033
- Figure 17: South America Challenger Banks In North America Revenue Share (%), by Service Type 2025 & 2033
- Figure 18: South America Challenger Banks In North America Volume Share (%), by Service Type 2025 & 2033
- Figure 19: South America Challenger Banks In North America Revenue (Million), by End-User Type 2025 & 2033
- Figure 20: South America Challenger Banks In North America Volume (Billion), by End-User Type 2025 & 2033
- Figure 21: South America Challenger Banks In North America Revenue Share (%), by End-User Type 2025 & 2033
- Figure 22: South America Challenger Banks In North America Volume Share (%), by End-User Type 2025 & 2033
- Figure 23: South America Challenger Banks In North America Revenue (Million), by Country 2025 & 2033
- Figure 24: South America Challenger Banks In North America Volume (Billion), by Country 2025 & 2033
- Figure 25: South America Challenger Banks In North America Revenue Share (%), by Country 2025 & 2033
- Figure 26: South America Challenger Banks In North America Volume Share (%), by Country 2025 & 2033
- Figure 27: Europe Challenger Banks In North America Revenue (Million), by Service Type 2025 & 2033
- Figure 28: Europe Challenger Banks In North America Volume (Billion), by Service Type 2025 & 2033
- Figure 29: Europe Challenger Banks In North America Revenue Share (%), by Service Type 2025 & 2033
- Figure 30: Europe Challenger Banks In North America Volume Share (%), by Service Type 2025 & 2033
- Figure 31: Europe Challenger Banks In North America Revenue (Million), by End-User Type 2025 & 2033
- Figure 32: Europe Challenger Banks In North America Volume (Billion), by End-User Type 2025 & 2033
- Figure 33: Europe Challenger Banks In North America Revenue Share (%), by End-User Type 2025 & 2033
- Figure 34: Europe Challenger Banks In North America Volume Share (%), by End-User Type 2025 & 2033
- Figure 35: Europe Challenger Banks In North America Revenue (Million), by Country 2025 & 2033
- Figure 36: Europe Challenger Banks In North America Volume (Billion), by Country 2025 & 2033
- Figure 37: Europe Challenger Banks In North America Revenue Share (%), by Country 2025 & 2033
- Figure 38: Europe Challenger Banks In North America Volume Share (%), by Country 2025 & 2033
- Figure 39: Middle East & Africa Challenger Banks In North America Revenue (Million), by Service Type 2025 & 2033
- Figure 40: Middle East & Africa Challenger Banks In North America Volume (Billion), by Service Type 2025 & 2033
- Figure 41: Middle East & Africa Challenger Banks In North America Revenue Share (%), by Service Type 2025 & 2033
- Figure 42: Middle East & Africa Challenger Banks In North America Volume Share (%), by Service Type 2025 & 2033
- Figure 43: Middle East & Africa Challenger Banks In North America Revenue (Million), by End-User Type 2025 & 2033
- Figure 44: Middle East & Africa Challenger Banks In North America Volume (Billion), by End-User Type 2025 & 2033
- Figure 45: Middle East & Africa Challenger Banks In North America Revenue Share (%), by End-User Type 2025 & 2033
- Figure 46: Middle East & Africa Challenger Banks In North America Volume Share (%), by End-User Type 2025 & 2033
- Figure 47: Middle East & Africa Challenger Banks In North America Revenue (Million), by Country 2025 & 2033
- Figure 48: Middle East & Africa Challenger Banks In North America Volume (Billion), by Country 2025 & 2033
- Figure 49: Middle East & Africa Challenger Banks In North America Revenue Share (%), by Country 2025 & 2033
- Figure 50: Middle East & Africa Challenger Banks In North America Volume Share (%), by Country 2025 & 2033
- Figure 51: Asia Pacific Challenger Banks In North America Revenue (Million), by Service Type 2025 & 2033
- Figure 52: Asia Pacific Challenger Banks In North America Volume (Billion), by Service Type 2025 & 2033
- Figure 53: Asia Pacific Challenger Banks In North America Revenue Share (%), by Service Type 2025 & 2033
- Figure 54: Asia Pacific Challenger Banks In North America Volume Share (%), by Service Type 2025 & 2033
- Figure 55: Asia Pacific Challenger Banks In North America Revenue (Million), by End-User Type 2025 & 2033
- Figure 56: Asia Pacific Challenger Banks In North America Volume (Billion), by End-User Type 2025 & 2033
- Figure 57: Asia Pacific Challenger Banks In North America Revenue Share (%), by End-User Type 2025 & 2033
- Figure 58: Asia Pacific Challenger Banks In North America Volume Share (%), by End-User Type 2025 & 2033
- Figure 59: Asia Pacific Challenger Banks In North America Revenue (Million), by Country 2025 & 2033
- Figure 60: Asia Pacific Challenger Banks In North America Volume (Billion), by Country 2025 & 2033
- Figure 61: Asia Pacific Challenger Banks In North America Revenue Share (%), by Country 2025 & 2033
- Figure 62: Asia Pacific Challenger Banks In North America Volume Share (%), by Country 2025 & 2033
List of Tables
- Table 1: Global Challenger Banks In North America Revenue Million Forecast, by Service Type 2020 & 2033
- Table 2: Global Challenger Banks In North America Volume Billion Forecast, by Service Type 2020 & 2033
- Table 3: Global Challenger Banks In North America Revenue Million Forecast, by End-User Type 2020 & 2033
- Table 4: Global Challenger Banks In North America Volume Billion Forecast, by End-User Type 2020 & 2033
- Table 5: Global Challenger Banks In North America Revenue Million Forecast, by Region 2020 & 2033
- Table 6: Global Challenger Banks In North America Volume Billion Forecast, by Region 2020 & 2033
- Table 7: Global Challenger Banks In North America Revenue Million Forecast, by Service Type 2020 & 2033
- Table 8: Global Challenger Banks In North America Volume Billion Forecast, by Service Type 2020 & 2033
- Table 9: Global Challenger Banks In North America Revenue Million Forecast, by End-User Type 2020 & 2033
- Table 10: Global Challenger Banks In North America Volume Billion Forecast, by End-User Type 2020 & 2033
- Table 11: Global Challenger Banks In North America Revenue Million Forecast, by Country 2020 & 2033
- Table 12: Global Challenger Banks In North America Volume Billion Forecast, by Country 2020 & 2033
- Table 13: United States Challenger Banks In North America Revenue (Million) Forecast, by Application 2020 & 2033
- Table 14: United States Challenger Banks In North America Volume (Billion) Forecast, by Application 2020 & 2033
- Table 15: Canada Challenger Banks In North America Revenue (Million) Forecast, by Application 2020 & 2033
- Table 16: Canada Challenger Banks In North America Volume (Billion) Forecast, by Application 2020 & 2033
- Table 17: Mexico Challenger Banks In North America Revenue (Million) Forecast, by Application 2020 & 2033
- Table 18: Mexico Challenger Banks In North America Volume (Billion) Forecast, by Application 2020 & 2033
- Table 19: Global Challenger Banks In North America Revenue Million Forecast, by Service Type 2020 & 2033
- Table 20: Global Challenger Banks In North America Volume Billion Forecast, by Service Type 2020 & 2033
- Table 21: Global Challenger Banks In North America Revenue Million Forecast, by End-User Type 2020 & 2033
- Table 22: Global Challenger Banks In North America Volume Billion Forecast, by End-User Type 2020 & 2033
- Table 23: Global Challenger Banks In North America Revenue Million Forecast, by Country 2020 & 2033
- Table 24: Global Challenger Banks In North America Volume Billion Forecast, by Country 2020 & 2033
- Table 25: Brazil Challenger Banks In North America Revenue (Million) Forecast, by Application 2020 & 2033
- Table 26: Brazil Challenger Banks In North America Volume (Billion) Forecast, by Application 2020 & 2033
- Table 27: Argentina Challenger Banks In North America Revenue (Million) Forecast, by Application 2020 & 2033
- Table 28: Argentina Challenger Banks In North America Volume (Billion) Forecast, by Application 2020 & 2033
- Table 29: Rest of South America Challenger Banks In North America Revenue (Million) Forecast, by Application 2020 & 2033
- Table 30: Rest of South America Challenger Banks In North America Volume (Billion) Forecast, by Application 2020 & 2033
- Table 31: Global Challenger Banks In North America Revenue Million Forecast, by Service Type 2020 & 2033
- Table 32: Global Challenger Banks In North America Volume Billion Forecast, by Service Type 2020 & 2033
- Table 33: Global Challenger Banks In North America Revenue Million Forecast, by End-User Type 2020 & 2033
- Table 34: Global Challenger Banks In North America Volume Billion Forecast, by End-User Type 2020 & 2033
- Table 35: Global Challenger Banks In North America Revenue Million Forecast, by Country 2020 & 2033
- Table 36: Global Challenger Banks In North America Volume Billion Forecast, by Country 2020 & 2033
- Table 37: United Kingdom Challenger Banks In North America Revenue (Million) Forecast, by Application 2020 & 2033
- Table 38: United Kingdom Challenger Banks In North America Volume (Billion) Forecast, by Application 2020 & 2033
- Table 39: Germany Challenger Banks In North America Revenue (Million) Forecast, by Application 2020 & 2033
- Table 40: Germany Challenger Banks In North America Volume (Billion) Forecast, by Application 2020 & 2033
- Table 41: France Challenger Banks In North America Revenue (Million) Forecast, by Application 2020 & 2033
- Table 42: France Challenger Banks In North America Volume (Billion) Forecast, by Application 2020 & 2033
- Table 43: Italy Challenger Banks In North America Revenue (Million) Forecast, by Application 2020 & 2033
- Table 44: Italy Challenger Banks In North America Volume (Billion) Forecast, by Application 2020 & 2033
- Table 45: Spain Challenger Banks In North America Revenue (Million) Forecast, by Application 2020 & 2033
- Table 46: Spain Challenger Banks In North America Volume (Billion) Forecast, by Application 2020 & 2033
- Table 47: Russia Challenger Banks In North America Revenue (Million) Forecast, by Application 2020 & 2033
- Table 48: Russia Challenger Banks In North America Volume (Billion) Forecast, by Application 2020 & 2033
- Table 49: Benelux Challenger Banks In North America Revenue (Million) Forecast, by Application 2020 & 2033
- Table 50: Benelux Challenger Banks In North America Volume (Billion) Forecast, by Application 2020 & 2033
- Table 51: Nordics Challenger Banks In North America Revenue (Million) Forecast, by Application 2020 & 2033
- Table 52: Nordics Challenger Banks In North America Volume (Billion) Forecast, by Application 2020 & 2033
- Table 53: Rest of Europe Challenger Banks In North America Revenue (Million) Forecast, by Application 2020 & 2033
- Table 54: Rest of Europe Challenger Banks In North America Volume (Billion) Forecast, by Application 2020 & 2033
- Table 55: Global Challenger Banks In North America Revenue Million Forecast, by Service Type 2020 & 2033
- Table 56: Global Challenger Banks In North America Volume Billion Forecast, by Service Type 2020 & 2033
- Table 57: Global Challenger Banks In North America Revenue Million Forecast, by End-User Type 2020 & 2033
- Table 58: Global Challenger Banks In North America Volume Billion Forecast, by End-User Type 2020 & 2033
- Table 59: Global Challenger Banks In North America Revenue Million Forecast, by Country 2020 & 2033
- Table 60: Global Challenger Banks In North America Volume Billion Forecast, by Country 2020 & 2033
- Table 61: Turkey Challenger Banks In North America Revenue (Million) Forecast, by Application 2020 & 2033
- Table 62: Turkey Challenger Banks In North America Volume (Billion) Forecast, by Application 2020 & 2033
- Table 63: Israel Challenger Banks In North America Revenue (Million) Forecast, by Application 2020 & 2033
- Table 64: Israel Challenger Banks In North America Volume (Billion) Forecast, by Application 2020 & 2033
- Table 65: GCC Challenger Banks In North America Revenue (Million) Forecast, by Application 2020 & 2033
- Table 66: GCC Challenger Banks In North America Volume (Billion) Forecast, by Application 2020 & 2033
- Table 67: North Africa Challenger Banks In North America Revenue (Million) Forecast, by Application 2020 & 2033
- Table 68: North Africa Challenger Banks In North America Volume (Billion) Forecast, by Application 2020 & 2033
- Table 69: South Africa Challenger Banks In North America Revenue (Million) Forecast, by Application 2020 & 2033
- Table 70: South Africa Challenger Banks In North America Volume (Billion) Forecast, by Application 2020 & 2033
- Table 71: Rest of Middle East & Africa Challenger Banks In North America Revenue (Million) Forecast, by Application 2020 & 2033
- Table 72: Rest of Middle East & Africa Challenger Banks In North America Volume (Billion) Forecast, by Application 2020 & 2033
- Table 73: Global Challenger Banks In North America Revenue Million Forecast, by Service Type 2020 & 2033
- Table 74: Global Challenger Banks In North America Volume Billion Forecast, by Service Type 2020 & 2033
- Table 75: Global Challenger Banks In North America Revenue Million Forecast, by End-User Type 2020 & 2033
- Table 76: Global Challenger Banks In North America Volume Billion Forecast, by End-User Type 2020 & 2033
- Table 77: Global Challenger Banks In North America Revenue Million Forecast, by Country 2020 & 2033
- Table 78: Global Challenger Banks In North America Volume Billion Forecast, by Country 2020 & 2033
- Table 79: China Challenger Banks In North America Revenue (Million) Forecast, by Application 2020 & 2033
- Table 80: China Challenger Banks In North America Volume (Billion) Forecast, by Application 2020 & 2033
- Table 81: India Challenger Banks In North America Revenue (Million) Forecast, by Application 2020 & 2033
- Table 82: India Challenger Banks In North America Volume (Billion) Forecast, by Application 2020 & 2033
- Table 83: Japan Challenger Banks In North America Revenue (Million) Forecast, by Application 2020 & 2033
- Table 84: Japan Challenger Banks In North America Volume (Billion) Forecast, by Application 2020 & 2033
- Table 85: South Korea Challenger Banks In North America Revenue (Million) Forecast, by Application 2020 & 2033
- Table 86: South Korea Challenger Banks In North America Volume (Billion) Forecast, by Application 2020 & 2033
- Table 87: ASEAN Challenger Banks In North America Revenue (Million) Forecast, by Application 2020 & 2033
- Table 88: ASEAN Challenger Banks In North America Volume (Billion) Forecast, by Application 2020 & 2033
- Table 89: Oceania Challenger Banks In North America Revenue (Million) Forecast, by Application 2020 & 2033
- Table 90: Oceania Challenger Banks In North America Volume (Billion) Forecast, by Application 2020 & 2033
- Table 91: Rest of Asia Pacific Challenger Banks In North America Revenue (Million) Forecast, by Application 2020 & 2033
- Table 92: Rest of Asia Pacific Challenger Banks In North America Volume (Billion) Forecast, by Application 2020 & 2033
Frequently Asked Questions
1. What is the projected Compound Annual Growth Rate (CAGR) of the Challenger Banks In North America?
The projected CAGR is approximately 9.12%.
2. Which companies are prominent players in the Challenger Banks In North America?
Key companies in the market include Chime, Varo, Aspiration, MoneyLion, Qapital, BankMobile, Upgrade, Dave, Zero, Stash, Deserve, Current**List Not Exhaustive.
3. What are the main segments of the Challenger Banks In North America?
The market segments include Service Type, End-User Type.
4. Can you provide details about the market size?
The market size is estimated to be USD 10 Million as of 2022.
5. What are some drivers contributing to market growth?
N/A
6. What are the notable trends driving market growth?
Convenience Offered to Consumers Drives The Market.
7. Are there any restraints impacting market growth?
N/A
8. Can you provide examples of recent developments in the market?
March 2023: US challenger Varo Bank is reportedly raising USD 50 million at a USD 1.8 billion valuation, a 28% decline in value since its last fundraising. The firm was valued at USD 2.5 billion in September 2021 after raising USD 510 million in a Series E funding round led by Lone Pine Capital.
9. What pricing options are available for accessing the report?
Pricing options include single-user, multi-user, and enterprise licenses priced at USD 4750, USD 4950, and USD 6800 respectively.
10. Is the market size provided in terms of value or volume?
The market size is provided in terms of value, measured in Million and volume, measured in Billion.
11. Are there any specific market keywords associated with the report?
Yes, the market keyword associated with the report is "Challenger Banks In North America," which aids in identifying and referencing the specific market segment covered.
12. How do I determine which pricing option suits my needs best?
The pricing options vary based on user requirements and access needs. Individual users may opt for single-user licenses, while businesses requiring broader access may choose multi-user or enterprise licenses for cost-effective access to the report.
13. Are there any additional resources or data provided in the Challenger Banks In North America report?
While the report offers comprehensive insights, it's advisable to review the specific contents or supplementary materials provided to ascertain if additional resources or data are available.
14. How can I stay updated on further developments or reports in the Challenger Banks In North America?
To stay informed about further developments, trends, and reports in the Challenger Banks In North America, consider subscribing to industry newsletters, following relevant companies and organizations, or regularly checking reputable industry news sources and publications.
Methodology
Step 1 - Identification of Relevant Samples Size from Population Database


Step 2 - Approaches for Defining Global Market Size (Value, Volume* & Price*)

Note*: In applicable scenarios
Step 3 - Data Sources
Primary Research
- Web Analytics
- Survey Reports
- Research Institute
- Latest Research Reports
- Opinion Leaders
Secondary Research
- Annual Reports
- White Paper
- Latest Press Release
- Industry Association
- Paid Database
- Investor Presentations

Step 4 - Data Triangulation
Involves using different sources of information in order to increase the validity of a study
These sources are likely to be stakeholders in a program - participants, other researchers, program staff, other community members, and so on.
Then we put all data in single framework & apply various statistical tools to find out the dynamic on the market.
During the analysis stage, feedback from the stakeholder groups would be compared to determine areas of agreement as well as areas of divergence