
Key Insights
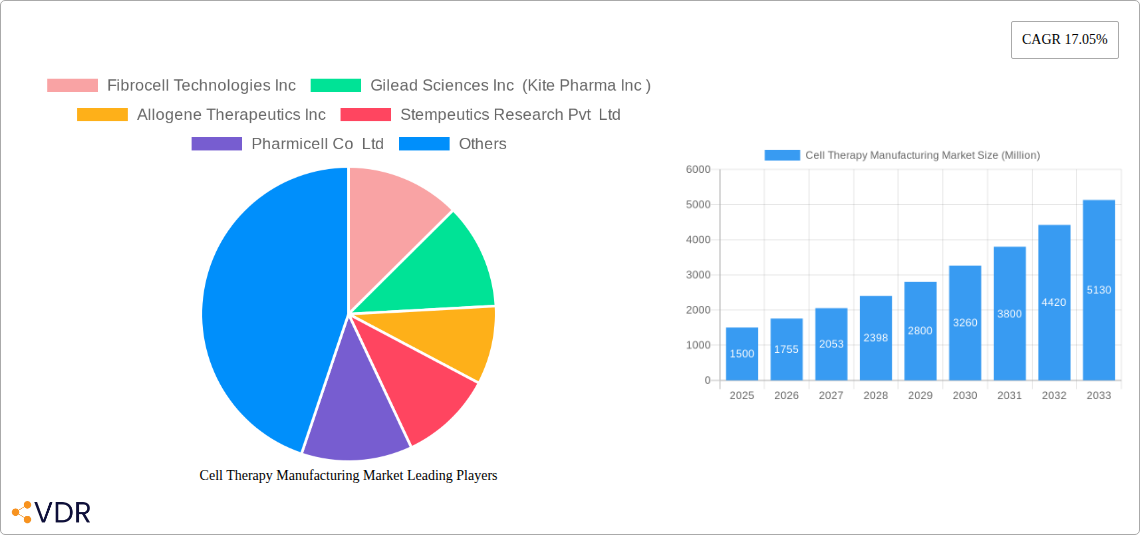
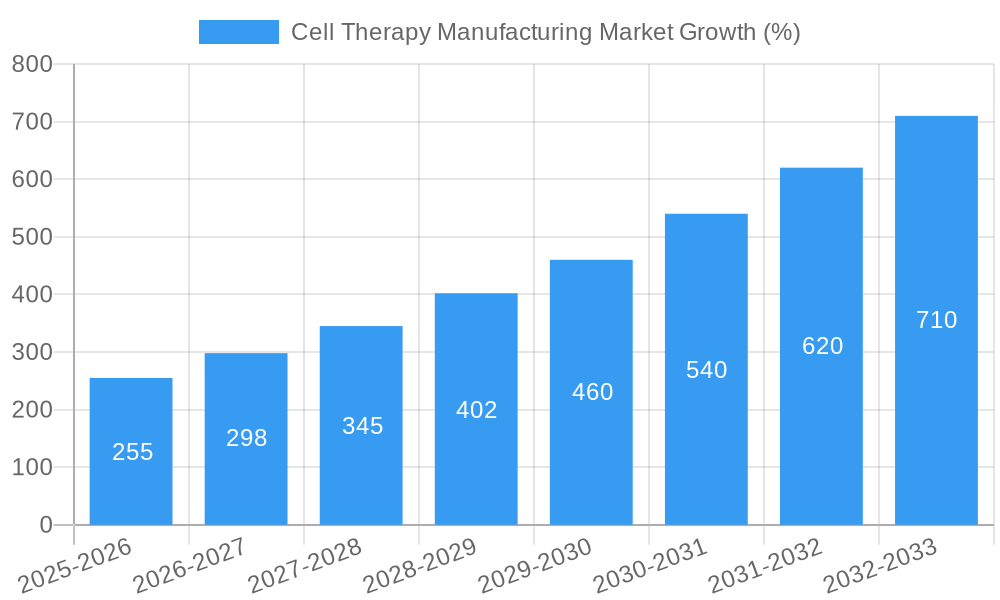
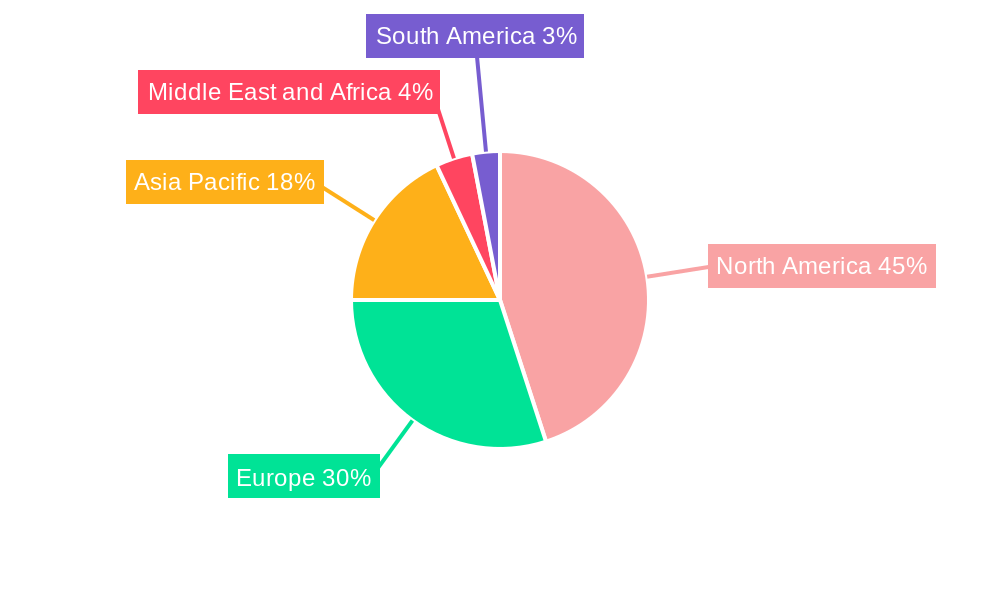
The Cell Therapy Manufacturing market is experiencing robust growth, projected to reach a substantial size by 2033, fueled by a 17.05% CAGR. This expansion is driven by several key factors. Firstly, the increasing prevalence of chronic and life-threatening diseases like musculoskeletal disorders, malignancies, and cardiovascular diseases is creating a high demand for effective therapeutic options. Cell therapy, with its potential for personalized medicine and targeted treatment, is emerging as a promising solution. Secondly, advancements in cell processing technologies, including automation and improved quality control, are enhancing manufacturing efficiency and reducing costs. This makes cell therapies more accessible and commercially viable. Finally, significant investments in research and development by both pharmaceutical companies and government agencies are accelerating the pipeline of new cell therapies, further stimulating market growth. The market is segmented by cell type (autologous and allogeneic), therapy type (mesenchymal stem cell therapy, fibroblast cell therapy, hematopoietic stem cell therapy, and others), and application area (musculoskeletal, malignancies, cardiovascular, dermatology and wounds, and others). The North American region currently holds a significant market share, driven by robust healthcare infrastructure and high adoption rates of innovative therapies. However, other regions, especially Asia Pacific, are witnessing rapid growth due to increasing investments in healthcare and rising awareness of cell therapy benefits.
The competitive landscape is characterized by a mix of established pharmaceutical giants and innovative biotech companies. Companies like Gilead Sciences, Novartis, and Takeda Pharmaceuticals are leveraging their expertise and resources to expand their presence in this rapidly evolving market. Smaller biotech firms are also playing a crucial role by focusing on niche applications and developing novel cell therapies. The future of the Cell Therapy Manufacturing market looks promising, with continued growth anticipated as new therapies gain regulatory approval and patient access expands. The market's trajectory will be shaped by further technological advancements, regulatory approvals, and evolving healthcare policies across different geographic regions. The successful commercialization of advanced cell therapies will be pivotal in unlocking the full potential of this transformative field.
Cell Therapy Manufacturing Market: A Comprehensive Market Report (2019-2033)
This comprehensive report provides a detailed analysis of the Cell Therapy Manufacturing Market, encompassing market dynamics, growth trends, regional dominance, product landscape, challenges, opportunities, and key players. With a study period spanning 2019-2033, a base year of 2025, and a forecast period of 2025-2033, this report is an invaluable resource for industry professionals, investors, and researchers seeking to understand and capitalize on the burgeoning cell therapy manufacturing landscape. The report segments the market by type (autologous and allogeneic), therapy (mesenchymal stem cell therapy, fibroblast cell therapy, hematopoietic stem cell therapy, and other therapies), and application (musculoskeletal, malignancies, cardiovascular, dermatology and wounds, and other applications). The total market size is projected to reach xx Million by 2033.
Cell Therapy Manufacturing Market Dynamics & Structure
The cell therapy manufacturing market is characterized by a moderately concentrated landscape, with key players like Novartis AG, Gilead Sciences Inc (Kite Pharma Inc), and Fibrocell Technologies Inc holding significant market share. The market's dynamics are shaped by rapid technological innovation, stringent regulatory frameworks, and the emergence of competitive substitute therapies. The market is witnessing a surge in M&A activity, with approximately xx deals recorded between 2019 and 2024, reflecting industry consolidation and expansion efforts.
- Market Concentration: High, with top 5 players holding approximately xx% of the market share in 2024.
- Technological Innovation: Focus on automation, process optimization, and closed-system manufacturing to enhance efficiency and reduce costs.
- Regulatory Framework: Stringent regulatory requirements drive higher manufacturing costs and extended timelines for product approval.
- Competitive Substitutes: Traditional pharmaceuticals and other advanced therapies pose competitive challenges.
- End-User Demographics: Growing geriatric population and increasing prevalence of chronic diseases fuel market demand.
- M&A Trends: Consolidation is driving increased market concentration and accelerated innovation.
Cell Therapy Manufacturing Market Growth Trends & Insights
The cell therapy manufacturing market is experiencing significant growth, driven by rising demand for cell-based therapies across various applications. The market size is projected to witness a Compound Annual Growth Rate (CAGR) of xx% during the forecast period (2025-2033). This growth is attributed to several factors, including technological advancements leading to improved efficacy and safety of cell therapies, increasing investments in research and development, and supportive regulatory frameworks. Market penetration is expected to increase significantly, driven by rising awareness and acceptance of these therapies among patients and healthcare professionals. Technological disruptions, such as the development of novel cell processing technologies and advanced manufacturing platforms, are further accelerating market expansion. Shifting consumer behavior towards personalized medicine and precision therapies is also fueling market growth.
Dominant Regions, Countries, or Segments in Cell Therapy Manufacturing Market
North America currently dominates the cell therapy manufacturing market, owing to advanced healthcare infrastructure, high adoption rates of innovative therapies, and strong regulatory support. Within this region, the U.S. holds the largest market share. The European market is also experiencing robust growth, driven by increasing investments in research and development and growing demand for cell-based therapies. The Asia-Pacific region is anticipated to demonstrate significant growth potential, fueled by rising healthcare expenditure and growing awareness of cell therapy benefits.
- Leading Segment (by type): Allogeneic cell therapies are projected to witness faster growth due to their scalability and reduced cost compared to autologous therapies.
- Leading Segment (by therapy): Mesenchymal stem cell therapy holds a significant market share due to its wide range of applications and proven efficacy.
- Leading Segment (by application): Musculoskeletal applications currently drive market growth, followed by the oncology segment.
- Key Drivers: Favorable regulatory landscape, increasing R&D investments, and rising healthcare expenditure in developed countries.
Cell Therapy Manufacturing Market Product Landscape
The cell therapy manufacturing market features a diverse range of products, including specialized cell processing equipment, bioreactors, cryopreservation systems, and quality control testing kits. Continuous innovation focuses on improving the efficiency, scalability, and automation of cell manufacturing processes. Key product differentiators include enhanced cell yield, improved product consistency, reduced manufacturing costs, and simplified workflows. Technological advancements such as closed-system manufacturing and automated cell handling are key drivers of innovation.
Key Drivers, Barriers & Challenges in Cell Therapy Manufacturing Market
Key Drivers:
- Increasing prevalence of chronic diseases requiring cell-based therapies.
- Technological advancements leading to improved efficacy and safety of cell therapies.
- Rising investments in R&D and supportive government initiatives.
Challenges & Restraints:
- High manufacturing costs and complexities associated with cell therapy production.
- Stringent regulatory requirements and lengthy approval processes.
- Limited scalability and accessibility of cell therapies.
- Potential for immunogenicity and other safety concerns.
Emerging Opportunities in Cell Therapy Manufacturing Market
- Expansion into emerging markets with significant unmet medical needs.
- Development of novel cell therapies for previously untreatable diseases.
- Application of AI and machine learning in cell manufacturing and process optimization.
- Growing adoption of personalized cell therapies based on individual patient characteristics.
Growth Accelerators in the Cell Therapy Manufacturing Market Industry
Technological breakthroughs in cell processing, automation, and bioreactor design are significantly accelerating market growth. Strategic partnerships and collaborations between pharmaceutical companies, research institutions, and biotechnology firms are driving innovation. Expansion into new therapeutic areas and geographical markets is unlocking further growth opportunities.
Key Players Shaping the Cell Therapy Manufacturing Market Market
- Fibrocell Technologies Inc
- Gilead Sciences Inc (Kite Pharma Inc)
- Allogene Therapeutics Inc
- Stempeutics Research Pvt Ltd
- Pharmicell Co Ltd
- Novartis AG
- Anterogen Co Ltd
- Chiesi Farmaceutici SpA
- Nipro Corporation
- TiGenix (Takeda Pharmaceuticals)
- Organogenesis Inc
- Vericel Corporation
- Tego Science
- MEDIPOST Co Ltd
- Corestem Inc
Notable Milestones in Cell Therapy Manufacturing Market Sector
- January 2022: Immunocore received FDA approval for KIMMTRAK (tebentafusp-tebn) for uveal melanoma.
- March 2021: Novadip Biosciences received IND approval for NVD-003 for rare pediatric bone disease.
In-Depth Cell Therapy Manufacturing Market Market Outlook
The cell therapy manufacturing market is poised for substantial growth, driven by ongoing technological advancements, supportive regulatory environments, and increasing investments. Strategic collaborations and expansions into new therapeutic areas will further accelerate market expansion, creating significant opportunities for industry players. The market is expected to witness a continuous shift toward advanced manufacturing technologies, personalized therapies, and improved accessibility, ultimately enhancing patient outcomes and driving global market penetration.
Cell Therapy Manufacturing Market Segmentation
-
1. Type
- 1.1. Autologous
- 1.2. Allogeneic
-
2. Therapy
- 2.1. Mesenchymal Stem Cell Therapy
- 2.2. Fibroblast Cell Therapy
- 2.3. Hematopoietic Stem Cell Therapy
- 2.4. Other Therapies
-
3. Application
- 3.1. Musculoskeletal
- 3.2. Malignancies
- 3.3. Cardiovascular
- 3.4. Dermatology and Wounds
- 3.5. Other Applications
Cell Therapy Manufacturing Market Segmentation By Geography
-
1. North America
- 1.1. United States
- 1.2. Canada
- 1.3. Mexico
-
2. Europe
- 2.1. Germany
- 2.2. United Kingdom
- 2.3. France
- 2.4. Italy
- 2.5. Spain
- 2.6. Rest of Europe
-
3. Asia Pacific
- 3.1. China
- 3.2. Japan
- 3.3. India
- 3.4. Australia
- 3.5. South Korea
- 3.6. Rest of Asia Pacific
-
4. Middle East and Africa
- 4.1. GCC
- 4.2. South Africa
- 4.3. Rest of Middle East and Africa
-
5. South America
- 5.1. Brazil
- 5.2. Argentina
- 5.3. Rest of South America
Cell Therapy Manufacturing Market REPORT HIGHLIGHTS
| Aspects | Details |
|---|---|
| Study Period | 2019-2033 |
| Base Year | 2024 |
| Estimated Year | 2025 |
| Forecast Period | 2025-2033 |
| Historical Period | 2019-2024 |
| Growth Rate | CAGR of 17.05% from 2019-2033 |
| Segmentation |
|
Table of Contents
- 1. Introduction
- 1.1. Research Scope
- 1.2. Market Segmentation
- 1.3. Research Methodology
- 1.4. Definitions and Assumptions
- 2. Executive Summary
- 2.1. Introduction
- 3. Market Dynamics
- 3.1. Introduction
- 3.2. Market Drivers
- 3.2.1. Increasing Prevalence of Chronic Conditions; Rising Adoption of Regenerative Medicine; Rise in Number of Clinical Studies Pertaining to the Development of Cellular Therapies
- 3.3. Market Restrains
- 3.3.1. High Cost of Therapies
- 3.4. Market Trends
- 3.4.1. The Allogeneic Therapies Segment is Expected to Account for a Significant Share in the Cell Therapy Market
- 4. Market Factor Analysis
- 4.1. Porters Five Forces
- 4.2. Supply/Value Chain
- 4.3. PESTEL analysis
- 4.4. Market Entropy
- 4.5. Patent/Trademark Analysis
- 5. Global Cell Therapy Manufacturing Market Analysis, Insights and Forecast, 2019-2031
- 5.1. Market Analysis, Insights and Forecast - by Type
- 5.1.1. Autologous
- 5.1.2. Allogeneic
- 5.2. Market Analysis, Insights and Forecast - by Therapy
- 5.2.1. Mesenchymal Stem Cell Therapy
- 5.2.2. Fibroblast Cell Therapy
- 5.2.3. Hematopoietic Stem Cell Therapy
- 5.2.4. Other Therapies
- 5.3. Market Analysis, Insights and Forecast - by Application
- 5.3.1. Musculoskeletal
- 5.3.2. Malignancies
- 5.3.3. Cardiovascular
- 5.3.4. Dermatology and Wounds
- 5.3.5. Other Applications
- 5.4. Market Analysis, Insights and Forecast - by Region
- 5.4.1. North America
- 5.4.2. Europe
- 5.4.3. Asia Pacific
- 5.4.4. Middle East and Africa
- 5.4.5. South America
- 5.1. Market Analysis, Insights and Forecast - by Type
- 6. North America Cell Therapy Manufacturing Market Analysis, Insights and Forecast, 2019-2031
- 6.1. Market Analysis, Insights and Forecast - by Type
- 6.1.1. Autologous
- 6.1.2. Allogeneic
- 6.2. Market Analysis, Insights and Forecast - by Therapy
- 6.2.1. Mesenchymal Stem Cell Therapy
- 6.2.2. Fibroblast Cell Therapy
- 6.2.3. Hematopoietic Stem Cell Therapy
- 6.2.4. Other Therapies
- 6.3. Market Analysis, Insights and Forecast - by Application
- 6.3.1. Musculoskeletal
- 6.3.2. Malignancies
- 6.3.3. Cardiovascular
- 6.3.4. Dermatology and Wounds
- 6.3.5. Other Applications
- 6.1. Market Analysis, Insights and Forecast - by Type
- 7. Europe Cell Therapy Manufacturing Market Analysis, Insights and Forecast, 2019-2031
- 7.1. Market Analysis, Insights and Forecast - by Type
- 7.1.1. Autologous
- 7.1.2. Allogeneic
- 7.2. Market Analysis, Insights and Forecast - by Therapy
- 7.2.1. Mesenchymal Stem Cell Therapy
- 7.2.2. Fibroblast Cell Therapy
- 7.2.3. Hematopoietic Stem Cell Therapy
- 7.2.4. Other Therapies
- 7.3. Market Analysis, Insights and Forecast - by Application
- 7.3.1. Musculoskeletal
- 7.3.2. Malignancies
- 7.3.3. Cardiovascular
- 7.3.4. Dermatology and Wounds
- 7.3.5. Other Applications
- 7.1. Market Analysis, Insights and Forecast - by Type
- 8. Asia Pacific Cell Therapy Manufacturing Market Analysis, Insights and Forecast, 2019-2031
- 8.1. Market Analysis, Insights and Forecast - by Type
- 8.1.1. Autologous
- 8.1.2. Allogeneic
- 8.2. Market Analysis, Insights and Forecast - by Therapy
- 8.2.1. Mesenchymal Stem Cell Therapy
- 8.2.2. Fibroblast Cell Therapy
- 8.2.3. Hematopoietic Stem Cell Therapy
- 8.2.4. Other Therapies
- 8.3. Market Analysis, Insights and Forecast - by Application
- 8.3.1. Musculoskeletal
- 8.3.2. Malignancies
- 8.3.3. Cardiovascular
- 8.3.4. Dermatology and Wounds
- 8.3.5. Other Applications
- 8.1. Market Analysis, Insights and Forecast - by Type
- 9. Middle East and Africa Cell Therapy Manufacturing Market Analysis, Insights and Forecast, 2019-2031
- 9.1. Market Analysis, Insights and Forecast - by Type
- 9.1.1. Autologous
- 9.1.2. Allogeneic
- 9.2. Market Analysis, Insights and Forecast - by Therapy
- 9.2.1. Mesenchymal Stem Cell Therapy
- 9.2.2. Fibroblast Cell Therapy
- 9.2.3. Hematopoietic Stem Cell Therapy
- 9.2.4. Other Therapies
- 9.3. Market Analysis, Insights and Forecast - by Application
- 9.3.1. Musculoskeletal
- 9.3.2. Malignancies
- 9.3.3. Cardiovascular
- 9.3.4. Dermatology and Wounds
- 9.3.5. Other Applications
- 9.1. Market Analysis, Insights and Forecast - by Type
- 10. South America Cell Therapy Manufacturing Market Analysis, Insights and Forecast, 2019-2031
- 10.1. Market Analysis, Insights and Forecast - by Type
- 10.1.1. Autologous
- 10.1.2. Allogeneic
- 10.2. Market Analysis, Insights and Forecast - by Therapy
- 10.2.1. Mesenchymal Stem Cell Therapy
- 10.2.2. Fibroblast Cell Therapy
- 10.2.3. Hematopoietic Stem Cell Therapy
- 10.2.4. Other Therapies
- 10.3. Market Analysis, Insights and Forecast - by Application
- 10.3.1. Musculoskeletal
- 10.3.2. Malignancies
- 10.3.3. Cardiovascular
- 10.3.4. Dermatology and Wounds
- 10.3.5. Other Applications
- 10.1. Market Analysis, Insights and Forecast - by Type
- 11. North America Cell Therapy Manufacturing Market Analysis, Insights and Forecast, 2019-2031
- 11.1. Market Analysis, Insights and Forecast - By Country/Sub-region
- 11.1.1 United States
- 11.1.2 Canada
- 11.1.3 Mexico
- 12. Europe Cell Therapy Manufacturing Market Analysis, Insights and Forecast, 2019-2031
- 12.1. Market Analysis, Insights and Forecast - By Country/Sub-region
- 12.1.1 Germany
- 12.1.2 United Kingdom
- 12.1.3 France
- 12.1.4 Italy
- 12.1.5 Spain
- 12.1.6 Rest of Europe
- 13. Asia Pacific Cell Therapy Manufacturing Market Analysis, Insights and Forecast, 2019-2031
- 13.1. Market Analysis, Insights and Forecast - By Country/Sub-region
- 13.1.1 China
- 13.1.2 Japan
- 13.1.3 India
- 13.1.4 Australia
- 13.1.5 South Korea
- 13.1.6 Rest of Asia Pacific
- 14. Middle East and Africa Cell Therapy Manufacturing Market Analysis, Insights and Forecast, 2019-2031
- 14.1. Market Analysis, Insights and Forecast - By Country/Sub-region
- 14.1.1 GCC
- 14.1.2 South Africa
- 14.1.3 Rest of Middle East and Africa
- 15. South America Cell Therapy Manufacturing Market Analysis, Insights and Forecast, 2019-2031
- 15.1. Market Analysis, Insights and Forecast - By Country/Sub-region
- 15.1.1 Brazil
- 15.1.2 Argentina
- 15.1.3 Rest of South America
- 16. Competitive Analysis
- 16.1. Global Market Share Analysis 2024
- 16.2. Company Profiles
- 16.2.1 Fibrocell Technologies Inc
- 16.2.1.1. Overview
- 16.2.1.2. Products
- 16.2.1.3. SWOT Analysis
- 16.2.1.4. Recent Developments
- 16.2.1.5. Financials (Based on Availability)
- 16.2.2 Gilead Sciences Inc (Kite Pharma Inc )
- 16.2.2.1. Overview
- 16.2.2.2. Products
- 16.2.2.3. SWOT Analysis
- 16.2.2.4. Recent Developments
- 16.2.2.5. Financials (Based on Availability)
- 16.2.3 Allogene Therapeutics Inc
- 16.2.3.1. Overview
- 16.2.3.2. Products
- 16.2.3.3. SWOT Analysis
- 16.2.3.4. Recent Developments
- 16.2.3.5. Financials (Based on Availability)
- 16.2.4 Stempeutics Research Pvt Ltd
- 16.2.4.1. Overview
- 16.2.4.2. Products
- 16.2.4.3. SWOT Analysis
- 16.2.4.4. Recent Developments
- 16.2.4.5. Financials (Based on Availability)
- 16.2.5 Pharmicell Co Ltd
- 16.2.5.1. Overview
- 16.2.5.2. Products
- 16.2.5.3. SWOT Analysis
- 16.2.5.4. Recent Developments
- 16.2.5.5. Financials (Based on Availability)
- 16.2.6 Novartis AG
- 16.2.6.1. Overview
- 16.2.6.2. Products
- 16.2.6.3. SWOT Analysis
- 16.2.6.4. Recent Developments
- 16.2.6.5. Financials (Based on Availability)
- 16.2.7 Anterogen Co Ltd
- 16.2.7.1. Overview
- 16.2.7.2. Products
- 16.2.7.3. SWOT Analysis
- 16.2.7.4. Recent Developments
- 16.2.7.5. Financials (Based on Availability)
- 16.2.8 Chiesi Farmaceutici SpA
- 16.2.8.1. Overview
- 16.2.8.2. Products
- 16.2.8.3. SWOT Analysis
- 16.2.8.4. Recent Developments
- 16.2.8.5. Financials (Based on Availability)
- 16.2.9 Nipro Corporation
- 16.2.9.1. Overview
- 16.2.9.2. Products
- 16.2.9.3. SWOT Analysis
- 16.2.9.4. Recent Developments
- 16.2.9.5. Financials (Based on Availability)
- 16.2.10 TiGenix (Takeda Pharmaceuticals)
- 16.2.10.1. Overview
- 16.2.10.2. Products
- 16.2.10.3. SWOT Analysis
- 16.2.10.4. Recent Developments
- 16.2.10.5. Financials (Based on Availability)
- 16.2.11 Organogenesis Inc
- 16.2.11.1. Overview
- 16.2.11.2. Products
- 16.2.11.3. SWOT Analysis
- 16.2.11.4. Recent Developments
- 16.2.11.5. Financials (Based on Availability)
- 16.2.12 Vericel Corporation
- 16.2.12.1. Overview
- 16.2.12.2. Products
- 16.2.12.3. SWOT Analysis
- 16.2.12.4. Recent Developments
- 16.2.12.5. Financials (Based on Availability)
- 16.2.13 Tego Science
- 16.2.13.1. Overview
- 16.2.13.2. Products
- 16.2.13.3. SWOT Analysis
- 16.2.13.4. Recent Developments
- 16.2.13.5. Financials (Based on Availability)
- 16.2.14 MEDIPOST Co Ltd
- 16.2.14.1. Overview
- 16.2.14.2. Products
- 16.2.14.3. SWOT Analysis
- 16.2.14.4. Recent Developments
- 16.2.14.5. Financials (Based on Availability)
- 16.2.15 Corestem Inc
- 16.2.15.1. Overview
- 16.2.15.2. Products
- 16.2.15.3. SWOT Analysis
- 16.2.15.4. Recent Developments
- 16.2.15.5. Financials (Based on Availability)
- 16.2.1 Fibrocell Technologies Inc
List of Figures
- Figure 1: Global Cell Therapy Manufacturing Market Revenue Breakdown (Million, %) by Region 2024 & 2032
- Figure 2: Global Cell Therapy Manufacturing Market Volume Breakdown (K Unit, %) by Region 2024 & 2032
- Figure 3: North America Cell Therapy Manufacturing Market Revenue (Million), by Country 2024 & 2032
- Figure 4: North America Cell Therapy Manufacturing Market Volume (K Unit), by Country 2024 & 2032
- Figure 5: North America Cell Therapy Manufacturing Market Revenue Share (%), by Country 2024 & 2032
- Figure 6: North America Cell Therapy Manufacturing Market Volume Share (%), by Country 2024 & 2032
- Figure 7: Europe Cell Therapy Manufacturing Market Revenue (Million), by Country 2024 & 2032
- Figure 8: Europe Cell Therapy Manufacturing Market Volume (K Unit), by Country 2024 & 2032
- Figure 9: Europe Cell Therapy Manufacturing Market Revenue Share (%), by Country 2024 & 2032
- Figure 10: Europe Cell Therapy Manufacturing Market Volume Share (%), by Country 2024 & 2032
- Figure 11: Asia Pacific Cell Therapy Manufacturing Market Revenue (Million), by Country 2024 & 2032
- Figure 12: Asia Pacific Cell Therapy Manufacturing Market Volume (K Unit), by Country 2024 & 2032
- Figure 13: Asia Pacific Cell Therapy Manufacturing Market Revenue Share (%), by Country 2024 & 2032
- Figure 14: Asia Pacific Cell Therapy Manufacturing Market Volume Share (%), by Country 2024 & 2032
- Figure 15: Middle East and Africa Cell Therapy Manufacturing Market Revenue (Million), by Country 2024 & 2032
- Figure 16: Middle East and Africa Cell Therapy Manufacturing Market Volume (K Unit), by Country 2024 & 2032
- Figure 17: Middle East and Africa Cell Therapy Manufacturing Market Revenue Share (%), by Country 2024 & 2032
- Figure 18: Middle East and Africa Cell Therapy Manufacturing Market Volume Share (%), by Country 2024 & 2032
- Figure 19: South America Cell Therapy Manufacturing Market Revenue (Million), by Country 2024 & 2032
- Figure 20: South America Cell Therapy Manufacturing Market Volume (K Unit), by Country 2024 & 2032
- Figure 21: South America Cell Therapy Manufacturing Market Revenue Share (%), by Country 2024 & 2032
- Figure 22: South America Cell Therapy Manufacturing Market Volume Share (%), by Country 2024 & 2032
- Figure 23: North America Cell Therapy Manufacturing Market Revenue (Million), by Type 2024 & 2032
- Figure 24: North America Cell Therapy Manufacturing Market Volume (K Unit), by Type 2024 & 2032
- Figure 25: North America Cell Therapy Manufacturing Market Revenue Share (%), by Type 2024 & 2032
- Figure 26: North America Cell Therapy Manufacturing Market Volume Share (%), by Type 2024 & 2032
- Figure 27: North America Cell Therapy Manufacturing Market Revenue (Million), by Therapy 2024 & 2032
- Figure 28: North America Cell Therapy Manufacturing Market Volume (K Unit), by Therapy 2024 & 2032
- Figure 29: North America Cell Therapy Manufacturing Market Revenue Share (%), by Therapy 2024 & 2032
- Figure 30: North America Cell Therapy Manufacturing Market Volume Share (%), by Therapy 2024 & 2032
- Figure 31: North America Cell Therapy Manufacturing Market Revenue (Million), by Application 2024 & 2032
- Figure 32: North America Cell Therapy Manufacturing Market Volume (K Unit), by Application 2024 & 2032
- Figure 33: North America Cell Therapy Manufacturing Market Revenue Share (%), by Application 2024 & 2032
- Figure 34: North America Cell Therapy Manufacturing Market Volume Share (%), by Application 2024 & 2032
- Figure 35: North America Cell Therapy Manufacturing Market Revenue (Million), by Country 2024 & 2032
- Figure 36: North America Cell Therapy Manufacturing Market Volume (K Unit), by Country 2024 & 2032
- Figure 37: North America Cell Therapy Manufacturing Market Revenue Share (%), by Country 2024 & 2032
- Figure 38: North America Cell Therapy Manufacturing Market Volume Share (%), by Country 2024 & 2032
- Figure 39: Europe Cell Therapy Manufacturing Market Revenue (Million), by Type 2024 & 2032
- Figure 40: Europe Cell Therapy Manufacturing Market Volume (K Unit), by Type 2024 & 2032
- Figure 41: Europe Cell Therapy Manufacturing Market Revenue Share (%), by Type 2024 & 2032
- Figure 42: Europe Cell Therapy Manufacturing Market Volume Share (%), by Type 2024 & 2032
- Figure 43: Europe Cell Therapy Manufacturing Market Revenue (Million), by Therapy 2024 & 2032
- Figure 44: Europe Cell Therapy Manufacturing Market Volume (K Unit), by Therapy 2024 & 2032
- Figure 45: Europe Cell Therapy Manufacturing Market Revenue Share (%), by Therapy 2024 & 2032
- Figure 46: Europe Cell Therapy Manufacturing Market Volume Share (%), by Therapy 2024 & 2032
- Figure 47: Europe Cell Therapy Manufacturing Market Revenue (Million), by Application 2024 & 2032
- Figure 48: Europe Cell Therapy Manufacturing Market Volume (K Unit), by Application 2024 & 2032
- Figure 49: Europe Cell Therapy Manufacturing Market Revenue Share (%), by Application 2024 & 2032
- Figure 50: Europe Cell Therapy Manufacturing Market Volume Share (%), by Application 2024 & 2032
- Figure 51: Europe Cell Therapy Manufacturing Market Revenue (Million), by Country 2024 & 2032
- Figure 52: Europe Cell Therapy Manufacturing Market Volume (K Unit), by Country 2024 & 2032
- Figure 53: Europe Cell Therapy Manufacturing Market Revenue Share (%), by Country 2024 & 2032
- Figure 54: Europe Cell Therapy Manufacturing Market Volume Share (%), by Country 2024 & 2032
- Figure 55: Asia Pacific Cell Therapy Manufacturing Market Revenue (Million), by Type 2024 & 2032
- Figure 56: Asia Pacific Cell Therapy Manufacturing Market Volume (K Unit), by Type 2024 & 2032
- Figure 57: Asia Pacific Cell Therapy Manufacturing Market Revenue Share (%), by Type 2024 & 2032
- Figure 58: Asia Pacific Cell Therapy Manufacturing Market Volume Share (%), by Type 2024 & 2032
- Figure 59: Asia Pacific Cell Therapy Manufacturing Market Revenue (Million), by Therapy 2024 & 2032
- Figure 60: Asia Pacific Cell Therapy Manufacturing Market Volume (K Unit), by Therapy 2024 & 2032
- Figure 61: Asia Pacific Cell Therapy Manufacturing Market Revenue Share (%), by Therapy 2024 & 2032
- Figure 62: Asia Pacific Cell Therapy Manufacturing Market Volume Share (%), by Therapy 2024 & 2032
- Figure 63: Asia Pacific Cell Therapy Manufacturing Market Revenue (Million), by Application 2024 & 2032
- Figure 64: Asia Pacific Cell Therapy Manufacturing Market Volume (K Unit), by Application 2024 & 2032
- Figure 65: Asia Pacific Cell Therapy Manufacturing Market Revenue Share (%), by Application 2024 & 2032
- Figure 66: Asia Pacific Cell Therapy Manufacturing Market Volume Share (%), by Application 2024 & 2032
- Figure 67: Asia Pacific Cell Therapy Manufacturing Market Revenue (Million), by Country 2024 & 2032
- Figure 68: Asia Pacific Cell Therapy Manufacturing Market Volume (K Unit), by Country 2024 & 2032
- Figure 69: Asia Pacific Cell Therapy Manufacturing Market Revenue Share (%), by Country 2024 & 2032
- Figure 70: Asia Pacific Cell Therapy Manufacturing Market Volume Share (%), by Country 2024 & 2032
- Figure 71: Middle East and Africa Cell Therapy Manufacturing Market Revenue (Million), by Type 2024 & 2032
- Figure 72: Middle East and Africa Cell Therapy Manufacturing Market Volume (K Unit), by Type 2024 & 2032
- Figure 73: Middle East and Africa Cell Therapy Manufacturing Market Revenue Share (%), by Type 2024 & 2032
- Figure 74: Middle East and Africa Cell Therapy Manufacturing Market Volume Share (%), by Type 2024 & 2032
- Figure 75: Middle East and Africa Cell Therapy Manufacturing Market Revenue (Million), by Therapy 2024 & 2032
- Figure 76: Middle East and Africa Cell Therapy Manufacturing Market Volume (K Unit), by Therapy 2024 & 2032
- Figure 77: Middle East and Africa Cell Therapy Manufacturing Market Revenue Share (%), by Therapy 2024 & 2032
- Figure 78: Middle East and Africa Cell Therapy Manufacturing Market Volume Share (%), by Therapy 2024 & 2032
- Figure 79: Middle East and Africa Cell Therapy Manufacturing Market Revenue (Million), by Application 2024 & 2032
- Figure 80: Middle East and Africa Cell Therapy Manufacturing Market Volume (K Unit), by Application 2024 & 2032
- Figure 81: Middle East and Africa Cell Therapy Manufacturing Market Revenue Share (%), by Application 2024 & 2032
- Figure 82: Middle East and Africa Cell Therapy Manufacturing Market Volume Share (%), by Application 2024 & 2032
- Figure 83: Middle East and Africa Cell Therapy Manufacturing Market Revenue (Million), by Country 2024 & 2032
- Figure 84: Middle East and Africa Cell Therapy Manufacturing Market Volume (K Unit), by Country 2024 & 2032
- Figure 85: Middle East and Africa Cell Therapy Manufacturing Market Revenue Share (%), by Country 2024 & 2032
- Figure 86: Middle East and Africa Cell Therapy Manufacturing Market Volume Share (%), by Country 2024 & 2032
- Figure 87: South America Cell Therapy Manufacturing Market Revenue (Million), by Type 2024 & 2032
- Figure 88: South America Cell Therapy Manufacturing Market Volume (K Unit), by Type 2024 & 2032
- Figure 89: South America Cell Therapy Manufacturing Market Revenue Share (%), by Type 2024 & 2032
- Figure 90: South America Cell Therapy Manufacturing Market Volume Share (%), by Type 2024 & 2032
- Figure 91: South America Cell Therapy Manufacturing Market Revenue (Million), by Therapy 2024 & 2032
- Figure 92: South America Cell Therapy Manufacturing Market Volume (K Unit), by Therapy 2024 & 2032
- Figure 93: South America Cell Therapy Manufacturing Market Revenue Share (%), by Therapy 2024 & 2032
- Figure 94: South America Cell Therapy Manufacturing Market Volume Share (%), by Therapy 2024 & 2032
- Figure 95: South America Cell Therapy Manufacturing Market Revenue (Million), by Application 2024 & 2032
- Figure 96: South America Cell Therapy Manufacturing Market Volume (K Unit), by Application 2024 & 2032
- Figure 97: South America Cell Therapy Manufacturing Market Revenue Share (%), by Application 2024 & 2032
- Figure 98: South America Cell Therapy Manufacturing Market Volume Share (%), by Application 2024 & 2032
- Figure 99: South America Cell Therapy Manufacturing Market Revenue (Million), by Country 2024 & 2032
- Figure 100: South America Cell Therapy Manufacturing Market Volume (K Unit), by Country 2024 & 2032
- Figure 101: South America Cell Therapy Manufacturing Market Revenue Share (%), by Country 2024 & 2032
- Figure 102: South America Cell Therapy Manufacturing Market Volume Share (%), by Country 2024 & 2032
List of Tables
- Table 1: Global Cell Therapy Manufacturing Market Revenue Million Forecast, by Region 2019 & 2032
- Table 2: Global Cell Therapy Manufacturing Market Volume K Unit Forecast, by Region 2019 & 2032
- Table 3: Global Cell Therapy Manufacturing Market Revenue Million Forecast, by Type 2019 & 2032
- Table 4: Global Cell Therapy Manufacturing Market Volume K Unit Forecast, by Type 2019 & 2032
- Table 5: Global Cell Therapy Manufacturing Market Revenue Million Forecast, by Therapy 2019 & 2032
- Table 6: Global Cell Therapy Manufacturing Market Volume K Unit Forecast, by Therapy 2019 & 2032
- Table 7: Global Cell Therapy Manufacturing Market Revenue Million Forecast, by Application 2019 & 2032
- Table 8: Global Cell Therapy Manufacturing Market Volume K Unit Forecast, by Application 2019 & 2032
- Table 9: Global Cell Therapy Manufacturing Market Revenue Million Forecast, by Region 2019 & 2032
- Table 10: Global Cell Therapy Manufacturing Market Volume K Unit Forecast, by Region 2019 & 2032
- Table 11: Global Cell Therapy Manufacturing Market Revenue Million Forecast, by Country 2019 & 2032
- Table 12: Global Cell Therapy Manufacturing Market Volume K Unit Forecast, by Country 2019 & 2032
- Table 13: United States Cell Therapy Manufacturing Market Revenue (Million) Forecast, by Application 2019 & 2032
- Table 14: United States Cell Therapy Manufacturing Market Volume (K Unit) Forecast, by Application 2019 & 2032
- Table 15: Canada Cell Therapy Manufacturing Market Revenue (Million) Forecast, by Application 2019 & 2032
- Table 16: Canada Cell Therapy Manufacturing Market Volume (K Unit) Forecast, by Application 2019 & 2032
- Table 17: Mexico Cell Therapy Manufacturing Market Revenue (Million) Forecast, by Application 2019 & 2032
- Table 18: Mexico Cell Therapy Manufacturing Market Volume (K Unit) Forecast, by Application 2019 & 2032
- Table 19: Global Cell Therapy Manufacturing Market Revenue Million Forecast, by Country 2019 & 2032
- Table 20: Global Cell Therapy Manufacturing Market Volume K Unit Forecast, by Country 2019 & 2032
- Table 21: Germany Cell Therapy Manufacturing Market Revenue (Million) Forecast, by Application 2019 & 2032
- Table 22: Germany Cell Therapy Manufacturing Market Volume (K Unit) Forecast, by Application 2019 & 2032
- Table 23: United Kingdom Cell Therapy Manufacturing Market Revenue (Million) Forecast, by Application 2019 & 2032
- Table 24: United Kingdom Cell Therapy Manufacturing Market Volume (K Unit) Forecast, by Application 2019 & 2032
- Table 25: France Cell Therapy Manufacturing Market Revenue (Million) Forecast, by Application 2019 & 2032
- Table 26: France Cell Therapy Manufacturing Market Volume (K Unit) Forecast, by Application 2019 & 2032
- Table 27: Italy Cell Therapy Manufacturing Market Revenue (Million) Forecast, by Application 2019 & 2032
- Table 28: Italy Cell Therapy Manufacturing Market Volume (K Unit) Forecast, by Application 2019 & 2032
- Table 29: Spain Cell Therapy Manufacturing Market Revenue (Million) Forecast, by Application 2019 & 2032
- Table 30: Spain Cell Therapy Manufacturing Market Volume (K Unit) Forecast, by Application 2019 & 2032
- Table 31: Rest of Europe Cell Therapy Manufacturing Market Revenue (Million) Forecast, by Application 2019 & 2032
- Table 32: Rest of Europe Cell Therapy Manufacturing Market Volume (K Unit) Forecast, by Application 2019 & 2032
- Table 33: Global Cell Therapy Manufacturing Market Revenue Million Forecast, by Country 2019 & 2032
- Table 34: Global Cell Therapy Manufacturing Market Volume K Unit Forecast, by Country 2019 & 2032
- Table 35: China Cell Therapy Manufacturing Market Revenue (Million) Forecast, by Application 2019 & 2032
- Table 36: China Cell Therapy Manufacturing Market Volume (K Unit) Forecast, by Application 2019 & 2032
- Table 37: Japan Cell Therapy Manufacturing Market Revenue (Million) Forecast, by Application 2019 & 2032
- Table 38: Japan Cell Therapy Manufacturing Market Volume (K Unit) Forecast, by Application 2019 & 2032
- Table 39: India Cell Therapy Manufacturing Market Revenue (Million) Forecast, by Application 2019 & 2032
- Table 40: India Cell Therapy Manufacturing Market Volume (K Unit) Forecast, by Application 2019 & 2032
- Table 41: Australia Cell Therapy Manufacturing Market Revenue (Million) Forecast, by Application 2019 & 2032
- Table 42: Australia Cell Therapy Manufacturing Market Volume (K Unit) Forecast, by Application 2019 & 2032
- Table 43: South Korea Cell Therapy Manufacturing Market Revenue (Million) Forecast, by Application 2019 & 2032
- Table 44: South Korea Cell Therapy Manufacturing Market Volume (K Unit) Forecast, by Application 2019 & 2032
- Table 45: Rest of Asia Pacific Cell Therapy Manufacturing Market Revenue (Million) Forecast, by Application 2019 & 2032
- Table 46: Rest of Asia Pacific Cell Therapy Manufacturing Market Volume (K Unit) Forecast, by Application 2019 & 2032
- Table 47: Global Cell Therapy Manufacturing Market Revenue Million Forecast, by Country 2019 & 2032
- Table 48: Global Cell Therapy Manufacturing Market Volume K Unit Forecast, by Country 2019 & 2032
- Table 49: GCC Cell Therapy Manufacturing Market Revenue (Million) Forecast, by Application 2019 & 2032
- Table 50: GCC Cell Therapy Manufacturing Market Volume (K Unit) Forecast, by Application 2019 & 2032
- Table 51: South Africa Cell Therapy Manufacturing Market Revenue (Million) Forecast, by Application 2019 & 2032
- Table 52: South Africa Cell Therapy Manufacturing Market Volume (K Unit) Forecast, by Application 2019 & 2032
- Table 53: Rest of Middle East and Africa Cell Therapy Manufacturing Market Revenue (Million) Forecast, by Application 2019 & 2032
- Table 54: Rest of Middle East and Africa Cell Therapy Manufacturing Market Volume (K Unit) Forecast, by Application 2019 & 2032
- Table 55: Global Cell Therapy Manufacturing Market Revenue Million Forecast, by Country 2019 & 2032
- Table 56: Global Cell Therapy Manufacturing Market Volume K Unit Forecast, by Country 2019 & 2032
- Table 57: Brazil Cell Therapy Manufacturing Market Revenue (Million) Forecast, by Application 2019 & 2032
- Table 58: Brazil Cell Therapy Manufacturing Market Volume (K Unit) Forecast, by Application 2019 & 2032
- Table 59: Argentina Cell Therapy Manufacturing Market Revenue (Million) Forecast, by Application 2019 & 2032
- Table 60: Argentina Cell Therapy Manufacturing Market Volume (K Unit) Forecast, by Application 2019 & 2032
- Table 61: Rest of South America Cell Therapy Manufacturing Market Revenue (Million) Forecast, by Application 2019 & 2032
- Table 62: Rest of South America Cell Therapy Manufacturing Market Volume (K Unit) Forecast, by Application 2019 & 2032
- Table 63: Global Cell Therapy Manufacturing Market Revenue Million Forecast, by Type 2019 & 2032
- Table 64: Global Cell Therapy Manufacturing Market Volume K Unit Forecast, by Type 2019 & 2032
- Table 65: Global Cell Therapy Manufacturing Market Revenue Million Forecast, by Therapy 2019 & 2032
- Table 66: Global Cell Therapy Manufacturing Market Volume K Unit Forecast, by Therapy 2019 & 2032
- Table 67: Global Cell Therapy Manufacturing Market Revenue Million Forecast, by Application 2019 & 2032
- Table 68: Global Cell Therapy Manufacturing Market Volume K Unit Forecast, by Application 2019 & 2032
- Table 69: Global Cell Therapy Manufacturing Market Revenue Million Forecast, by Country 2019 & 2032
- Table 70: Global Cell Therapy Manufacturing Market Volume K Unit Forecast, by Country 2019 & 2032
- Table 71: United States Cell Therapy Manufacturing Market Revenue (Million) Forecast, by Application 2019 & 2032
- Table 72: United States Cell Therapy Manufacturing Market Volume (K Unit) Forecast, by Application 2019 & 2032
- Table 73: Canada Cell Therapy Manufacturing Market Revenue (Million) Forecast, by Application 2019 & 2032
- Table 74: Canada Cell Therapy Manufacturing Market Volume (K Unit) Forecast, by Application 2019 & 2032
- Table 75: Mexico Cell Therapy Manufacturing Market Revenue (Million) Forecast, by Application 2019 & 2032
- Table 76: Mexico Cell Therapy Manufacturing Market Volume (K Unit) Forecast, by Application 2019 & 2032
- Table 77: Global Cell Therapy Manufacturing Market Revenue Million Forecast, by Type 2019 & 2032
- Table 78: Global Cell Therapy Manufacturing Market Volume K Unit Forecast, by Type 2019 & 2032
- Table 79: Global Cell Therapy Manufacturing Market Revenue Million Forecast, by Therapy 2019 & 2032
- Table 80: Global Cell Therapy Manufacturing Market Volume K Unit Forecast, by Therapy 2019 & 2032
- Table 81: Global Cell Therapy Manufacturing Market Revenue Million Forecast, by Application 2019 & 2032
- Table 82: Global Cell Therapy Manufacturing Market Volume K Unit Forecast, by Application 2019 & 2032
- Table 83: Global Cell Therapy Manufacturing Market Revenue Million Forecast, by Country 2019 & 2032
- Table 84: Global Cell Therapy Manufacturing Market Volume K Unit Forecast, by Country 2019 & 2032
- Table 85: Germany Cell Therapy Manufacturing Market Revenue (Million) Forecast, by Application 2019 & 2032
- Table 86: Germany Cell Therapy Manufacturing Market Volume (K Unit) Forecast, by Application 2019 & 2032
- Table 87: United Kingdom Cell Therapy Manufacturing Market Revenue (Million) Forecast, by Application 2019 & 2032
- Table 88: United Kingdom Cell Therapy Manufacturing Market Volume (K Unit) Forecast, by Application 2019 & 2032
- Table 89: France Cell Therapy Manufacturing Market Revenue (Million) Forecast, by Application 2019 & 2032
- Table 90: France Cell Therapy Manufacturing Market Volume (K Unit) Forecast, by Application 2019 & 2032
- Table 91: Italy Cell Therapy Manufacturing Market Revenue (Million) Forecast, by Application 2019 & 2032
- Table 92: Italy Cell Therapy Manufacturing Market Volume (K Unit) Forecast, by Application 2019 & 2032
- Table 93: Spain Cell Therapy Manufacturing Market Revenue (Million) Forecast, by Application 2019 & 2032
- Table 94: Spain Cell Therapy Manufacturing Market Volume (K Unit) Forecast, by Application 2019 & 2032
- Table 95: Rest of Europe Cell Therapy Manufacturing Market Revenue (Million) Forecast, by Application 2019 & 2032
- Table 96: Rest of Europe Cell Therapy Manufacturing Market Volume (K Unit) Forecast, by Application 2019 & 2032
- Table 97: Global Cell Therapy Manufacturing Market Revenue Million Forecast, by Type 2019 & 2032
- Table 98: Global Cell Therapy Manufacturing Market Volume K Unit Forecast, by Type 2019 & 2032
- Table 99: Global Cell Therapy Manufacturing Market Revenue Million Forecast, by Therapy 2019 & 2032
- Table 100: Global Cell Therapy Manufacturing Market Volume K Unit Forecast, by Therapy 2019 & 2032
- Table 101: Global Cell Therapy Manufacturing Market Revenue Million Forecast, by Application 2019 & 2032
- Table 102: Global Cell Therapy Manufacturing Market Volume K Unit Forecast, by Application 2019 & 2032
- Table 103: Global Cell Therapy Manufacturing Market Revenue Million Forecast, by Country 2019 & 2032
- Table 104: Global Cell Therapy Manufacturing Market Volume K Unit Forecast, by Country 2019 & 2032
- Table 105: China Cell Therapy Manufacturing Market Revenue (Million) Forecast, by Application 2019 & 2032
- Table 106: China Cell Therapy Manufacturing Market Volume (K Unit) Forecast, by Application 2019 & 2032
- Table 107: Japan Cell Therapy Manufacturing Market Revenue (Million) Forecast, by Application 2019 & 2032
- Table 108: Japan Cell Therapy Manufacturing Market Volume (K Unit) Forecast, by Application 2019 & 2032
- Table 109: India Cell Therapy Manufacturing Market Revenue (Million) Forecast, by Application 2019 & 2032
- Table 110: India Cell Therapy Manufacturing Market Volume (K Unit) Forecast, by Application 2019 & 2032
- Table 111: Australia Cell Therapy Manufacturing Market Revenue (Million) Forecast, by Application 2019 & 2032
- Table 112: Australia Cell Therapy Manufacturing Market Volume (K Unit) Forecast, by Application 2019 & 2032
- Table 113: South Korea Cell Therapy Manufacturing Market Revenue (Million) Forecast, by Application 2019 & 2032
- Table 114: South Korea Cell Therapy Manufacturing Market Volume (K Unit) Forecast, by Application 2019 & 2032
- Table 115: Rest of Asia Pacific Cell Therapy Manufacturing Market Revenue (Million) Forecast, by Application 2019 & 2032
- Table 116: Rest of Asia Pacific Cell Therapy Manufacturing Market Volume (K Unit) Forecast, by Application 2019 & 2032
- Table 117: Global Cell Therapy Manufacturing Market Revenue Million Forecast, by Type 2019 & 2032
- Table 118: Global Cell Therapy Manufacturing Market Volume K Unit Forecast, by Type 2019 & 2032
- Table 119: Global Cell Therapy Manufacturing Market Revenue Million Forecast, by Therapy 2019 & 2032
- Table 120: Global Cell Therapy Manufacturing Market Volume K Unit Forecast, by Therapy 2019 & 2032
- Table 121: Global Cell Therapy Manufacturing Market Revenue Million Forecast, by Application 2019 & 2032
- Table 122: Global Cell Therapy Manufacturing Market Volume K Unit Forecast, by Application 2019 & 2032
- Table 123: Global Cell Therapy Manufacturing Market Revenue Million Forecast, by Country 2019 & 2032
- Table 124: Global Cell Therapy Manufacturing Market Volume K Unit Forecast, by Country 2019 & 2032
- Table 125: GCC Cell Therapy Manufacturing Market Revenue (Million) Forecast, by Application 2019 & 2032
- Table 126: GCC Cell Therapy Manufacturing Market Volume (K Unit) Forecast, by Application 2019 & 2032
- Table 127: South Africa Cell Therapy Manufacturing Market Revenue (Million) Forecast, by Application 2019 & 2032
- Table 128: South Africa Cell Therapy Manufacturing Market Volume (K Unit) Forecast, by Application 2019 & 2032
- Table 129: Rest of Middle East and Africa Cell Therapy Manufacturing Market Revenue (Million) Forecast, by Application 2019 & 2032
- Table 130: Rest of Middle East and Africa Cell Therapy Manufacturing Market Volume (K Unit) Forecast, by Application 2019 & 2032
- Table 131: Global Cell Therapy Manufacturing Market Revenue Million Forecast, by Type 2019 & 2032
- Table 132: Global Cell Therapy Manufacturing Market Volume K Unit Forecast, by Type 2019 & 2032
- Table 133: Global Cell Therapy Manufacturing Market Revenue Million Forecast, by Therapy 2019 & 2032
- Table 134: Global Cell Therapy Manufacturing Market Volume K Unit Forecast, by Therapy 2019 & 2032
- Table 135: Global Cell Therapy Manufacturing Market Revenue Million Forecast, by Application 2019 & 2032
- Table 136: Global Cell Therapy Manufacturing Market Volume K Unit Forecast, by Application 2019 & 2032
- Table 137: Global Cell Therapy Manufacturing Market Revenue Million Forecast, by Country 2019 & 2032
- Table 138: Global Cell Therapy Manufacturing Market Volume K Unit Forecast, by Country 2019 & 2032
- Table 139: Brazil Cell Therapy Manufacturing Market Revenue (Million) Forecast, by Application 2019 & 2032
- Table 140: Brazil Cell Therapy Manufacturing Market Volume (K Unit) Forecast, by Application 2019 & 2032
- Table 141: Argentina Cell Therapy Manufacturing Market Revenue (Million) Forecast, by Application 2019 & 2032
- Table 142: Argentina Cell Therapy Manufacturing Market Volume (K Unit) Forecast, by Application 2019 & 2032
- Table 143: Rest of South America Cell Therapy Manufacturing Market Revenue (Million) Forecast, by Application 2019 & 2032
- Table 144: Rest of South America Cell Therapy Manufacturing Market Volume (K Unit) Forecast, by Application 2019 & 2032
Frequently Asked Questions
1. What is the projected Compound Annual Growth Rate (CAGR) of the Cell Therapy Manufacturing Market?
The projected CAGR is approximately 17.05%.
2. Which companies are prominent players in the Cell Therapy Manufacturing Market?
Key companies in the market include Fibrocell Technologies Inc, Gilead Sciences Inc (Kite Pharma Inc ), Allogene Therapeutics Inc, Stempeutics Research Pvt Ltd, Pharmicell Co Ltd, Novartis AG, Anterogen Co Ltd, Chiesi Farmaceutici SpA, Nipro Corporation, TiGenix (Takeda Pharmaceuticals), Organogenesis Inc , Vericel Corporation, Tego Science, MEDIPOST Co Ltd, Corestem Inc.
3. What are the main segments of the Cell Therapy Manufacturing Market?
The market segments include Type, Therapy, Application.
4. Can you provide details about the market size?
The market size is estimated to be USD XX Million as of 2022.
5. What are some drivers contributing to market growth?
Increasing Prevalence of Chronic Conditions; Rising Adoption of Regenerative Medicine; Rise in Number of Clinical Studies Pertaining to the Development of Cellular Therapies.
6. What are the notable trends driving market growth?
The Allogeneic Therapies Segment is Expected to Account for a Significant Share in the Cell Therapy Market.
7. Are there any restraints impacting market growth?
High Cost of Therapies.
8. Can you provide examples of recent developments in the market?
In January 2022, Immunocore received the Food and Drug Administration approval of KIMMTRAK (tebentafusp-tebn) for the treatment of unresectable or metastatic uveal melanoma.
9. What pricing options are available for accessing the report?
Pricing options include single-user, multi-user, and enterprise licenses priced at USD 4750, USD 5250, and USD 8750 respectively.
10. Is the market size provided in terms of value or volume?
The market size is provided in terms of value, measured in Million and volume, measured in K Unit.
11. Are there any specific market keywords associated with the report?
Yes, the market keyword associated with the report is "Cell Therapy Manufacturing Market," which aids in identifying and referencing the specific market segment covered.
12. How do I determine which pricing option suits my needs best?
The pricing options vary based on user requirements and access needs. Individual users may opt for single-user licenses, while businesses requiring broader access may choose multi-user or enterprise licenses for cost-effective access to the report.
13. Are there any additional resources or data provided in the Cell Therapy Manufacturing Market report?
While the report offers comprehensive insights, it's advisable to review the specific contents or supplementary materials provided to ascertain if additional resources or data are available.
14. How can I stay updated on further developments or reports in the Cell Therapy Manufacturing Market?
To stay informed about further developments, trends, and reports in the Cell Therapy Manufacturing Market, consider subscribing to industry newsletters, following relevant companies and organizations, or regularly checking reputable industry news sources and publications.
Methodology
Step 1 - Identification of Relevant Samples Size from Population Database


Step 2 - Approaches for Defining Global Market Size (Value, Volume* & Price*)

Note*: In applicable scenarios
Step 3 - Data Sources
Primary Research
- Web Analytics
- Survey Reports
- Research Institute
- Latest Research Reports
- Opinion Leaders
Secondary Research
- Annual Reports
- White Paper
- Latest Press Release
- Industry Association
- Paid Database
- Investor Presentations

Step 4 - Data Triangulation
Involves using different sources of information in order to increase the validity of a study
These sources are likely to be stakeholders in a program - participants, other researchers, program staff, other community members, and so on.
Then we put all data in single framework & apply various statistical tools to find out the dynamic on the market.
During the analysis stage, feedback from the stakeholder groups would be compared to determine areas of agreement as well as areas of divergence


