
Key Insights
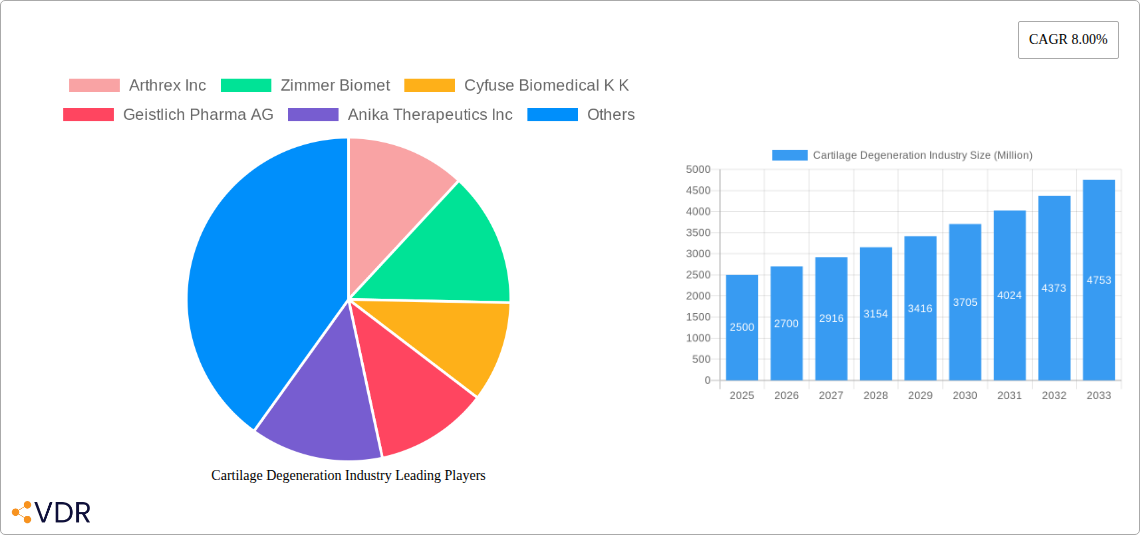
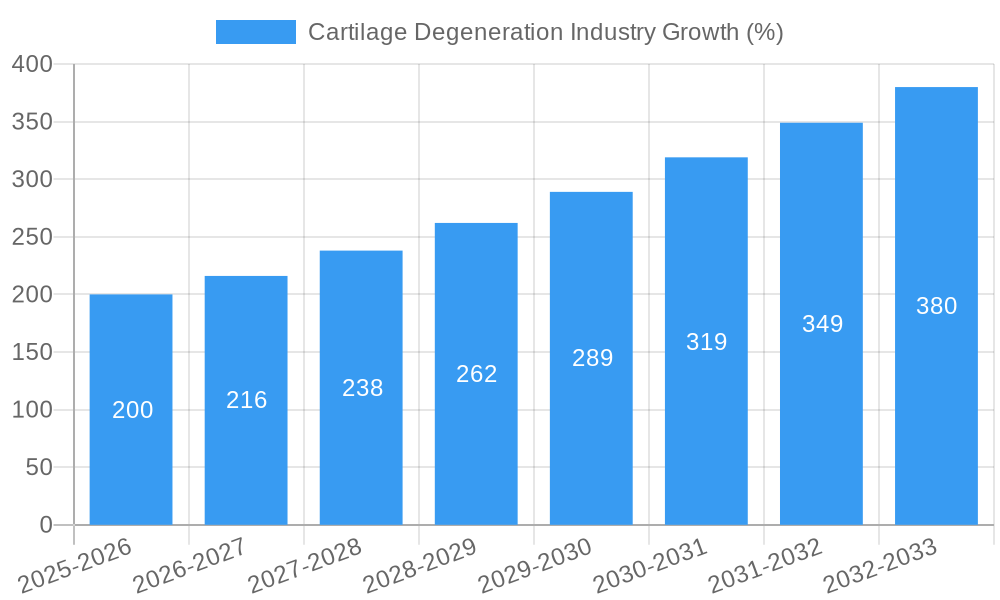
The global cartilage degeneration market, valued at approximately $2.5 billion in 2025, is projected to experience robust growth, exhibiting a compound annual growth rate (CAGR) of 8% from 2025 to 2033. This expansion is driven by several key factors. The aging global population is a significant contributor, as cartilage degeneration is strongly associated with age-related wear and tear. Increased prevalence of osteoarthritis and other degenerative joint diseases fuels demand for effective treatments. Advances in regenerative medicine, including cell-based therapies and innovative biomaterials, offer promising treatment options, further stimulating market growth. The rising adoption of minimally invasive surgical procedures and the increasing awareness among patients about available treatment options also contribute to market expansion. While the market shows significant promise, challenges remain. High treatment costs, particularly for advanced therapies, can limit accessibility. The complexity of cartilage regeneration and the inherent limitations of some treatments pose constraints. Furthermore, variations in reimbursement policies across different regions impact market penetration.
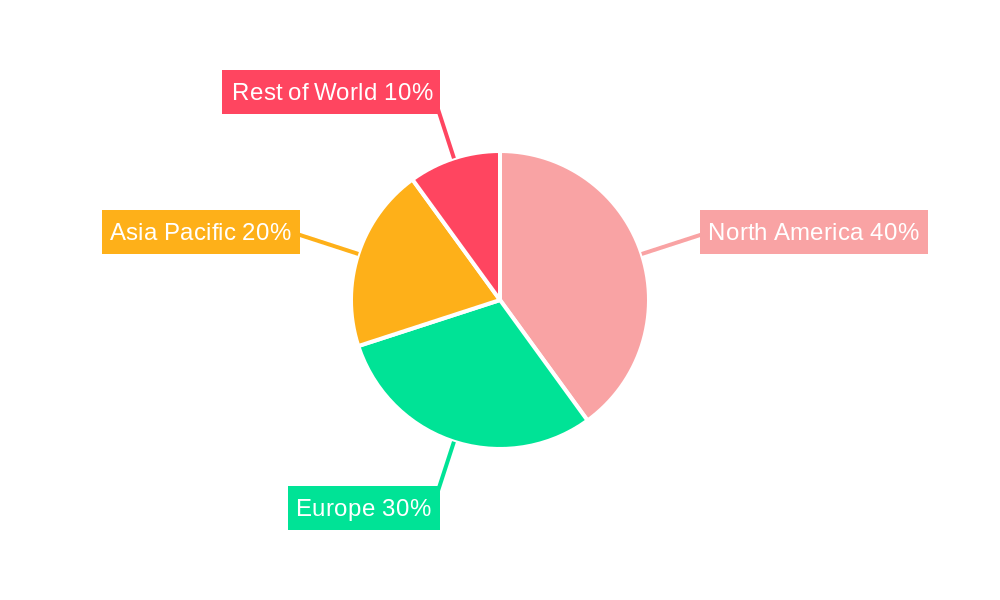
Segment-wise, the knee application site is expected to dominate, followed by the spine and hip. Non-cell-based treatments currently hold a larger market share compared to cell-based therapies, due to lower costs and wider availability. However, cell-based therapies are expected to witness significant growth owing to their potential for superior repair and regeneration. Geographically, North America and Europe are currently leading the market, driven by high healthcare expenditure and robust research infrastructure. However, Asia-Pacific is projected to show rapid growth in the coming years due to a rising prevalence of cartilage degeneration and increasing healthcare investment. The market landscape is competitive, with major players such as Arthrex Inc., Zimmer Biomet, and Johnson & Johnson continuously investing in research and development to enhance their product portfolios.
Cartilage Degeneration Industry Market Report: 2019-2033
This comprehensive report provides a detailed analysis of the Cartilage Degeneration industry, encompassing market dynamics, growth trends, regional segmentation, product landscape, key players, and future outlook. The report covers the period 2019-2033, with a focus on the estimated year 2025 and a forecast period of 2025-2033. The total market size in 2025 is estimated at $XX Billion.
Cartilage Degeneration Industry Market Dynamics & Structure
The Cartilage Degeneration market is characterized by a moderately concentrated structure, with key players such as Johnson & Johnson, Zimmer Biomet, and Stryker Corporation holding significant market share. Technological innovation, primarily in cell-based therapies and biomaterials, is a key driver, alongside increasing prevalence of osteoarthritis and other cartilage degenerative diseases. Stringent regulatory frameworks govern the approval and commercialization of new treatments, creating both opportunities and challenges. Competitive pressures arise from both established players and emerging companies developing innovative solutions. The market is witnessing a rise in M&A activity, with larger players strategically acquiring smaller companies with promising technologies. End-user demographics are shifting towards an older population with a higher incidence of cartilage degeneration, fueling market growth.
- Market Concentration: Moderately concentrated, with top 5 players holding approximately XX% market share in 2025.
- Technological Innovation: Significant advancements in cell-based therapies, biomaterials, and minimally invasive surgical techniques.
- Regulatory Frameworks: Stringent regulatory pathways for new treatments, impacting market entry and timelines.
- Competitive Landscape: Intense competition among established players and emerging biotech companies.
- M&A Activity: XX deals completed in the period 2019-2024, valued at approximately $XX Billion.
- Innovation Barriers: High regulatory hurdles, significant R&D investment required, and long clinical trial timelines.
Cartilage Degeneration Industry Growth Trends & Insights
The Cartilage Degeneration market experienced robust growth during the historical period (2019-2024), driven by factors including the aging population, rising prevalence of osteoarthritis, and technological advancements. The market is expected to continue its growth trajectory during the forecast period (2025-2033), albeit at a slightly moderated pace. This is attributed to increased awareness, improved treatment options, and expanding healthcare infrastructure. The adoption rate of advanced therapies, such as cell-based treatments, is steadily increasing, though it remains limited due to high costs and accessibility issues. Consumer behavior is shifting towards minimally invasive procedures and personalized medicine approaches. The market size is projected to reach $XX Billion by 2033, exhibiting a CAGR of XX% during the forecast period. Technological disruptions, such as the introduction of novel biomaterials and advanced imaging techniques, are expected to further accelerate market growth. Increased penetration of minimally invasive surgical procedures is anticipated to be a major driver.
Dominant Regions, Countries, or Segments in Cartilage Degeneration Industry
North America currently dominates the Cartilage Degeneration market, driven by high healthcare expenditure, advanced healthcare infrastructure, and a large elderly population. Europe follows as the second largest market. Within segments, the knee application site holds the largest market share, followed by the hip. Hyaline cartilage represents the largest type of cartilage segment, due to its prevalence in osteoarthritis. Non-cell-based treatments currently dominate the treatment modality segment, however, cell-based therapies are anticipated to experience faster growth. Palliative treatment is currently the leading treatment type.
- Leading Region: North America (Market share of XX% in 2025)
- Key Drivers (North America): High healthcare expenditure, advanced medical infrastructure, and large geriatric population.
- Key Drivers (Europe): Increasing prevalence of osteoarthritis and rising healthcare spending.
- Leading Segment (Application Site): Knee (Market share of XX% in 2025)
- Leading Segment (Type of Cartilage): Hyaline Cartilage (Market share of XX% in 2025)
- Leading Segment (Treatment Modality): Non-cell-based (Market share of XX% in 2025)
- Leading Segment (Treatment Type): Palliative (Market share of XX% in 2025)
Cartilage Degeneration Industry Product Landscape
The Cartilage Degeneration product landscape is characterized by a diverse range of products, including biologics, synthetic implants, and minimally invasive surgical tools. Recent innovations focus on improving the efficacy and longevity of treatments, reducing invasiveness, and personalizing treatment approaches. Biologics, such as hyaluronic acid-based injections and cell-based therapies, are gaining traction due to their regenerative potential. Synthetic implants offer durable solutions but may have limitations regarding integration with surrounding tissues. Unique selling propositions often focus on improved biocompatibility, minimal invasiveness, and enhanced patient outcomes. Technological advancements are continually improving the performance metrics of these products.
Key Drivers, Barriers & Challenges in Cartilage Degeneration Industry
Key Drivers:
- The aging global population and rising prevalence of osteoarthritis are major drivers.
- Technological advancements in minimally invasive procedures and regenerative medicine are accelerating market growth.
- Increasing healthcare expenditure and improved healthcare infrastructure contribute to market expansion.
Key Barriers & Challenges:
- High cost of advanced therapies, such as cell-based treatments, limits accessibility.
- Stringent regulatory pathways and lengthy clinical trials create barriers to market entry.
- Intense competition among established players and emerging companies hinders market penetration for individual products. Supply chain disruptions have also impacted availability of certain products. The overall impact is estimated at a XX% reduction in market growth in 2024.
Emerging Opportunities in Cartilage Degeneration Industry
Emerging opportunities exist in personalized medicine approaches, leveraging genetic information to tailor treatment plans. Untapped markets in developing economies present significant growth potential. The development of novel biomaterials with enhanced biocompatibility and integration properties offers exciting prospects. Expanding applications beyond the knee to other joints, such as the shoulder and hand, create additional market avenues. Increasing demand for minimally invasive surgical techniques will drive growth in this area.
Growth Accelerators in the Cartilage Degeneration Industry
Several factors are poised to accelerate long-term growth. Technological breakthroughs, particularly in regenerative medicine and personalized medicine, are expected to significantly advance treatment options. Strategic partnerships between pharmaceutical companies and biotech firms can facilitate faster product development and market entry. Expanding into new geographic markets, especially in developing countries with rising healthcare expenditure, will unlock significant growth opportunities.
Key Players Shaping the Cartilage Degeneration Industry Market
- Arthrex Inc
- Zimmer Biomet
- Cyfuse Biomedical K K
- Geistlich Pharma AG
- Anika Therapeutics Inc
- Vericel Corporation
- Johnson & Johnson
- B Braun Melsungen AG
- Stryker Corporation
- Smith & Nephew plc
Notable Milestones in Cartilage Degeneration Industry Sector
- July 2022: Orthox received Medicines and Healthcare products Regulatory Agency (MHRA) authorisation for a clinical trial of its knee cartilage repair FibroFix product platform.
- July 2021: The United States Food and Drug Administration granted breakthrough device status to Hyalex's cartilage system.
In-Depth Cartilage Degeneration Industry Market Outlook
The Cartilage Degeneration market exhibits strong growth potential, driven by a confluence of factors including the aging population, technological advancements, and increasing healthcare spending. Strategic opportunities exist for companies focused on innovation in cell-based therapies, personalized medicine, and minimally invasive procedures. Expanding into emerging markets and developing strategic partnerships will be crucial for long-term success. The market is projected to experience sustained growth over the next decade, presenting significant opportunities for both established players and new entrants.
Cartilage Degeneration Industry Segmentation
-
1. Types of Cartilage
- 1.1. Fibrocartilage
- 1.2. Hyaline Cartilage
- 1.3. Others
-
2. Treatment Modality
- 2.1. Cell-based
- 2.2. Non-Cell-based
-
3. Treatment Type
- 3.1. Palliative
- 3.2. Intrinsic Repair Stimulus
-
4. Application Site
- 4.1. Knee
- 4.2. Spine
- 4.3. Ankle
- 4.4. Hip
- 4.5. Others
Cartilage Degeneration Industry Segmentation By Geography
-
1. North America
- 1.1. United States
- 1.2. Canada
- 1.3. Mexico
-
2. Europe
- 2.1. Germany
- 2.2. United Kingdom
- 2.3. France
- 2.4. Italy
- 2.5. Spain
- 2.6. Rest of Europe
-
3. Asia Pacific
- 3.1. China
- 3.2. Japan
- 3.3. India
- 3.4. Australia
- 3.5. South Korea
- 3.6. Rest of Asia Pacific
-
4. Middle East and Africa
- 4.1. GCC
- 4.2. South Africa
- 4.3. Rest of Middle East and Africa
-
5. South America
- 5.1. Brazil
- 5.2. Argentina
- 5.3. Rest of South America
Cartilage Degeneration Industry REPORT HIGHLIGHTS
| Aspects | Details |
|---|---|
| Study Period | 2019-2033 |
| Base Year | 2024 |
| Estimated Year | 2025 |
| Forecast Period | 2025-2033 |
| Historical Period | 2019-2024 |
| Growth Rate | CAGR of 8.00% from 2019-2033 |
| Segmentation |
|
Table of Contents
- 1. Introduction
- 1.1. Research Scope
- 1.2. Market Segmentation
- 1.3. Research Methodology
- 1.4. Definitions and Assumptions
- 2. Executive Summary
- 2.1. Introduction
- 3. Market Dynamics
- 3.1. Introduction
- 3.2. Market Drivers
- 3.2.1. Rising Prevalence of the Joints and Bones Disorders around the World and Increasing Geriatric Population; Technological Advancements in Cartilage Repair/Regeneration; Increasing Number of Injuries and Accidents
- 3.3. Market Restrains
- 3.3.1. High Costs of Cartilage Repair Procedures; Regulatory and Reimbursement Issues
- 3.4. Market Trends
- 3.4.1. Knee Application Segment is Expected to Hold a Major Share in the Cartilage Repair/Regeneration Market
- 4. Market Factor Analysis
- 4.1. Porters Five Forces
- 4.2. Supply/Value Chain
- 4.3. PESTEL analysis
- 4.4. Market Entropy
- 4.5. Patent/Trademark Analysis
- 5. Global Cartilage Degeneration Industry Analysis, Insights and Forecast, 2019-2031
- 5.1. Market Analysis, Insights and Forecast - by Types of Cartilage
- 5.1.1. Fibrocartilage
- 5.1.2. Hyaline Cartilage
- 5.1.3. Others
- 5.2. Market Analysis, Insights and Forecast - by Treatment Modality
- 5.2.1. Cell-based
- 5.2.2. Non-Cell-based
- 5.3. Market Analysis, Insights and Forecast - by Treatment Type
- 5.3.1. Palliative
- 5.3.2. Intrinsic Repair Stimulus
- 5.4. Market Analysis, Insights and Forecast - by Application Site
- 5.4.1. Knee
- 5.4.2. Spine
- 5.4.3. Ankle
- 5.4.4. Hip
- 5.4.5. Others
- 5.5. Market Analysis, Insights and Forecast - by Region
- 5.5.1. North America
- 5.5.2. Europe
- 5.5.3. Asia Pacific
- 5.5.4. Middle East and Africa
- 5.5.5. South America
- 5.1. Market Analysis, Insights and Forecast - by Types of Cartilage
- 6. North America Cartilage Degeneration Industry Analysis, Insights and Forecast, 2019-2031
- 6.1. Market Analysis, Insights and Forecast - by Types of Cartilage
- 6.1.1. Fibrocartilage
- 6.1.2. Hyaline Cartilage
- 6.1.3. Others
- 6.2. Market Analysis, Insights and Forecast - by Treatment Modality
- 6.2.1. Cell-based
- 6.2.2. Non-Cell-based
- 6.3. Market Analysis, Insights and Forecast - by Treatment Type
- 6.3.1. Palliative
- 6.3.2. Intrinsic Repair Stimulus
- 6.4. Market Analysis, Insights and Forecast - by Application Site
- 6.4.1. Knee
- 6.4.2. Spine
- 6.4.3. Ankle
- 6.4.4. Hip
- 6.4.5. Others
- 6.1. Market Analysis, Insights and Forecast - by Types of Cartilage
- 7. Europe Cartilage Degeneration Industry Analysis, Insights and Forecast, 2019-2031
- 7.1. Market Analysis, Insights and Forecast - by Types of Cartilage
- 7.1.1. Fibrocartilage
- 7.1.2. Hyaline Cartilage
- 7.1.3. Others
- 7.2. Market Analysis, Insights and Forecast - by Treatment Modality
- 7.2.1. Cell-based
- 7.2.2. Non-Cell-based
- 7.3. Market Analysis, Insights and Forecast - by Treatment Type
- 7.3.1. Palliative
- 7.3.2. Intrinsic Repair Stimulus
- 7.4. Market Analysis, Insights and Forecast - by Application Site
- 7.4.1. Knee
- 7.4.2. Spine
- 7.4.3. Ankle
- 7.4.4. Hip
- 7.4.5. Others
- 7.1. Market Analysis, Insights and Forecast - by Types of Cartilage
- 8. Asia Pacific Cartilage Degeneration Industry Analysis, Insights and Forecast, 2019-2031
- 8.1. Market Analysis, Insights and Forecast - by Types of Cartilage
- 8.1.1. Fibrocartilage
- 8.1.2. Hyaline Cartilage
- 8.1.3. Others
- 8.2. Market Analysis, Insights and Forecast - by Treatment Modality
- 8.2.1. Cell-based
- 8.2.2. Non-Cell-based
- 8.3. Market Analysis, Insights and Forecast - by Treatment Type
- 8.3.1. Palliative
- 8.3.2. Intrinsic Repair Stimulus
- 8.4. Market Analysis, Insights and Forecast - by Application Site
- 8.4.1. Knee
- 8.4.2. Spine
- 8.4.3. Ankle
- 8.4.4. Hip
- 8.4.5. Others
- 8.1. Market Analysis, Insights and Forecast - by Types of Cartilage
- 9. Middle East and Africa Cartilage Degeneration Industry Analysis, Insights and Forecast, 2019-2031
- 9.1. Market Analysis, Insights and Forecast - by Types of Cartilage
- 9.1.1. Fibrocartilage
- 9.1.2. Hyaline Cartilage
- 9.1.3. Others
- 9.2. Market Analysis, Insights and Forecast - by Treatment Modality
- 9.2.1. Cell-based
- 9.2.2. Non-Cell-based
- 9.3. Market Analysis, Insights and Forecast - by Treatment Type
- 9.3.1. Palliative
- 9.3.2. Intrinsic Repair Stimulus
- 9.4. Market Analysis, Insights and Forecast - by Application Site
- 9.4.1. Knee
- 9.4.2. Spine
- 9.4.3. Ankle
- 9.4.4. Hip
- 9.4.5. Others
- 9.1. Market Analysis, Insights and Forecast - by Types of Cartilage
- 10. South America Cartilage Degeneration Industry Analysis, Insights and Forecast, 2019-2031
- 10.1. Market Analysis, Insights and Forecast - by Types of Cartilage
- 10.1.1. Fibrocartilage
- 10.1.2. Hyaline Cartilage
- 10.1.3. Others
- 10.2. Market Analysis, Insights and Forecast - by Treatment Modality
- 10.2.1. Cell-based
- 10.2.2. Non-Cell-based
- 10.3. Market Analysis, Insights and Forecast - by Treatment Type
- 10.3.1. Palliative
- 10.3.2. Intrinsic Repair Stimulus
- 10.4. Market Analysis, Insights and Forecast - by Application Site
- 10.4.1. Knee
- 10.4.2. Spine
- 10.4.3. Ankle
- 10.4.4. Hip
- 10.4.5. Others
- 10.1. Market Analysis, Insights and Forecast - by Types of Cartilage
- 11. North America Cartilage Degeneration Industry Analysis, Insights and Forecast, 2019-2031
- 11.1. Market Analysis, Insights and Forecast - By Country/Sub-region
- 11.1.1. undefined
- 12. Europe Cartilage Degeneration Industry Analysis, Insights and Forecast, 2019-2031
- 12.1. Market Analysis, Insights and Forecast - By Country/Sub-region
- 12.1.1. undefined
- 13. Asia Pacific Cartilage Degeneration Industry Analysis, Insights and Forecast, 2019-2031
- 13.1. Market Analysis, Insights and Forecast - By Country/Sub-region
- 13.1.1. undefined
- 14. Middle East and Africa Cartilage Degeneration Industry Analysis, Insights and Forecast, 2019-2031
- 14.1. Market Analysis, Insights and Forecast - By Country/Sub-region
- 14.1.1. undefined
- 15. South America Cartilage Degeneration Industry Analysis, Insights and Forecast, 2019-2031
- 15.1. Market Analysis, Insights and Forecast - By Country/Sub-region
- 15.1.1. undefined
- 16. Competitive Analysis
- 16.1. Global Market Share Analysis 2024
- 16.2. Company Profiles
- 16.2.1 Arthrex Inc
- 16.2.1.1. Overview
- 16.2.1.2. Products
- 16.2.1.3. SWOT Analysis
- 16.2.1.4. Recent Developments
- 16.2.1.5. Financials (Based on Availability)
- 16.2.2 Zimmer Biomet
- 16.2.2.1. Overview
- 16.2.2.2. Products
- 16.2.2.3. SWOT Analysis
- 16.2.2.4. Recent Developments
- 16.2.2.5. Financials (Based on Availability)
- 16.2.3 Cyfuse Biomedical K K
- 16.2.3.1. Overview
- 16.2.3.2. Products
- 16.2.3.3. SWOT Analysis
- 16.2.3.4. Recent Developments
- 16.2.3.5. Financials (Based on Availability)
- 16.2.4 Geistlich Pharma AG
- 16.2.4.1. Overview
- 16.2.4.2. Products
- 16.2.4.3. SWOT Analysis
- 16.2.4.4. Recent Developments
- 16.2.4.5. Financials (Based on Availability)
- 16.2.5 Anika Therapeutics Inc
- 16.2.5.1. Overview
- 16.2.5.2. Products
- 16.2.5.3. SWOT Analysis
- 16.2.5.4. Recent Developments
- 16.2.5.5. Financials (Based on Availability)
- 16.2.6 Vericel Corporation
- 16.2.6.1. Overview
- 16.2.6.2. Products
- 16.2.6.3. SWOT Analysis
- 16.2.6.4. Recent Developments
- 16.2.6.5. Financials (Based on Availability)
- 16.2.7 Johnson & Johnson
- 16.2.7.1. Overview
- 16.2.7.2. Products
- 16.2.7.3. SWOT Analysis
- 16.2.7.4. Recent Developments
- 16.2.7.5. Financials (Based on Availability)
- 16.2.8 B Braun Melsungen AG
- 16.2.8.1. Overview
- 16.2.8.2. Products
- 16.2.8.3. SWOT Analysis
- 16.2.8.4. Recent Developments
- 16.2.8.5. Financials (Based on Availability)
- 16.2.9 Stryker Corporation
- 16.2.9.1. Overview
- 16.2.9.2. Products
- 16.2.9.3. SWOT Analysis
- 16.2.9.4. Recent Developments
- 16.2.9.5. Financials (Based on Availability)
- 16.2.10 Smith & Nephew plc
- 16.2.10.1. Overview
- 16.2.10.2. Products
- 16.2.10.3. SWOT Analysis
- 16.2.10.4. Recent Developments
- 16.2.10.5. Financials (Based on Availability)
- 16.2.1 Arthrex Inc
List of Figures
- Figure 1: Global Cartilage Degeneration Industry Revenue Breakdown (Million, %) by Region 2024 & 2032
- Figure 2: Global Cartilage Degeneration Industry Volume Breakdown (K Unit, %) by Region 2024 & 2032
- Figure 3: North America Cartilage Degeneration Industry Revenue (Million), by Country 2024 & 2032
- Figure 4: North America Cartilage Degeneration Industry Volume (K Unit), by Country 2024 & 2032
- Figure 5: North America Cartilage Degeneration Industry Revenue Share (%), by Country 2024 & 2032
- Figure 6: North America Cartilage Degeneration Industry Volume Share (%), by Country 2024 & 2032
- Figure 7: Europe Cartilage Degeneration Industry Revenue (Million), by Country 2024 & 2032
- Figure 8: Europe Cartilage Degeneration Industry Volume (K Unit), by Country 2024 & 2032
- Figure 9: Europe Cartilage Degeneration Industry Revenue Share (%), by Country 2024 & 2032
- Figure 10: Europe Cartilage Degeneration Industry Volume Share (%), by Country 2024 & 2032
- Figure 11: Asia Pacific Cartilage Degeneration Industry Revenue (Million), by Country 2024 & 2032
- Figure 12: Asia Pacific Cartilage Degeneration Industry Volume (K Unit), by Country 2024 & 2032
- Figure 13: Asia Pacific Cartilage Degeneration Industry Revenue Share (%), by Country 2024 & 2032
- Figure 14: Asia Pacific Cartilage Degeneration Industry Volume Share (%), by Country 2024 & 2032
- Figure 15: Middle East and Africa Cartilage Degeneration Industry Revenue (Million), by Country 2024 & 2032
- Figure 16: Middle East and Africa Cartilage Degeneration Industry Volume (K Unit), by Country 2024 & 2032
- Figure 17: Middle East and Africa Cartilage Degeneration Industry Revenue Share (%), by Country 2024 & 2032
- Figure 18: Middle East and Africa Cartilage Degeneration Industry Volume Share (%), by Country 2024 & 2032
- Figure 19: South America Cartilage Degeneration Industry Revenue (Million), by Country 2024 & 2032
- Figure 20: South America Cartilage Degeneration Industry Volume (K Unit), by Country 2024 & 2032
- Figure 21: South America Cartilage Degeneration Industry Revenue Share (%), by Country 2024 & 2032
- Figure 22: South America Cartilage Degeneration Industry Volume Share (%), by Country 2024 & 2032
- Figure 23: North America Cartilage Degeneration Industry Revenue (Million), by Types of Cartilage 2024 & 2032
- Figure 24: North America Cartilage Degeneration Industry Volume (K Unit), by Types of Cartilage 2024 & 2032
- Figure 25: North America Cartilage Degeneration Industry Revenue Share (%), by Types of Cartilage 2024 & 2032
- Figure 26: North America Cartilage Degeneration Industry Volume Share (%), by Types of Cartilage 2024 & 2032
- Figure 27: North America Cartilage Degeneration Industry Revenue (Million), by Treatment Modality 2024 & 2032
- Figure 28: North America Cartilage Degeneration Industry Volume (K Unit), by Treatment Modality 2024 & 2032
- Figure 29: North America Cartilage Degeneration Industry Revenue Share (%), by Treatment Modality 2024 & 2032
- Figure 30: North America Cartilage Degeneration Industry Volume Share (%), by Treatment Modality 2024 & 2032
- Figure 31: North America Cartilage Degeneration Industry Revenue (Million), by Treatment Type 2024 & 2032
- Figure 32: North America Cartilage Degeneration Industry Volume (K Unit), by Treatment Type 2024 & 2032
- Figure 33: North America Cartilage Degeneration Industry Revenue Share (%), by Treatment Type 2024 & 2032
- Figure 34: North America Cartilage Degeneration Industry Volume Share (%), by Treatment Type 2024 & 2032
- Figure 35: North America Cartilage Degeneration Industry Revenue (Million), by Application Site 2024 & 2032
- Figure 36: North America Cartilage Degeneration Industry Volume (K Unit), by Application Site 2024 & 2032
- Figure 37: North America Cartilage Degeneration Industry Revenue Share (%), by Application Site 2024 & 2032
- Figure 38: North America Cartilage Degeneration Industry Volume Share (%), by Application Site 2024 & 2032
- Figure 39: North America Cartilage Degeneration Industry Revenue (Million), by Country 2024 & 2032
- Figure 40: North America Cartilage Degeneration Industry Volume (K Unit), by Country 2024 & 2032
- Figure 41: North America Cartilage Degeneration Industry Revenue Share (%), by Country 2024 & 2032
- Figure 42: North America Cartilage Degeneration Industry Volume Share (%), by Country 2024 & 2032
- Figure 43: Europe Cartilage Degeneration Industry Revenue (Million), by Types of Cartilage 2024 & 2032
- Figure 44: Europe Cartilage Degeneration Industry Volume (K Unit), by Types of Cartilage 2024 & 2032
- Figure 45: Europe Cartilage Degeneration Industry Revenue Share (%), by Types of Cartilage 2024 & 2032
- Figure 46: Europe Cartilage Degeneration Industry Volume Share (%), by Types of Cartilage 2024 & 2032
- Figure 47: Europe Cartilage Degeneration Industry Revenue (Million), by Treatment Modality 2024 & 2032
- Figure 48: Europe Cartilage Degeneration Industry Volume (K Unit), by Treatment Modality 2024 & 2032
- Figure 49: Europe Cartilage Degeneration Industry Revenue Share (%), by Treatment Modality 2024 & 2032
- Figure 50: Europe Cartilage Degeneration Industry Volume Share (%), by Treatment Modality 2024 & 2032
- Figure 51: Europe Cartilage Degeneration Industry Revenue (Million), by Treatment Type 2024 & 2032
- Figure 52: Europe Cartilage Degeneration Industry Volume (K Unit), by Treatment Type 2024 & 2032
- Figure 53: Europe Cartilage Degeneration Industry Revenue Share (%), by Treatment Type 2024 & 2032
- Figure 54: Europe Cartilage Degeneration Industry Volume Share (%), by Treatment Type 2024 & 2032
- Figure 55: Europe Cartilage Degeneration Industry Revenue (Million), by Application Site 2024 & 2032
- Figure 56: Europe Cartilage Degeneration Industry Volume (K Unit), by Application Site 2024 & 2032
- Figure 57: Europe Cartilage Degeneration Industry Revenue Share (%), by Application Site 2024 & 2032
- Figure 58: Europe Cartilage Degeneration Industry Volume Share (%), by Application Site 2024 & 2032
- Figure 59: Europe Cartilage Degeneration Industry Revenue (Million), by Country 2024 & 2032
- Figure 60: Europe Cartilage Degeneration Industry Volume (K Unit), by Country 2024 & 2032
- Figure 61: Europe Cartilage Degeneration Industry Revenue Share (%), by Country 2024 & 2032
- Figure 62: Europe Cartilage Degeneration Industry Volume Share (%), by Country 2024 & 2032
- Figure 63: Asia Pacific Cartilage Degeneration Industry Revenue (Million), by Types of Cartilage 2024 & 2032
- Figure 64: Asia Pacific Cartilage Degeneration Industry Volume (K Unit), by Types of Cartilage 2024 & 2032
- Figure 65: Asia Pacific Cartilage Degeneration Industry Revenue Share (%), by Types of Cartilage 2024 & 2032
- Figure 66: Asia Pacific Cartilage Degeneration Industry Volume Share (%), by Types of Cartilage 2024 & 2032
- Figure 67: Asia Pacific Cartilage Degeneration Industry Revenue (Million), by Treatment Modality 2024 & 2032
- Figure 68: Asia Pacific Cartilage Degeneration Industry Volume (K Unit), by Treatment Modality 2024 & 2032
- Figure 69: Asia Pacific Cartilage Degeneration Industry Revenue Share (%), by Treatment Modality 2024 & 2032
- Figure 70: Asia Pacific Cartilage Degeneration Industry Volume Share (%), by Treatment Modality 2024 & 2032
- Figure 71: Asia Pacific Cartilage Degeneration Industry Revenue (Million), by Treatment Type 2024 & 2032
- Figure 72: Asia Pacific Cartilage Degeneration Industry Volume (K Unit), by Treatment Type 2024 & 2032
- Figure 73: Asia Pacific Cartilage Degeneration Industry Revenue Share (%), by Treatment Type 2024 & 2032
- Figure 74: Asia Pacific Cartilage Degeneration Industry Volume Share (%), by Treatment Type 2024 & 2032
- Figure 75: Asia Pacific Cartilage Degeneration Industry Revenue (Million), by Application Site 2024 & 2032
- Figure 76: Asia Pacific Cartilage Degeneration Industry Volume (K Unit), by Application Site 2024 & 2032
- Figure 77: Asia Pacific Cartilage Degeneration Industry Revenue Share (%), by Application Site 2024 & 2032
- Figure 78: Asia Pacific Cartilage Degeneration Industry Volume Share (%), by Application Site 2024 & 2032
- Figure 79: Asia Pacific Cartilage Degeneration Industry Revenue (Million), by Country 2024 & 2032
- Figure 80: Asia Pacific Cartilage Degeneration Industry Volume (K Unit), by Country 2024 & 2032
- Figure 81: Asia Pacific Cartilage Degeneration Industry Revenue Share (%), by Country 2024 & 2032
- Figure 82: Asia Pacific Cartilage Degeneration Industry Volume Share (%), by Country 2024 & 2032
- Figure 83: Middle East and Africa Cartilage Degeneration Industry Revenue (Million), by Types of Cartilage 2024 & 2032
- Figure 84: Middle East and Africa Cartilage Degeneration Industry Volume (K Unit), by Types of Cartilage 2024 & 2032
- Figure 85: Middle East and Africa Cartilage Degeneration Industry Revenue Share (%), by Types of Cartilage 2024 & 2032
- Figure 86: Middle East and Africa Cartilage Degeneration Industry Volume Share (%), by Types of Cartilage 2024 & 2032
- Figure 87: Middle East and Africa Cartilage Degeneration Industry Revenue (Million), by Treatment Modality 2024 & 2032
- Figure 88: Middle East and Africa Cartilage Degeneration Industry Volume (K Unit), by Treatment Modality 2024 & 2032
- Figure 89: Middle East and Africa Cartilage Degeneration Industry Revenue Share (%), by Treatment Modality 2024 & 2032
- Figure 90: Middle East and Africa Cartilage Degeneration Industry Volume Share (%), by Treatment Modality 2024 & 2032
- Figure 91: Middle East and Africa Cartilage Degeneration Industry Revenue (Million), by Treatment Type 2024 & 2032
- Figure 92: Middle East and Africa Cartilage Degeneration Industry Volume (K Unit), by Treatment Type 2024 & 2032
- Figure 93: Middle East and Africa Cartilage Degeneration Industry Revenue Share (%), by Treatment Type 2024 & 2032
- Figure 94: Middle East and Africa Cartilage Degeneration Industry Volume Share (%), by Treatment Type 2024 & 2032
- Figure 95: Middle East and Africa Cartilage Degeneration Industry Revenue (Million), by Application Site 2024 & 2032
- Figure 96: Middle East and Africa Cartilage Degeneration Industry Volume (K Unit), by Application Site 2024 & 2032
- Figure 97: Middle East and Africa Cartilage Degeneration Industry Revenue Share (%), by Application Site 2024 & 2032
- Figure 98: Middle East and Africa Cartilage Degeneration Industry Volume Share (%), by Application Site 2024 & 2032
- Figure 99: Middle East and Africa Cartilage Degeneration Industry Revenue (Million), by Country 2024 & 2032
- Figure 100: Middle East and Africa Cartilage Degeneration Industry Volume (K Unit), by Country 2024 & 2032
- Figure 101: Middle East and Africa Cartilage Degeneration Industry Revenue Share (%), by Country 2024 & 2032
- Figure 102: Middle East and Africa Cartilage Degeneration Industry Volume Share (%), by Country 2024 & 2032
- Figure 103: South America Cartilage Degeneration Industry Revenue (Million), by Types of Cartilage 2024 & 2032
- Figure 104: South America Cartilage Degeneration Industry Volume (K Unit), by Types of Cartilage 2024 & 2032
- Figure 105: South America Cartilage Degeneration Industry Revenue Share (%), by Types of Cartilage 2024 & 2032
- Figure 106: South America Cartilage Degeneration Industry Volume Share (%), by Types of Cartilage 2024 & 2032
- Figure 107: South America Cartilage Degeneration Industry Revenue (Million), by Treatment Modality 2024 & 2032
- Figure 108: South America Cartilage Degeneration Industry Volume (K Unit), by Treatment Modality 2024 & 2032
- Figure 109: South America Cartilage Degeneration Industry Revenue Share (%), by Treatment Modality 2024 & 2032
- Figure 110: South America Cartilage Degeneration Industry Volume Share (%), by Treatment Modality 2024 & 2032
- Figure 111: South America Cartilage Degeneration Industry Revenue (Million), by Treatment Type 2024 & 2032
- Figure 112: South America Cartilage Degeneration Industry Volume (K Unit), by Treatment Type 2024 & 2032
- Figure 113: South America Cartilage Degeneration Industry Revenue Share (%), by Treatment Type 2024 & 2032
- Figure 114: South America Cartilage Degeneration Industry Volume Share (%), by Treatment Type 2024 & 2032
- Figure 115: South America Cartilage Degeneration Industry Revenue (Million), by Application Site 2024 & 2032
- Figure 116: South America Cartilage Degeneration Industry Volume (K Unit), by Application Site 2024 & 2032
- Figure 117: South America Cartilage Degeneration Industry Revenue Share (%), by Application Site 2024 & 2032
- Figure 118: South America Cartilage Degeneration Industry Volume Share (%), by Application Site 2024 & 2032
- Figure 119: South America Cartilage Degeneration Industry Revenue (Million), by Country 2024 & 2032
- Figure 120: South America Cartilage Degeneration Industry Volume (K Unit), by Country 2024 & 2032
- Figure 121: South America Cartilage Degeneration Industry Revenue Share (%), by Country 2024 & 2032
- Figure 122: South America Cartilage Degeneration Industry Volume Share (%), by Country 2024 & 2032
List of Tables
- Table 1: Global Cartilage Degeneration Industry Revenue Million Forecast, by Region 2019 & 2032
- Table 2: Global Cartilage Degeneration Industry Volume K Unit Forecast, by Region 2019 & 2032
- Table 3: Global Cartilage Degeneration Industry Revenue Million Forecast, by Types of Cartilage 2019 & 2032
- Table 4: Global Cartilage Degeneration Industry Volume K Unit Forecast, by Types of Cartilage 2019 & 2032
- Table 5: Global Cartilage Degeneration Industry Revenue Million Forecast, by Treatment Modality 2019 & 2032
- Table 6: Global Cartilage Degeneration Industry Volume K Unit Forecast, by Treatment Modality 2019 & 2032
- Table 7: Global Cartilage Degeneration Industry Revenue Million Forecast, by Treatment Type 2019 & 2032
- Table 8: Global Cartilage Degeneration Industry Volume K Unit Forecast, by Treatment Type 2019 & 2032
- Table 9: Global Cartilage Degeneration Industry Revenue Million Forecast, by Application Site 2019 & 2032
- Table 10: Global Cartilage Degeneration Industry Volume K Unit Forecast, by Application Site 2019 & 2032
- Table 11: Global Cartilage Degeneration Industry Revenue Million Forecast, by Region 2019 & 2032
- Table 12: Global Cartilage Degeneration Industry Volume K Unit Forecast, by Region 2019 & 2032
- Table 13: Global Cartilage Degeneration Industry Revenue Million Forecast, by Country 2019 & 2032
- Table 14: Global Cartilage Degeneration Industry Volume K Unit Forecast, by Country 2019 & 2032
- Table 15: Global Cartilage Degeneration Industry Revenue Million Forecast, by Country 2019 & 2032
- Table 16: Global Cartilage Degeneration Industry Volume K Unit Forecast, by Country 2019 & 2032
- Table 17: Global Cartilage Degeneration Industry Revenue Million Forecast, by Country 2019 & 2032
- Table 18: Global Cartilage Degeneration Industry Volume K Unit Forecast, by Country 2019 & 2032
- Table 19: Global Cartilage Degeneration Industry Revenue Million Forecast, by Country 2019 & 2032
- Table 20: Global Cartilage Degeneration Industry Volume K Unit Forecast, by Country 2019 & 2032
- Table 21: Global Cartilage Degeneration Industry Revenue Million Forecast, by Country 2019 & 2032
- Table 22: Global Cartilage Degeneration Industry Volume K Unit Forecast, by Country 2019 & 2032
- Table 23: Global Cartilage Degeneration Industry Revenue Million Forecast, by Types of Cartilage 2019 & 2032
- Table 24: Global Cartilage Degeneration Industry Volume K Unit Forecast, by Types of Cartilage 2019 & 2032
- Table 25: Global Cartilage Degeneration Industry Revenue Million Forecast, by Treatment Modality 2019 & 2032
- Table 26: Global Cartilage Degeneration Industry Volume K Unit Forecast, by Treatment Modality 2019 & 2032
- Table 27: Global Cartilage Degeneration Industry Revenue Million Forecast, by Treatment Type 2019 & 2032
- Table 28: Global Cartilage Degeneration Industry Volume K Unit Forecast, by Treatment Type 2019 & 2032
- Table 29: Global Cartilage Degeneration Industry Revenue Million Forecast, by Application Site 2019 & 2032
- Table 30: Global Cartilage Degeneration Industry Volume K Unit Forecast, by Application Site 2019 & 2032
- Table 31: Global Cartilage Degeneration Industry Revenue Million Forecast, by Country 2019 & 2032
- Table 32: Global Cartilage Degeneration Industry Volume K Unit Forecast, by Country 2019 & 2032
- Table 33: United States Cartilage Degeneration Industry Revenue (Million) Forecast, by Application 2019 & 2032
- Table 34: United States Cartilage Degeneration Industry Volume (K Unit) Forecast, by Application 2019 & 2032
- Table 35: Canada Cartilage Degeneration Industry Revenue (Million) Forecast, by Application 2019 & 2032
- Table 36: Canada Cartilage Degeneration Industry Volume (K Unit) Forecast, by Application 2019 & 2032
- Table 37: Mexico Cartilage Degeneration Industry Revenue (Million) Forecast, by Application 2019 & 2032
- Table 38: Mexico Cartilage Degeneration Industry Volume (K Unit) Forecast, by Application 2019 & 2032
- Table 39: Global Cartilage Degeneration Industry Revenue Million Forecast, by Types of Cartilage 2019 & 2032
- Table 40: Global Cartilage Degeneration Industry Volume K Unit Forecast, by Types of Cartilage 2019 & 2032
- Table 41: Global Cartilage Degeneration Industry Revenue Million Forecast, by Treatment Modality 2019 & 2032
- Table 42: Global Cartilage Degeneration Industry Volume K Unit Forecast, by Treatment Modality 2019 & 2032
- Table 43: Global Cartilage Degeneration Industry Revenue Million Forecast, by Treatment Type 2019 & 2032
- Table 44: Global Cartilage Degeneration Industry Volume K Unit Forecast, by Treatment Type 2019 & 2032
- Table 45: Global Cartilage Degeneration Industry Revenue Million Forecast, by Application Site 2019 & 2032
- Table 46: Global Cartilage Degeneration Industry Volume K Unit Forecast, by Application Site 2019 & 2032
- Table 47: Global Cartilage Degeneration Industry Revenue Million Forecast, by Country 2019 & 2032
- Table 48: Global Cartilage Degeneration Industry Volume K Unit Forecast, by Country 2019 & 2032
- Table 49: Germany Cartilage Degeneration Industry Revenue (Million) Forecast, by Application 2019 & 2032
- Table 50: Germany Cartilage Degeneration Industry Volume (K Unit) Forecast, by Application 2019 & 2032
- Table 51: United Kingdom Cartilage Degeneration Industry Revenue (Million) Forecast, by Application 2019 & 2032
- Table 52: United Kingdom Cartilage Degeneration Industry Volume (K Unit) Forecast, by Application 2019 & 2032
- Table 53: France Cartilage Degeneration Industry Revenue (Million) Forecast, by Application 2019 & 2032
- Table 54: France Cartilage Degeneration Industry Volume (K Unit) Forecast, by Application 2019 & 2032
- Table 55: Italy Cartilage Degeneration Industry Revenue (Million) Forecast, by Application 2019 & 2032
- Table 56: Italy Cartilage Degeneration Industry Volume (K Unit) Forecast, by Application 2019 & 2032
- Table 57: Spain Cartilage Degeneration Industry Revenue (Million) Forecast, by Application 2019 & 2032
- Table 58: Spain Cartilage Degeneration Industry Volume (K Unit) Forecast, by Application 2019 & 2032
- Table 59: Rest of Europe Cartilage Degeneration Industry Revenue (Million) Forecast, by Application 2019 & 2032
- Table 60: Rest of Europe Cartilage Degeneration Industry Volume (K Unit) Forecast, by Application 2019 & 2032
- Table 61: Global Cartilage Degeneration Industry Revenue Million Forecast, by Types of Cartilage 2019 & 2032
- Table 62: Global Cartilage Degeneration Industry Volume K Unit Forecast, by Types of Cartilage 2019 & 2032
- Table 63: Global Cartilage Degeneration Industry Revenue Million Forecast, by Treatment Modality 2019 & 2032
- Table 64: Global Cartilage Degeneration Industry Volume K Unit Forecast, by Treatment Modality 2019 & 2032
- Table 65: Global Cartilage Degeneration Industry Revenue Million Forecast, by Treatment Type 2019 & 2032
- Table 66: Global Cartilage Degeneration Industry Volume K Unit Forecast, by Treatment Type 2019 & 2032
- Table 67: Global Cartilage Degeneration Industry Revenue Million Forecast, by Application Site 2019 & 2032
- Table 68: Global Cartilage Degeneration Industry Volume K Unit Forecast, by Application Site 2019 & 2032
- Table 69: Global Cartilage Degeneration Industry Revenue Million Forecast, by Country 2019 & 2032
- Table 70: Global Cartilage Degeneration Industry Volume K Unit Forecast, by Country 2019 & 2032
- Table 71: China Cartilage Degeneration Industry Revenue (Million) Forecast, by Application 2019 & 2032
- Table 72: China Cartilage Degeneration Industry Volume (K Unit) Forecast, by Application 2019 & 2032
- Table 73: Japan Cartilage Degeneration Industry Revenue (Million) Forecast, by Application 2019 & 2032
- Table 74: Japan Cartilage Degeneration Industry Volume (K Unit) Forecast, by Application 2019 & 2032
- Table 75: India Cartilage Degeneration Industry Revenue (Million) Forecast, by Application 2019 & 2032
- Table 76: India Cartilage Degeneration Industry Volume (K Unit) Forecast, by Application 2019 & 2032
- Table 77: Australia Cartilage Degeneration Industry Revenue (Million) Forecast, by Application 2019 & 2032
- Table 78: Australia Cartilage Degeneration Industry Volume (K Unit) Forecast, by Application 2019 & 2032
- Table 79: South Korea Cartilage Degeneration Industry Revenue (Million) Forecast, by Application 2019 & 2032
- Table 80: South Korea Cartilage Degeneration Industry Volume (K Unit) Forecast, by Application 2019 & 2032
- Table 81: Rest of Asia Pacific Cartilage Degeneration Industry Revenue (Million) Forecast, by Application 2019 & 2032
- Table 82: Rest of Asia Pacific Cartilage Degeneration Industry Volume (K Unit) Forecast, by Application 2019 & 2032
- Table 83: Global Cartilage Degeneration Industry Revenue Million Forecast, by Types of Cartilage 2019 & 2032
- Table 84: Global Cartilage Degeneration Industry Volume K Unit Forecast, by Types of Cartilage 2019 & 2032
- Table 85: Global Cartilage Degeneration Industry Revenue Million Forecast, by Treatment Modality 2019 & 2032
- Table 86: Global Cartilage Degeneration Industry Volume K Unit Forecast, by Treatment Modality 2019 & 2032
- Table 87: Global Cartilage Degeneration Industry Revenue Million Forecast, by Treatment Type 2019 & 2032
- Table 88: Global Cartilage Degeneration Industry Volume K Unit Forecast, by Treatment Type 2019 & 2032
- Table 89: Global Cartilage Degeneration Industry Revenue Million Forecast, by Application Site 2019 & 2032
- Table 90: Global Cartilage Degeneration Industry Volume K Unit Forecast, by Application Site 2019 & 2032
- Table 91: Global Cartilage Degeneration Industry Revenue Million Forecast, by Country 2019 & 2032
- Table 92: Global Cartilage Degeneration Industry Volume K Unit Forecast, by Country 2019 & 2032
- Table 93: GCC Cartilage Degeneration Industry Revenue (Million) Forecast, by Application 2019 & 2032
- Table 94: GCC Cartilage Degeneration Industry Volume (K Unit) Forecast, by Application 2019 & 2032
- Table 95: South Africa Cartilage Degeneration Industry Revenue (Million) Forecast, by Application 2019 & 2032
- Table 96: South Africa Cartilage Degeneration Industry Volume (K Unit) Forecast, by Application 2019 & 2032
- Table 97: Rest of Middle East and Africa Cartilage Degeneration Industry Revenue (Million) Forecast, by Application 2019 & 2032
- Table 98: Rest of Middle East and Africa Cartilage Degeneration Industry Volume (K Unit) Forecast, by Application 2019 & 2032
- Table 99: Global Cartilage Degeneration Industry Revenue Million Forecast, by Types of Cartilage 2019 & 2032
- Table 100: Global Cartilage Degeneration Industry Volume K Unit Forecast, by Types of Cartilage 2019 & 2032
- Table 101: Global Cartilage Degeneration Industry Revenue Million Forecast, by Treatment Modality 2019 & 2032
- Table 102: Global Cartilage Degeneration Industry Volume K Unit Forecast, by Treatment Modality 2019 & 2032
- Table 103: Global Cartilage Degeneration Industry Revenue Million Forecast, by Treatment Type 2019 & 2032
- Table 104: Global Cartilage Degeneration Industry Volume K Unit Forecast, by Treatment Type 2019 & 2032
- Table 105: Global Cartilage Degeneration Industry Revenue Million Forecast, by Application Site 2019 & 2032
- Table 106: Global Cartilage Degeneration Industry Volume K Unit Forecast, by Application Site 2019 & 2032
- Table 107: Global Cartilage Degeneration Industry Revenue Million Forecast, by Country 2019 & 2032
- Table 108: Global Cartilage Degeneration Industry Volume K Unit Forecast, by Country 2019 & 2032
- Table 109: Brazil Cartilage Degeneration Industry Revenue (Million) Forecast, by Application 2019 & 2032
- Table 110: Brazil Cartilage Degeneration Industry Volume (K Unit) Forecast, by Application 2019 & 2032
- Table 111: Argentina Cartilage Degeneration Industry Revenue (Million) Forecast, by Application 2019 & 2032
- Table 112: Argentina Cartilage Degeneration Industry Volume (K Unit) Forecast, by Application 2019 & 2032
- Table 113: Rest of South America Cartilage Degeneration Industry Revenue (Million) Forecast, by Application 2019 & 2032
- Table 114: Rest of South America Cartilage Degeneration Industry Volume (K Unit) Forecast, by Application 2019 & 2032
Frequently Asked Questions
1. What is the projected Compound Annual Growth Rate (CAGR) of the Cartilage Degeneration Industry?
The projected CAGR is approximately 8.00%.
2. Which companies are prominent players in the Cartilage Degeneration Industry?
Key companies in the market include Arthrex Inc, Zimmer Biomet, Cyfuse Biomedical K K, Geistlich Pharma AG, Anika Therapeutics Inc, Vericel Corporation, Johnson & Johnson, B Braun Melsungen AG, Stryker Corporation, Smith & Nephew plc.
3. What are the main segments of the Cartilage Degeneration Industry?
The market segments include Types of Cartilage, Treatment Modality, Treatment Type, Application Site.
4. Can you provide details about the market size?
The market size is estimated to be USD XX Million as of 2022.
5. What are some drivers contributing to market growth?
Rising Prevalence of the Joints and Bones Disorders around the World and Increasing Geriatric Population; Technological Advancements in Cartilage Repair/Regeneration; Increasing Number of Injuries and Accidents.
6. What are the notable trends driving market growth?
Knee Application Segment is Expected to Hold a Major Share in the Cartilage Repair/Regeneration Market.
7. Are there any restraints impacting market growth?
High Costs of Cartilage Repair Procedures; Regulatory and Reimbursement Issues.
8. Can you provide examples of recent developments in the market?
In July 2022, Orthox received Medicines and Healthcare products Regulatory Agency (MHRA) authorisation for a clinical trial of knee cartilage repair FibroFix product platform.
9. What pricing options are available for accessing the report?
Pricing options include single-user, multi-user, and enterprise licenses priced at USD 4750, USD 5250, and USD 8750 respectively.
10. Is the market size provided in terms of value or volume?
The market size is provided in terms of value, measured in Million and volume, measured in K Unit.
11. Are there any specific market keywords associated with the report?
Yes, the market keyword associated with the report is "Cartilage Degeneration Industry," which aids in identifying and referencing the specific market segment covered.
12. How do I determine which pricing option suits my needs best?
The pricing options vary based on user requirements and access needs. Individual users may opt for single-user licenses, while businesses requiring broader access may choose multi-user or enterprise licenses for cost-effective access to the report.
13. Are there any additional resources or data provided in the Cartilage Degeneration Industry report?
While the report offers comprehensive insights, it's advisable to review the specific contents or supplementary materials provided to ascertain if additional resources or data are available.
14. How can I stay updated on further developments or reports in the Cartilage Degeneration Industry?
To stay informed about further developments, trends, and reports in the Cartilage Degeneration Industry, consider subscribing to industry newsletters, following relevant companies and organizations, or regularly checking reputable industry news sources and publications.
Methodology
Step 1 - Identification of Relevant Samples Size from Population Database


Step 2 - Approaches for Defining Global Market Size (Value, Volume* & Price*)

Note*: In applicable scenarios
Step 3 - Data Sources
Primary Research
- Web Analytics
- Survey Reports
- Research Institute
- Latest Research Reports
- Opinion Leaders
Secondary Research
- Annual Reports
- White Paper
- Latest Press Release
- Industry Association
- Paid Database
- Investor Presentations

Step 4 - Data Triangulation
Involves using different sources of information in order to increase the validity of a study
These sources are likely to be stakeholders in a program - participants, other researchers, program staff, other community members, and so on.
Then we put all data in single framework & apply various statistical tools to find out the dynamic on the market.
During the analysis stage, feedback from the stakeholder groups would be compared to determine areas of agreement as well as areas of divergence


