

Key Insights
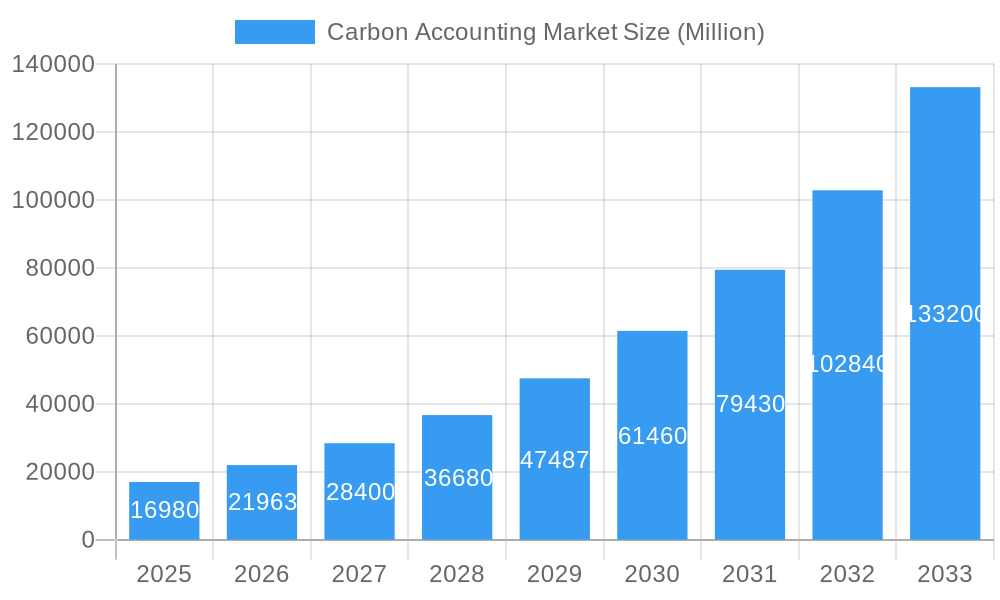
The global carbon accounting market is experiencing robust growth, projected to reach \$16.98 billion in 2025 and maintain a Compound Annual Growth Rate (CAGR) of 29.33% from 2025 to 2033. This significant expansion is driven by increasing regulatory pressures mandating carbon emissions reporting, heightened corporate social responsibility (CSR) initiatives focusing on environmental sustainability, and a growing awareness among businesses of the financial implications of carbon footprints. The demand for accurate and efficient carbon accounting solutions is particularly high across sectors like oil and gas, power utilities, and construction, where emissions are substantial. The cloud-based segment is leading the market due to its scalability, cost-effectiveness, and accessibility, while on-premise solutions cater to companies with stringent data security requirements. North America and Europe currently hold significant market share, but rapidly developing economies in Asia-Pacific are poised for substantial growth, fueled by increasing industrialization and government regulations.

Carbon Accounting Market Market Size (In Billion)
Further market expansion is expected due to advancements in data analytics and artificial intelligence (AI) which are enhancing the accuracy and efficiency of carbon accounting processes. The integration of these technologies allows for more comprehensive data collection, sophisticated emissions modeling, and improved verification processes. However, challenges remain, including the complexity of carbon accounting methodologies, a lack of standardized reporting frameworks across industries, and the high cost of implementation for smaller businesses. Overcoming these challenges through collaboration among stakeholders, the development of standardized protocols, and the promotion of affordable carbon accounting tools will be crucial for sustaining the market's impressive growth trajectory.
Carbon Accounting Market Company Market Share
Carbon Accounting Market: A Comprehensive Report (2019-2033)
This comprehensive report provides an in-depth analysis of the Carbon Accounting Market, encompassing market dynamics, growth trends, regional segmentation, product landscape, key players, and future outlook. The study period covers 2019-2033, with a base year of 2025 and a forecast period of 2025-2033. The report segments the market by end-user (Oil and Gas, Power Utilities, Construction and Infrastructure, Telecommunication, Food and Beverages, Other End Users) and type (Cloud Based, On-Premise), offering granular insights into this rapidly evolving market valued at XX million in 2025.
Carbon Accounting Market Market Dynamics & Structure
The Carbon Accounting market is experiencing a period of significant transformation, driven by a confluence of factors. While exhibiting moderate concentration among key players vying for market dominance, the landscape is dynamic. Rapid technological innovation, particularly in data analytics and AI, is a primary growth catalyst, enabling more efficient and accurate carbon footprint calculations. This is further amplified by the increasing stringency of global environmental regulations, mandating carbon accounting practices across diverse industries. While manual methods and less sophisticated software solutions remain, the market strongly favors carbon accounting software due to its enhanced accuracy, efficiency, and scalability. The strategic importance of this sector is clearly reflected in the considerable mergers and acquisitions (M&A) activity observed in recent years.
- Market Concentration: Moderately concentrated, with leading players holding a substantial, but evolving, market share. Competitive intensity varies by region and specific market segment.
- Technological Innovation: AI-powered solutions, seamless data integration capabilities, and advanced automation are key differentiators driving market growth and efficiency improvements.
- Regulatory Landscape: A tightening regulatory environment globally is accelerating the adoption of carbon accounting software, particularly in sectors with high emissions profiles.
- Competitive Substitutes: While manual methods and basic software persist, their limitations in accuracy, scalability, and reporting capabilities are leading to a shift toward sophisticated solutions.
- M&A Activity: Significant M&A activity underscores the strategic value and consolidation within the Carbon Accounting market, leading to the emergence of larger, more comprehensive platforms.
- Innovation Barriers: While high initial investment costs and complex integration challenges can pose barriers to entry, the long-term return on investment and regulatory pressures are incentivizing adoption.
Carbon Accounting Market Growth Trends & Insights
The Carbon Accounting market is demonstrating robust and sustained growth, propelled by heightened awareness of environmental sustainability and the critical need for precise carbon footprint measurement and reporting. Market projections indicate substantial expansion, reaching [Insert Projected Market Size] by 2033, representing a considerable Compound Annual Growth Rate (CAGR) of [Insert CAGR]. This growth is fueled by increasing adoption across diverse sectors, notably those with substantial carbon emissions, such as energy, manufacturing, and transportation. Technological advancements, including AI-driven solutions and improved data analytics, are streamlining processes, reducing costs, and enhancing accuracy. Furthermore, evolving consumer preferences are pushing businesses to adopt transparent carbon accounting practices to meet stakeholder expectations and maintain competitiveness.
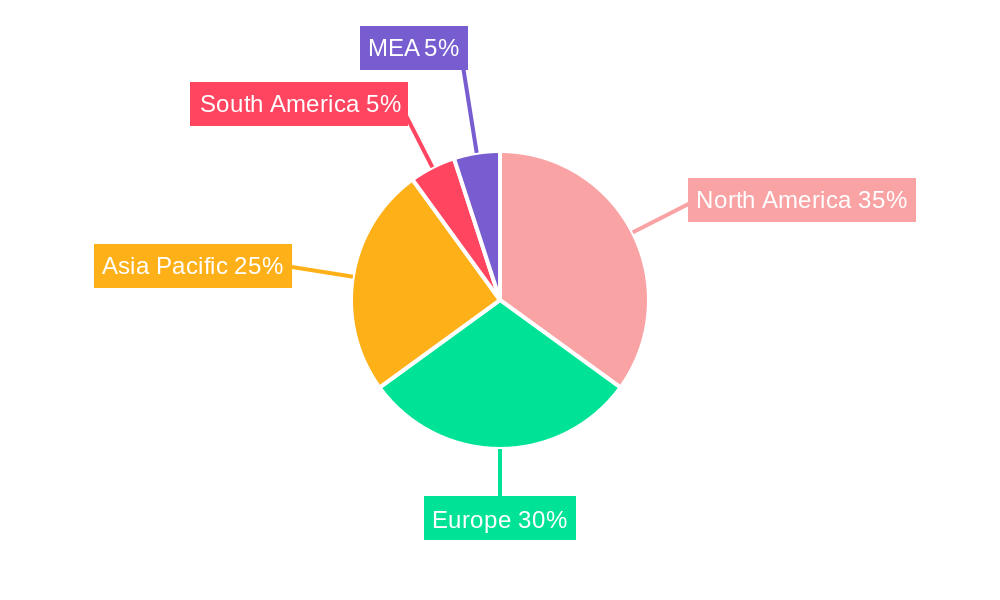
Dominant Regions, Countries, or Segments in Carbon Accounting Market
North America currently holds the largest market share, driven by stringent environmental regulations and a high concentration of large corporations adopting carbon accounting solutions. Europe follows closely, with strong governmental support for sustainability initiatives. Within end-user segments, the Oil and Gas sector is a significant driver, followed by Power Utilities and Construction and Infrastructure. The Cloud Based segment dominates the type category, due to its scalability and cost-effectiveness.
- Key Drivers (North America): Stringent environmental regulations, strong corporate ESG commitments, advanced technological infrastructure.
- Key Drivers (Europe): Governmental support for sustainability, EU Emission Trading Scheme (ETS), growing awareness among businesses.
- Dominant End-User Segment: Oil and Gas, due to the high volume of emissions and regulatory scrutiny.
- Dominant Type: Cloud Based, offering scalability and ease of accessibility.
- Growth Potential: Emerging economies in Asia-Pacific present significant untapped potential.
Carbon Accounting Market Product Landscape
The Carbon Accounting market offers a diverse range of solutions tailored to the unique needs of different organizations. From cloud-based Software-as-a-Service (SaaS) platforms offering scalability and accessibility to on-premise software providing greater control and customization, the market caters to a broad spectrum of users. Product innovation is focused on enhancing several key areas, including data integration with existing enterprise systems, improving the accuracy and reliability of emissions calculations, and creating intuitive user interfaces to streamline the carbon accounting process. Many leading solutions incorporate AI-powered features for automated data analysis, predictive modeling, and streamlined reporting. Successful solutions often emphasize user-friendly interfaces, real-time data visualization dashboards, robust reporting functionalities, and seamless integration with other ESG (Environmental, Social, and Governance) reporting systems.
Key Drivers, Barriers & Challenges in Carbon Accounting Market
Key Drivers: Growing regulatory pressure, rising corporate sustainability goals, increasing investor focus on ESG factors, and advancements in data analytics technology are major drivers. The increasing demand for accurate carbon footprint calculations is also contributing to market growth.
Key Challenges: High implementation costs, data integration complexities across disparate systems, lack of standardized methodologies, and resistance to adopting new technologies present key challenges. The complexity of calculating Scope 3 emissions can also pose a significant obstacle.
Emerging Opportunities in Carbon Accounting Market
Significant growth opportunities abound within the Carbon Accounting market, particularly in emerging economies and with the increasing focus on Scope 3 emissions (value chain emissions). The development of user-friendly and cost-effective software solutions specifically targeted at Small and Medium-sized Enterprises (SMEs) represents a vast untapped market segment. Furthermore, enhanced integration with other ESG reporting frameworks will create synergies and streamline overall sustainability reporting, significantly increasing the value proposition for businesses.
Growth Accelerators in the Carbon Accounting Market Industry
Strategic partnerships between software providers and consulting firms are accelerating market growth. Technological advancements, particularly in AI and machine learning, are enhancing the accuracy and efficiency of carbon accounting solutions. Expansion into untapped market segments, such as small and medium-sized enterprises (SMEs), is also a major growth catalyst.
Key Players Shaping the Carbon Accounting Market Market
- Normative
- Carbon Direct
- Greenly
- ENGIE Impact
- Sphera
- SINAI Technologies
- Persefoni AI
- Emitwise
- International Business Machines Corporation
- Diligent Corporation
Notable Milestones in Carbon Accounting Market Sector
- March 2024: Greenly secured USD 52 million in Series B funding, signifying investor confidence and fueling its global expansion strategy.
- March 2024: Green Project Technologies launched its White Label solution, expanding access to carbon accounting capabilities within the broader ESG service market and enabling partnerships.
- [Add other relevant milestones with dates and brief descriptions]
In-Depth Carbon Accounting Market Market Outlook
The Carbon Accounting market is poised for continued robust growth, driven by increasing regulatory pressure, expanding corporate sustainability initiatives, and technological advancements. Strategic partnerships and market expansion into emerging economies will further fuel this growth. Companies offering innovative, user-friendly, and accurate carbon accounting solutions are best positioned to capitalize on this expanding market.
Carbon Accounting Market Segmentation
-
1. Type
- 1.1. Cloud Based
- 1.2. On Premise
-
2. End Users
- 2.1. Oil and Gas
- 2.2. Power Utilities
- 2.3. Construction and Infrastructure
- 2.4. Telecommunication
- 2.5. Food and Beverages
- 2.6. Other End Users
Carbon Accounting Market Segmentation By Geography
-
1. North America
- 1.1. United States
- 1.2. Canada
- 1.3. Rest of North America
-
2. Europe
- 2.1. Germany
- 2.2. France
- 2.3. United Kingdom
- 2.4. Italy
- 2.5. Spain
- 2.6. NORDIC
- 2.7. Russia
- 2.8. Turkey
- 2.9. Rest of Europe
-
3. Asia Pacific
- 3.1. China
- 3.2. India
- 3.3. Australia
- 3.4. Japan
- 3.5. South Korea
- 3.6. Malaysia
- 3.7. Thailand
- 3.8. Indonesia
- 3.9. Vietnam
- 3.10. Rest of Asia Pacific
-
4. Middle East and Africa
- 4.1. Saudi Arabia
- 4.2. United Arab Emirates
- 4.3. Nigeria
- 4.4. Egypt
- 4.5. Qatar
- 4.6. South Africa
- 4.7. Rest of Middle East and Africa
-
5. South America
- 5.1. Brazil
- 5.2. Argentina
- 5.3. Colombia
- 5.4. Rest of South America
Carbon Accounting Market Regional Market Share
Geographic Coverage of Carbon Accounting Market
Carbon Accounting Market REPORT HIGHLIGHTS
| Aspects | Details |
|---|---|
| Study Period | 2020-2034 |
| Base Year | 2025 |
| Estimated Year | 2026 |
| Forecast Period | 2026-2034 |
| Historical Period | 2020-2025 |
| Growth Rate | CAGR of 29.33% from 2020-2034 |
| Segmentation |
|
Table of Contents
- 1. Introduction
- 1.1. Research Scope
- 1.2. Market Segmentation
- 1.3. Research Objective
- 1.4. Definitions and Assumptions
- 2. Executive Summary
- 2.1. Market Snapshot
- 3. Market Dynamics
- 3.1. Market Drivers
- 3.2. Market Restrains
- 3.3. Market Trends
- 3.4. Market Opportunities
- 4. Market Factor Analysis
- 4.1. Porters Five Forces
- 4.1.1. Bargaining Power of Suppliers
- 4.1.2. Bargaining Power of Buyers
- 4.1.3. Threat of New Entrants
- 4.1.4. Threat of Substitutes
- 4.1.5. Competitive Rivalry
- 4.2. PESTEL analysis
- 4.3. BCG Analysis
- 4.3.1. Stars (High Growth, High Market Share)
- 4.3.2. Cash Cows (Low Growth, High Market Share)
- 4.3.3. Question Mark (High Growth, Low Market Share)
- 4.3.4. Dogs (Low Growth, Low Market Share)
- 4.4. Ansoff Matrix Analysis
- 4.5. Supply Chain Analysis
- 4.6. Regulatory Landscape
- 4.7. Current Market Potential and Opportunity Assessment (TAM–SAM–SOM Framework)
- 4.8. VDR Analyst Note
- 4.1. Porters Five Forces
- 5. Market Analysis, Insights and Forecast 2021-2033
- 5.1. Market Analysis, Insights and Forecast - by Type
- 5.1.1. Cloud Based
- 5.1.2. On Premise
- 5.2. Market Analysis, Insights and Forecast - by End Users
- 5.2.1. Oil and Gas
- 5.2.2. Power Utilities
- 5.2.3. Construction and Infrastructure
- 5.2.4. Telecommunication
- 5.2.5. Food and Beverages
- 5.2.6. Other End Users
- 5.3. Market Analysis, Insights and Forecast - by Region
- 5.3.1. North America
- 5.3.2. Europe
- 5.3.3. Asia Pacific
- 5.3.4. Middle East and Africa
- 5.3.5. South America
- 5.1. Market Analysis, Insights and Forecast - by Type
- 6. Global Carbon Accounting Market Analysis, Insights and Forecast, 2021-2033
- 6.1. Market Analysis, Insights and Forecast - by Type
- 6.1.1. Cloud Based
- 6.1.2. On Premise
- 6.2. Market Analysis, Insights and Forecast - by End Users
- 6.2.1. Oil and Gas
- 6.2.2. Power Utilities
- 6.2.3. Construction and Infrastructure
- 6.2.4. Telecommunication
- 6.2.5. Food and Beverages
- 6.2.6. Other End Users
- 6.1. Market Analysis, Insights and Forecast - by Type
- 7. North America Carbon Accounting Market Analysis, Insights and Forecast, 2021-2033
- 7.1. Market Analysis, Insights and Forecast - by Type
- 7.1.1. Cloud Based
- 7.1.2. On Premise
- 7.2. Market Analysis, Insights and Forecast - by End Users
- 7.2.1. Oil and Gas
- 7.2.2. Power Utilities
- 7.2.3. Construction and Infrastructure
- 7.2.4. Telecommunication
- 7.2.5. Food and Beverages
- 7.2.6. Other End Users
- 7.1. Market Analysis, Insights and Forecast - by Type
- 8. Europe Carbon Accounting Market Analysis, Insights and Forecast, 2021-2033
- 8.1. Market Analysis, Insights and Forecast - by Type
- 8.1.1. Cloud Based
- 8.1.2. On Premise
- 8.2. Market Analysis, Insights and Forecast - by End Users
- 8.2.1. Oil and Gas
- 8.2.2. Power Utilities
- 8.2.3. Construction and Infrastructure
- 8.2.4. Telecommunication
- 8.2.5. Food and Beverages
- 8.2.6. Other End Users
- 8.1. Market Analysis, Insights and Forecast - by Type
- 9. Asia Pacific Carbon Accounting Market Analysis, Insights and Forecast, 2021-2033
- 9.1. Market Analysis, Insights and Forecast - by Type
- 9.1.1. Cloud Based
- 9.1.2. On Premise
- 9.2. Market Analysis, Insights and Forecast - by End Users
- 9.2.1. Oil and Gas
- 9.2.2. Power Utilities
- 9.2.3. Construction and Infrastructure
- 9.2.4. Telecommunication
- 9.2.5. Food and Beverages
- 9.2.6. Other End Users
- 9.1. Market Analysis, Insights and Forecast - by Type
- 10. Middle East and Africa Carbon Accounting Market Analysis, Insights and Forecast, 2021-2033
- 10.1. Market Analysis, Insights and Forecast - by Type
- 10.1.1. Cloud Based
- 10.1.2. On Premise
- 10.2. Market Analysis, Insights and Forecast - by End Users
- 10.2.1. Oil and Gas
- 10.2.2. Power Utilities
- 10.2.3. Construction and Infrastructure
- 10.2.4. Telecommunication
- 10.2.5. Food and Beverages
- 10.2.6. Other End Users
- 10.1. Market Analysis, Insights and Forecast - by Type
- 11. South America Carbon Accounting Market Analysis, Insights and Forecast, 2021-2033
- 11.1. Market Analysis, Insights and Forecast - by Type
- 11.1.1. Cloud Based
- 11.1.2. On Premise
- 11.2. Market Analysis, Insights and Forecast - by End Users
- 11.2.1. Oil and Gas
- 11.2.2. Power Utilities
- 11.2.3. Construction and Infrastructure
- 11.2.4. Telecommunication
- 11.2.5. Food and Beverages
- 11.2.6. Other End Users
- 11.1. Market Analysis, Insights and Forecast - by Type
- 12. Competitive Analysis
- 12.1. Company Profiles
- 12.1.1 Normative
- 12.1.1.1. Company Overview
- 12.1.1.2. Products
- 12.1.1.3. Company Financials
- 12.1.1.4. SWOT Analysis
- 12.1.2 Carbon Direct
- 12.1.2.1. Company Overview
- 12.1.2.2. Products
- 12.1.2.3. Company Financials
- 12.1.2.4. SWOT Analysis
- 12.1.3 Greenly
- 12.1.3.1. Company Overview
- 12.1.3.2. Products
- 12.1.3.3. Company Financials
- 12.1.3.4. SWOT Analysis
- 12.1.4 ENGIE Impact
- 12.1.4.1. Company Overview
- 12.1.4.2. Products
- 12.1.4.3. Company Financials
- 12.1.4.4. SWOT Analysis
- 12.1.5 Sphera
- 12.1.5.1. Company Overview
- 12.1.5.2. Products
- 12.1.5.3. Company Financials
- 12.1.5.4. SWOT Analysis
- 12.1.6 SINAI Technologies
- 12.1.6.1. Company Overview
- 12.1.6.2. Products
- 12.1.6.3. Company Financials
- 12.1.6.4. SWOT Analysis
- 12.1.7 Persefoni AI
- 12.1.7.1. Company Overview
- 12.1.7.2. Products
- 12.1.7.3. Company Financials
- 12.1.7.4. SWOT Analysis
- 12.1.8 Emitwise
- 12.1.8.1. Company Overview
- 12.1.8.2. Products
- 12.1.8.3. Company Financials
- 12.1.8.4. SWOT Analysis
- 12.1.9 International Business Machines Corporation
- 12.1.9.1. Company Overview
- 12.1.9.2. Products
- 12.1.9.3. Company Financials
- 12.1.9.4. SWOT Analysis
- 12.1.10 Diligent Corporation
- 12.1.10.1. Company Overview
- 12.1.10.2. Products
- 12.1.10.3. Company Financials
- 12.1.10.4. SWOT Analysis
- 12.1.1 Normative
- 12.2. Market Entropy
- 12.2.1 Company's Key Areas Served
- 12.2.2 Recent Developments
- 12.3. Company Market Share Analysis 2025
- 12.3.1 Top 5 Companies Market Share Analysis
- 12.3.2 Top 3 Companies Market Share Analysis
- 12.4. List of Potential Customers
- 13. Research Methodology
List of Figures
- Figure 1: Global Carbon Accounting Market Revenue Breakdown (Million, %) by Region 2025 & 2033
- Figure 2: North America Carbon Accounting Market Revenue (Million), by Type 2025 & 2033
- Figure 3: North America Carbon Accounting Market Revenue Share (%), by Type 2025 & 2033
- Figure 4: North America Carbon Accounting Market Revenue (Million), by End Users 2025 & 2033
- Figure 5: North America Carbon Accounting Market Revenue Share (%), by End Users 2025 & 2033
- Figure 6: North America Carbon Accounting Market Revenue (Million), by Country 2025 & 2033
- Figure 7: North America Carbon Accounting Market Revenue Share (%), by Country 2025 & 2033
- Figure 8: Europe Carbon Accounting Market Revenue (Million), by Type 2025 & 2033
- Figure 9: Europe Carbon Accounting Market Revenue Share (%), by Type 2025 & 2033
- Figure 10: Europe Carbon Accounting Market Revenue (Million), by End Users 2025 & 2033
- Figure 11: Europe Carbon Accounting Market Revenue Share (%), by End Users 2025 & 2033
- Figure 12: Europe Carbon Accounting Market Revenue (Million), by Country 2025 & 2033
- Figure 13: Europe Carbon Accounting Market Revenue Share (%), by Country 2025 & 2033
- Figure 14: Asia Pacific Carbon Accounting Market Revenue (Million), by Type 2025 & 2033
- Figure 15: Asia Pacific Carbon Accounting Market Revenue Share (%), by Type 2025 & 2033
- Figure 16: Asia Pacific Carbon Accounting Market Revenue (Million), by End Users 2025 & 2033
- Figure 17: Asia Pacific Carbon Accounting Market Revenue Share (%), by End Users 2025 & 2033
- Figure 18: Asia Pacific Carbon Accounting Market Revenue (Million), by Country 2025 & 2033
- Figure 19: Asia Pacific Carbon Accounting Market Revenue Share (%), by Country 2025 & 2033
- Figure 20: Middle East and Africa Carbon Accounting Market Revenue (Million), by Type 2025 & 2033
- Figure 21: Middle East and Africa Carbon Accounting Market Revenue Share (%), by Type 2025 & 2033
- Figure 22: Middle East and Africa Carbon Accounting Market Revenue (Million), by End Users 2025 & 2033
- Figure 23: Middle East and Africa Carbon Accounting Market Revenue Share (%), by End Users 2025 & 2033
- Figure 24: Middle East and Africa Carbon Accounting Market Revenue (Million), by Country 2025 & 2033
- Figure 25: Middle East and Africa Carbon Accounting Market Revenue Share (%), by Country 2025 & 2033
- Figure 26: South America Carbon Accounting Market Revenue (Million), by Type 2025 & 2033
- Figure 27: South America Carbon Accounting Market Revenue Share (%), by Type 2025 & 2033
- Figure 28: South America Carbon Accounting Market Revenue (Million), by End Users 2025 & 2033
- Figure 29: South America Carbon Accounting Market Revenue Share (%), by End Users 2025 & 2033
- Figure 30: South America Carbon Accounting Market Revenue (Million), by Country 2025 & 2033
- Figure 31: South America Carbon Accounting Market Revenue Share (%), by Country 2025 & 2033
List of Tables
- Table 1: Global Carbon Accounting Market Revenue Million Forecast, by Type 2020 & 2033
- Table 2: Global Carbon Accounting Market Revenue Million Forecast, by End Users 2020 & 2033
- Table 3: Global Carbon Accounting Market Revenue Million Forecast, by Region 2020 & 2033
- Table 4: Global Carbon Accounting Market Revenue Million Forecast, by Type 2020 & 2033
- Table 5: Global Carbon Accounting Market Revenue Million Forecast, by End Users 2020 & 2033
- Table 6: Global Carbon Accounting Market Revenue Million Forecast, by Country 2020 & 2033
- Table 7: United States Carbon Accounting Market Revenue (Million) Forecast, by Application 2020 & 2033
- Table 8: Canada Carbon Accounting Market Revenue (Million) Forecast, by Application 2020 & 2033
- Table 9: Rest of North America Carbon Accounting Market Revenue (Million) Forecast, by Application 2020 & 2033
- Table 10: Global Carbon Accounting Market Revenue Million Forecast, by Type 2020 & 2033
- Table 11: Global Carbon Accounting Market Revenue Million Forecast, by End Users 2020 & 2033
- Table 12: Global Carbon Accounting Market Revenue Million Forecast, by Country 2020 & 2033
- Table 13: Germany Carbon Accounting Market Revenue (Million) Forecast, by Application 2020 & 2033
- Table 14: France Carbon Accounting Market Revenue (Million) Forecast, by Application 2020 & 2033
- Table 15: United Kingdom Carbon Accounting Market Revenue (Million) Forecast, by Application 2020 & 2033
- Table 16: Italy Carbon Accounting Market Revenue (Million) Forecast, by Application 2020 & 2033
- Table 17: Spain Carbon Accounting Market Revenue (Million) Forecast, by Application 2020 & 2033
- Table 18: NORDIC Carbon Accounting Market Revenue (Million) Forecast, by Application 2020 & 2033
- Table 19: Russia Carbon Accounting Market Revenue (Million) Forecast, by Application 2020 & 2033
- Table 20: Turkey Carbon Accounting Market Revenue (Million) Forecast, by Application 2020 & 2033
- Table 21: Rest of Europe Carbon Accounting Market Revenue (Million) Forecast, by Application 2020 & 2033
- Table 22: Global Carbon Accounting Market Revenue Million Forecast, by Type 2020 & 2033
- Table 23: Global Carbon Accounting Market Revenue Million Forecast, by End Users 2020 & 2033
- Table 24: Global Carbon Accounting Market Revenue Million Forecast, by Country 2020 & 2033
- Table 25: China Carbon Accounting Market Revenue (Million) Forecast, by Application 2020 & 2033
- Table 26: India Carbon Accounting Market Revenue (Million) Forecast, by Application 2020 & 2033
- Table 27: Australia Carbon Accounting Market Revenue (Million) Forecast, by Application 2020 & 2033
- Table 28: Japan Carbon Accounting Market Revenue (Million) Forecast, by Application 2020 & 2033
- Table 29: South Korea Carbon Accounting Market Revenue (Million) Forecast, by Application 2020 & 2033
- Table 30: Malaysia Carbon Accounting Market Revenue (Million) Forecast, by Application 2020 & 2033
- Table 31: Thailand Carbon Accounting Market Revenue (Million) Forecast, by Application 2020 & 2033
- Table 32: Indonesia Carbon Accounting Market Revenue (Million) Forecast, by Application 2020 & 2033
- Table 33: Vietnam Carbon Accounting Market Revenue (Million) Forecast, by Application 2020 & 2033
- Table 34: Rest of Asia Pacific Carbon Accounting Market Revenue (Million) Forecast, by Application 2020 & 2033
- Table 35: Global Carbon Accounting Market Revenue Million Forecast, by Type 2020 & 2033
- Table 36: Global Carbon Accounting Market Revenue Million Forecast, by End Users 2020 & 2033
- Table 37: Global Carbon Accounting Market Revenue Million Forecast, by Country 2020 & 2033
- Table 38: Saudi Arabia Carbon Accounting Market Revenue (Million) Forecast, by Application 2020 & 2033
- Table 39: United Arab Emirates Carbon Accounting Market Revenue (Million) Forecast, by Application 2020 & 2033
- Table 40: Nigeria Carbon Accounting Market Revenue (Million) Forecast, by Application 2020 & 2033
- Table 41: Egypt Carbon Accounting Market Revenue (Million) Forecast, by Application 2020 & 2033
- Table 42: Qatar Carbon Accounting Market Revenue (Million) Forecast, by Application 2020 & 2033
- Table 43: South Africa Carbon Accounting Market Revenue (Million) Forecast, by Application 2020 & 2033
- Table 44: Rest of Middle East and Africa Carbon Accounting Market Revenue (Million) Forecast, by Application 2020 & 2033
- Table 45: Global Carbon Accounting Market Revenue Million Forecast, by Type 2020 & 2033
- Table 46: Global Carbon Accounting Market Revenue Million Forecast, by End Users 2020 & 2033
- Table 47: Global Carbon Accounting Market Revenue Million Forecast, by Country 2020 & 2033
- Table 48: Brazil Carbon Accounting Market Revenue (Million) Forecast, by Application 2020 & 2033
- Table 49: Argentina Carbon Accounting Market Revenue (Million) Forecast, by Application 2020 & 2033
- Table 50: Colombia Carbon Accounting Market Revenue (Million) Forecast, by Application 2020 & 2033
- Table 51: Rest of South America Carbon Accounting Market Revenue (Million) Forecast, by Application 2020 & 2033
Frequently Asked Questions
1. What is the projected Compound Annual Growth Rate (CAGR) of the Carbon Accounting Market?
The projected CAGR is approximately 29.33%.
2. Which companies are prominent players in the Carbon Accounting Market?
Key companies in the market include Normative, Carbon Direct, Greenly, ENGIE Impact, Sphera, SINAI Technologies, Persefoni AI, Emitwise, International Business Machines Corporation, Diligent Corporation.
3. What are the main segments of the Carbon Accounting Market?
The market segments include Type, End Users.
4. Can you provide details about the market size?
The market size is estimated to be USD 16.98 Million as of 2022.
5. What are some drivers contributing to market growth?
4.; Corporate Sustainability Goals4.; Stringent Regultions and Compliance.
6. What are the notable trends driving market growth?
The Power Utilities Segment to Witness Significant Growth.
7. Are there any restraints impacting market growth?
4.; High Complexity in Carbon Accounting.
8. Can you provide examples of recent developments in the market?
March 2024: Greenly, a significant carbon accounting startup, announced that it secured funding for its series B round. The company raised USD 52 million in its Series B round. Investors aim to develop more precise carbon accounting methodologies and accurately deploy these solutions to increase the company’s market share globally.
9. What pricing options are available for accessing the report?
Pricing options include single-user, multi-user, and enterprise licenses priced at USD 4750, USD 5250, and USD 8750 respectively.
10. Is the market size provided in terms of value or volume?
The market size is provided in terms of value, measured in Million.
11. Are there any specific market keywords associated with the report?
Yes, the market keyword associated with the report is "Carbon Accounting Market," which aids in identifying and referencing the specific market segment covered.
12. How do I determine which pricing option suits my needs best?
The pricing options vary based on user requirements and access needs. Individual users may opt for single-user licenses, while businesses requiring broader access may choose multi-user or enterprise licenses for cost-effective access to the report.
13. Are there any additional resources or data provided in the Carbon Accounting Market report?
While the report offers comprehensive insights, it's advisable to review the specific contents or supplementary materials provided to ascertain if additional resources or data are available.
14. How can I stay updated on further developments or reports in the Carbon Accounting Market?
To stay informed about further developments, trends, and reports in the Carbon Accounting Market, consider subscribing to industry newsletters, following relevant companies and organizations, or regularly checking reputable industry news sources and publications.
Methodology
Step 1 - Identification of Relevant Samples Size from Population Database


Step 2 - Approaches for Defining Global Market Size (Value, Volume* & Price*)

Note*: In applicable scenarios
Step 3 - Data Sources
Primary Research
- Web Analytics
- Survey Reports
- Research Institute
- Latest Research Reports
- Opinion Leaders
Secondary Research
- Annual Reports
- White Paper
- Latest Press Release
- Industry Association
- Paid Database
- Investor Presentations

Step 4 - Data Triangulation
Involves using different sources of information in order to increase the validity of a study
These sources are likely to be stakeholders in a program - participants, other researchers, program staff, other community members, and so on.
Then we put all data in single framework & apply various statistical tools to find out the dynamic on the market.
During the analysis stage, feedback from the stakeholder groups would be compared to determine areas of agreement as well as areas of divergence