

Key Insights
The global car rental market within the tourism sector is poised for substantial expansion. Projected to reach $129.66 billion by 2033, the market is anticipated to grow at a Compound Annual Growth Rate (CAGR) of 9.77% from the base year 2024. Key growth drivers include the increasing popularity of self-drive vacations, a growing middle class with enhanced disposable income, and the widespread adoption of online booking platforms offering convenience and competitive pricing. Strategic alliances between rental companies and tourism operators further propel market growth through integrated travel packages. The Asia-Pacific region demonstrates notable expansion, fueled by robust economic development and heightened tourism in China and India. While the luxury segment shows strong performance, the economy segment continues to lead due to its affordability. The digital shift towards online bookings reflects evolving consumer preferences for control and transparency. However, market dynamics are influenced by fluctuating fuel prices, economic downturns, and intensified competition.
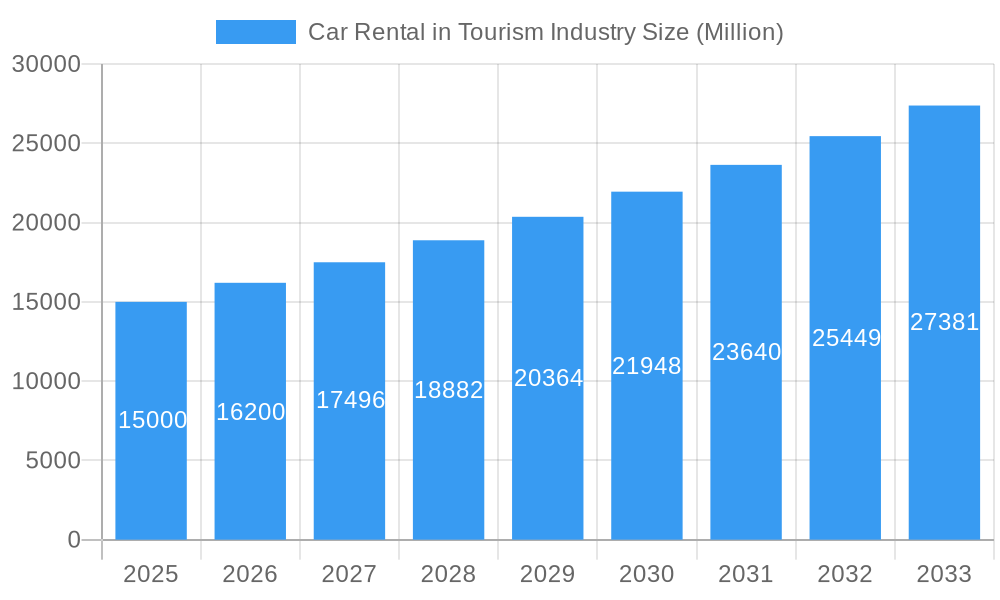
Car Rental in Tourism Industry Market Size (In Billion)
Future growth in the car rental market is contingent on technological innovation, including mobile booking applications and advanced fleet management systems, which enhance customer experience and operational efficiency. Sustainability initiatives, such as the integration of electric and hybrid vehicles, are expected to appeal to environmentally conscious travelers and respond to increasing environmental awareness. The sustained expansion of global tourism and the rising trend of experiential travel present significant opportunities. Companies must strategically address geopolitical uncertainties, potential economic slowdowns, and currency fluctuations. Success in this dynamic market will depend on strategic partnerships, customer-centric service delivery, technological innovation, and sustainable practices.
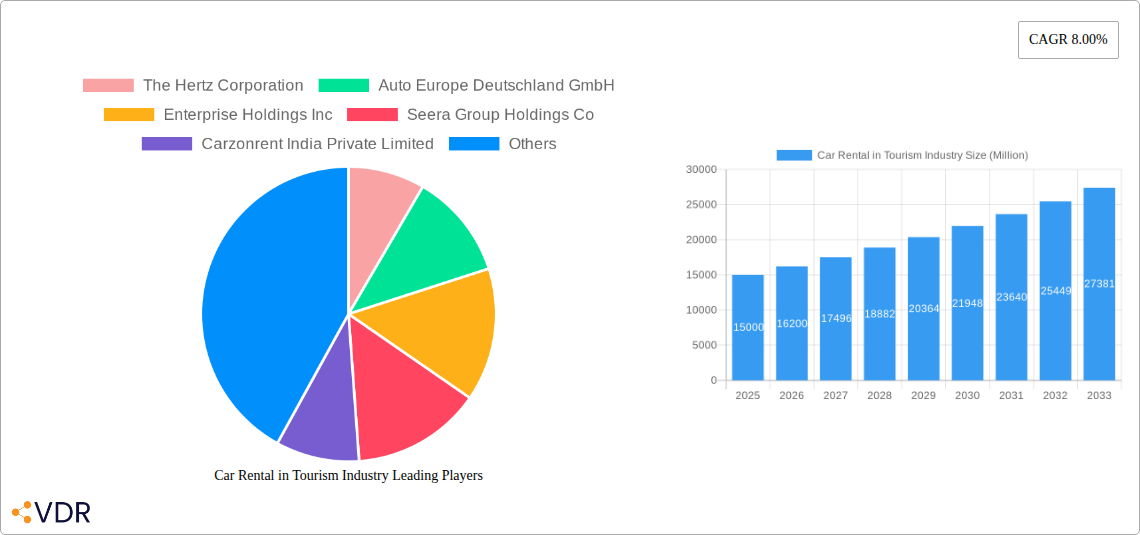
Car Rental in Tourism Industry Company Market Share
Car Rental in Tourism Industry: Market Report 2019-2033
This comprehensive report provides a detailed analysis of the car rental market within the tourism industry, covering the period 2019-2033. It examines market dynamics, growth trends, key players, and future opportunities, offering valuable insights for industry professionals, investors, and strategic decision-makers. The report leverages extensive data analysis to provide a precise forecast of market size, segmented by vehicle type (economy, luxury/premium), booking mode (online, offline), and end-user (self-driven, rental agencies). This in-depth analysis covers parent markets like global transportation and mobility and the child market segment of tourism-related car rentals. The market is valued in Million units.
Car Rental in Tourism Industry Market Dynamics & Structure
The global car rental market within the tourism sector is a dynamic landscape shaped by various factors. Market concentration is moderate, with a few major players like Hertz, Enterprise, and Avis Budget Group holding significant shares, but a multitude of regional and specialized operators also contributing significantly. Technological innovation, primarily through mobile apps, online booking platforms, and automated processes, is a key driver. Stringent regulatory frameworks concerning licensing, insurance, and environmental standards impact operations. Competitive substitutes include ride-sharing services and public transportation, influencing market share dynamics.
- Market Concentration: Moderately concentrated, with top 5 players holding approximately xx% market share in 2024.
- Technological Innovation: Focus on mobile apps, online booking, and automated check-in/check-out processes.
- Regulatory Framework: Varying regulations across countries impact operations and costs.
- Competitive Substitutes: Ride-sharing services and public transport pose a competitive threat.
- End-User Demographics: Shifting towards younger, tech-savvy travelers, impacting booking preferences.
- M&A Trends: Increased consolidation through acquisitions and mergers, exemplified by Volkswagen's acquisition of Europcar (USD 3.4 billion in 2021). The total M&A deal volume for the historical period (2019-2024) was approximately xx Million USD.
Car Rental in Tourism Industry Growth Trends & Insights
The car rental market within the tourism industry experienced significant growth during the historical period (2019-2024), followed by a period of recovery in 2025. This growth is driven by factors such as increasing tourist numbers, rising disposable incomes, and the convenience offered by car rentals, particularly for exploring diverse destinations. However, the adoption rates have been impacted by factors like the COVID-19 pandemic and fluctuations in fuel prices. Technological disruptions like the rise of ride-sharing apps caused a slight deceleration in growth. Nevertheless, consumer behavior continues to favor self-drive options for flexibility. The market is projected to exhibit a CAGR of xx% from 2025 to 2033, reaching a projected market size of xx Million units by 2033. Market penetration, particularly in emerging tourism markets, is expected to increase significantly.
Dominant Regions, Countries, or Segments in Car Rental in Tourism Industry
North America and Europe currently dominate the car rental market within the tourism sector, driven by well-established tourism infrastructure and high tourist volumes. However, Asia-Pacific is experiencing rapid growth, fueled by rising middle-class disposable incomes and growing tourism activity.
- Vehicle Type: The economy segment holds the largest market share, followed by the luxury/premium segment showing significant growth potential.
- Booking Mode: Online booking is the fastest-growing segment, boosted by user-friendly mobile applications.
- End-User: The self-driven segment is dominant, reflecting the increasing preference for personalized travel experiences.
Key Drivers:
- Strong Tourism Infrastructure: Well-developed transportation networks and tourist destinations.
- Economic Growth: Increased disposable incomes driving travel and leisure spending.
- Government Policies: Supportive policies promoting tourism and transportation development.
Car Rental in Tourism Industry Product Landscape
The car rental market features a wide range of vehicles, from economical models to luxury options. Technological advancements are focused on improving the booking experience through mobile apps, integrating GPS navigation, and offering various add-on services such as insurance packages and roadside assistance. Key selling propositions include convenience, flexibility, and a wide selection of vehicles catering to different needs and budgets. Innovations like keyless entry systems and digital documentation are enhancing the customer experience.
Key Drivers, Barriers & Challenges in Car Rental in Tourism Industry
Key Drivers:
- Growing tourism sector
- Increasing disposable incomes
- Technological advancements in booking and management systems
Challenges:
- Intense competition from ride-sharing services.
- Fluctuating fuel prices.
- Regulatory compliance and licensing requirements.
- Supply chain disruptions impacting vehicle availability. (Quantifiable impact: xx% reduction in fleet availability during peak seasons in 2023)
Emerging Opportunities in Car Rental in Tourism Industry
- Expansion into emerging tourism markets with untapped potential.
- Development of specialized rental services catering to niche segments (e.g., electric vehicles, luxury SUVs).
- Implementation of innovative pricing strategies and subscription models (as seen with ekar).
- Personalized travel planning and integrated services (e.g., bundled tours and activities).
Growth Accelerators in the Car Rental in Tourism Industry Industry
Strategic partnerships with hotels, airlines, and travel agencies can significantly boost market growth. Technological innovations like AI-powered chatbots for customer service and predictive maintenance for optimizing fleet management are key. Expanding into new geographical regions and offering tailored solutions to specific tourism segments are vital for long-term growth.
Key Players Shaping the Car Rental in Tourism Industry Market
- The Hertz Corporation
- Auto Europe Deutschland GmbH
- Enterprise Holdings Inc
- Seera Group Holdings Co
- Carzonrent India Private Limited
- Sixt SE
- ZoomCar Inc
- Europcar Mobility Group
- Avis Budget Group Inc
Notable Milestones in Car Rental in Tourism Industry Sector
- February 2021: Theeb Rent a Car expands its fleet in Saudi Arabia, adding 1,700 vehicles.
- July 2021: Europcar's Key'n Go launches a fully digital car rental solution in Southern Europe.
- November 2021: Hertz partners with Tesla to acquire 100,000 Model 3s.
- December 2021: Volkswagen acquires Europcar for USD 3.4 billion.
- January 2022: ekar launches car subscription service in Thailand.
In-Depth Car Rental in Tourism Industry Market Outlook
The car rental market in the tourism industry is poised for significant growth over the forecast period (2025-2033). Technological advancements, strategic partnerships, and expansion into new markets will drive this growth. The increasing adoption of online booking platforms, coupled with innovative subscription models and the rise of sustainable and eco-friendly vehicles, present lucrative opportunities for market players. The focus will shift towards personalized travel experiences, requiring service providers to adapt to changing consumer expectations. The market potential is substantial, especially in emerging economies with rapidly expanding tourism sectors.
Car Rental in Tourism Industry Segmentation
-
1. Vehicle Type
- 1.1. Economy
- 1.2. Luxury/Premium
-
2. Booking Mode
- 2.1. Online
- 2.2. Offline
-
3. End User
- 3.1. Self Driven
- 3.2. Rental Agencies
Car Rental in Tourism Industry Segmentation By Geography
-
1. North America
- 1.1. United states
- 1.2. Canada
- 1.3. Rest of North america
-
2. Europe
- 2.1. Germany
- 2.2. United Kingdom
- 2.3. France
- 2.4. Italy
- 2.5. Norway
- 2.6. Netherlands
- 2.7. Rest of Europe
-
3. Asia Pacific
- 3.1. China
- 3.2. India
- 3.3. Japan
- 3.4. South Korea
- 3.5. Rest of Asia Pacific
-
4. Rest of the World
- 4.1. South America
- 4.2. Middle East and Africa
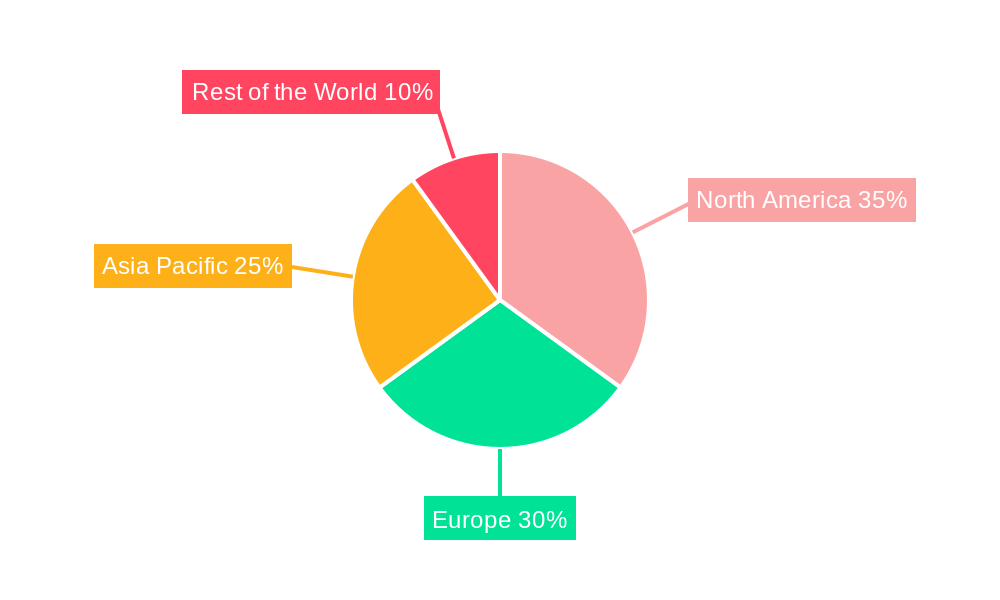
Car Rental in Tourism Industry Regional Market Share
Geographic Coverage of Car Rental in Tourism Industry
Car Rental in Tourism Industry REPORT HIGHLIGHTS
| Aspects | Details |
|---|---|
| Study Period | 2020-2034 |
| Base Year | 2025 |
| Estimated Year | 2026 |
| Forecast Period | 2026-2034 |
| Historical Period | 2020-2025 |
| Growth Rate | CAGR of 9.77% from 2020-2034 |
| Segmentation |
|
Table of Contents
- 1. Introduction
- 1.1. Research Scope
- 1.2. Market Segmentation
- 1.3. Research Objective
- 1.4. Definitions and Assumptions
- 2. Executive Summary
- 2.1. Market Snapshot
- 3. Market Dynamics
- 3.1. Market Drivers
- 3.2. Market Restrains
- 3.3. Market Trends
- 3.4. Market Opportunities
- 4. Market Factor Analysis
- 4.1. Porters Five Forces
- 4.1.1. Bargaining Power of Suppliers
- 4.1.2. Bargaining Power of Buyers
- 4.1.3. Threat of New Entrants
- 4.1.4. Threat of Substitutes
- 4.1.5. Competitive Rivalry
- 4.2. PESTEL analysis
- 4.3. BCG Analysis
- 4.3.1. Stars (High Growth, High Market Share)
- 4.3.2. Cash Cows (Low Growth, High Market Share)
- 4.3.3. Question Mark (High Growth, Low Market Share)
- 4.3.4. Dogs (Low Growth, Low Market Share)
- 4.4. Ansoff Matrix Analysis
- 4.5. Supply Chain Analysis
- 4.6. Regulatory Landscape
- 4.7. Current Market Potential and Opportunity Assessment (TAM–SAM–SOM Framework)
- 4.8. VDR Analyst Note
- 4.1. Porters Five Forces
- 5. Market Analysis, Insights and Forecast 2021-2033
- 5.1. Market Analysis, Insights and Forecast - by Vehicle Type
- 5.1.1. Economy
- 5.1.2. Luxury/Premium
- 5.2. Market Analysis, Insights and Forecast - by Booking Mode
- 5.2.1. Online
- 5.2.2. Offline
- 5.3. Market Analysis, Insights and Forecast - by End User
- 5.3.1. Self Driven
- 5.3.2. Rental Agencies
- 5.4. Market Analysis, Insights and Forecast - by Region
- 5.4.1. North America
- 5.4.2. Europe
- 5.4.3. Asia Pacific
- 5.4.4. Rest of the World
- 5.1. Market Analysis, Insights and Forecast - by Vehicle Type
- 6. Global Car Rental in Tourism Industry Analysis, Insights and Forecast, 2021-2033
- 6.1. Market Analysis, Insights and Forecast - by Vehicle Type
- 6.1.1. Economy
- 6.1.2. Luxury/Premium
- 6.2. Market Analysis, Insights and Forecast - by Booking Mode
- 6.2.1. Online
- 6.2.2. Offline
- 6.3. Market Analysis, Insights and Forecast - by End User
- 6.3.1. Self Driven
- 6.3.2. Rental Agencies
- 6.1. Market Analysis, Insights and Forecast - by Vehicle Type
- 7. North America Car Rental in Tourism Industry Analysis, Insights and Forecast, 2021-2033
- 7.1. Market Analysis, Insights and Forecast - by Vehicle Type
- 7.1.1. Economy
- 7.1.2. Luxury/Premium
- 7.2. Market Analysis, Insights and Forecast - by Booking Mode
- 7.2.1. Online
- 7.2.2. Offline
- 7.3. Market Analysis, Insights and Forecast - by End User
- 7.3.1. Self Driven
- 7.3.2. Rental Agencies
- 7.1. Market Analysis, Insights and Forecast - by Vehicle Type
- 8. Europe Car Rental in Tourism Industry Analysis, Insights and Forecast, 2021-2033
- 8.1. Market Analysis, Insights and Forecast - by Vehicle Type
- 8.1.1. Economy
- 8.1.2. Luxury/Premium
- 8.2. Market Analysis, Insights and Forecast - by Booking Mode
- 8.2.1. Online
- 8.2.2. Offline
- 8.3. Market Analysis, Insights and Forecast - by End User
- 8.3.1. Self Driven
- 8.3.2. Rental Agencies
- 8.1. Market Analysis, Insights and Forecast - by Vehicle Type
- 9. Asia Pacific Car Rental in Tourism Industry Analysis, Insights and Forecast, 2021-2033
- 9.1. Market Analysis, Insights and Forecast - by Vehicle Type
- 9.1.1. Economy
- 9.1.2. Luxury/Premium
- 9.2. Market Analysis, Insights and Forecast - by Booking Mode
- 9.2.1. Online
- 9.2.2. Offline
- 9.3. Market Analysis, Insights and Forecast - by End User
- 9.3.1. Self Driven
- 9.3.2. Rental Agencies
- 9.1. Market Analysis, Insights and Forecast - by Vehicle Type
- 10. Rest of the World Car Rental in Tourism Industry Analysis, Insights and Forecast, 2021-2033
- 10.1. Market Analysis, Insights and Forecast - by Vehicle Type
- 10.1.1. Economy
- 10.1.2. Luxury/Premium
- 10.2. Market Analysis, Insights and Forecast - by Booking Mode
- 10.2.1. Online
- 10.2.2. Offline
- 10.3. Market Analysis, Insights and Forecast - by End User
- 10.3.1. Self Driven
- 10.3.2. Rental Agencies
- 10.1. Market Analysis, Insights and Forecast - by Vehicle Type
- 11. Competitive Analysis
- 11.1. Company Profiles
- 11.1.1 The Hertz Corporation
- 11.1.1.1. Company Overview
- 11.1.1.2. Products
- 11.1.1.3. Company Financials
- 11.1.1.4. SWOT Analysis
- 11.1.2 Auto Europe Deutschland GmbH
- 11.1.2.1. Company Overview
- 11.1.2.2. Products
- 11.1.2.3. Company Financials
- 11.1.2.4. SWOT Analysis
- 11.1.3 Enterprise Holdings Inc
- 11.1.3.1. Company Overview
- 11.1.3.2. Products
- 11.1.3.3. Company Financials
- 11.1.3.4. SWOT Analysis
- 11.1.4 Seera Group Holdings Co
- 11.1.4.1. Company Overview
- 11.1.4.2. Products
- 11.1.4.3. Company Financials
- 11.1.4.4. SWOT Analysis
- 11.1.5 Carzonrent India Private Limited
- 11.1.5.1. Company Overview
- 11.1.5.2. Products
- 11.1.5.3. Company Financials
- 11.1.5.4. SWOT Analysis
- 11.1.6 Sixt SE
- 11.1.6.1. Company Overview
- 11.1.6.2. Products
- 11.1.6.3. Company Financials
- 11.1.6.4. SWOT Analysis
- 11.1.7 ZoomCar Inc
- 11.1.7.1. Company Overview
- 11.1.7.2. Products
- 11.1.7.3. Company Financials
- 11.1.7.4. SWOT Analysis
- 11.1.8 Europcar Mobility Group
- 11.1.8.1. Company Overview
- 11.1.8.2. Products
- 11.1.8.3. Company Financials
- 11.1.8.4. SWOT Analysis
- 11.1.9 Avis Budget Group Inc
- 11.1.9.1. Company Overview
- 11.1.9.2. Products
- 11.1.9.3. Company Financials
- 11.1.9.4. SWOT Analysis
- 11.1.1 The Hertz Corporation
- 11.2. Market Entropy
- 11.2.1 Company's Key Areas Served
- 11.2.2 Recent Developments
- 11.3. Company Market Share Analysis 2025
- 11.3.1 Top 5 Companies Market Share Analysis
- 11.3.2 Top 3 Companies Market Share Analysis
- 11.4. List of Potential Customers
- 12. Research Methodology
List of Figures
- Figure 1: Global Car Rental in Tourism Industry Revenue Breakdown (billion, %) by Region 2025 & 2033
- Figure 2: North America Car Rental in Tourism Industry Revenue (billion), by Vehicle Type 2025 & 2033
- Figure 3: North America Car Rental in Tourism Industry Revenue Share (%), by Vehicle Type 2025 & 2033
- Figure 4: North America Car Rental in Tourism Industry Revenue (billion), by Booking Mode 2025 & 2033
- Figure 5: North America Car Rental in Tourism Industry Revenue Share (%), by Booking Mode 2025 & 2033
- Figure 6: North America Car Rental in Tourism Industry Revenue (billion), by End User 2025 & 2033
- Figure 7: North America Car Rental in Tourism Industry Revenue Share (%), by End User 2025 & 2033
- Figure 8: North America Car Rental in Tourism Industry Revenue (billion), by Country 2025 & 2033
- Figure 9: North America Car Rental in Tourism Industry Revenue Share (%), by Country 2025 & 2033
- Figure 10: Europe Car Rental in Tourism Industry Revenue (billion), by Vehicle Type 2025 & 2033
- Figure 11: Europe Car Rental in Tourism Industry Revenue Share (%), by Vehicle Type 2025 & 2033
- Figure 12: Europe Car Rental in Tourism Industry Revenue (billion), by Booking Mode 2025 & 2033
- Figure 13: Europe Car Rental in Tourism Industry Revenue Share (%), by Booking Mode 2025 & 2033
- Figure 14: Europe Car Rental in Tourism Industry Revenue (billion), by End User 2025 & 2033
- Figure 15: Europe Car Rental in Tourism Industry Revenue Share (%), by End User 2025 & 2033
- Figure 16: Europe Car Rental in Tourism Industry Revenue (billion), by Country 2025 & 2033
- Figure 17: Europe Car Rental in Tourism Industry Revenue Share (%), by Country 2025 & 2033
- Figure 18: Asia Pacific Car Rental in Tourism Industry Revenue (billion), by Vehicle Type 2025 & 2033
- Figure 19: Asia Pacific Car Rental in Tourism Industry Revenue Share (%), by Vehicle Type 2025 & 2033
- Figure 20: Asia Pacific Car Rental in Tourism Industry Revenue (billion), by Booking Mode 2025 & 2033
- Figure 21: Asia Pacific Car Rental in Tourism Industry Revenue Share (%), by Booking Mode 2025 & 2033
- Figure 22: Asia Pacific Car Rental in Tourism Industry Revenue (billion), by End User 2025 & 2033
- Figure 23: Asia Pacific Car Rental in Tourism Industry Revenue Share (%), by End User 2025 & 2033
- Figure 24: Asia Pacific Car Rental in Tourism Industry Revenue (billion), by Country 2025 & 2033
- Figure 25: Asia Pacific Car Rental in Tourism Industry Revenue Share (%), by Country 2025 & 2033
- Figure 26: Rest of the World Car Rental in Tourism Industry Revenue (billion), by Vehicle Type 2025 & 2033
- Figure 27: Rest of the World Car Rental in Tourism Industry Revenue Share (%), by Vehicle Type 2025 & 2033
- Figure 28: Rest of the World Car Rental in Tourism Industry Revenue (billion), by Booking Mode 2025 & 2033
- Figure 29: Rest of the World Car Rental in Tourism Industry Revenue Share (%), by Booking Mode 2025 & 2033
- Figure 30: Rest of the World Car Rental in Tourism Industry Revenue (billion), by End User 2025 & 2033
- Figure 31: Rest of the World Car Rental in Tourism Industry Revenue Share (%), by End User 2025 & 2033
- Figure 32: Rest of the World Car Rental in Tourism Industry Revenue (billion), by Country 2025 & 2033
- Figure 33: Rest of the World Car Rental in Tourism Industry Revenue Share (%), by Country 2025 & 2033
List of Tables
- Table 1: Global Car Rental in Tourism Industry Revenue billion Forecast, by Vehicle Type 2020 & 2033
- Table 2: Global Car Rental in Tourism Industry Revenue billion Forecast, by Booking Mode 2020 & 2033
- Table 3: Global Car Rental in Tourism Industry Revenue billion Forecast, by End User 2020 & 2033
- Table 4: Global Car Rental in Tourism Industry Revenue billion Forecast, by Region 2020 & 2033
- Table 5: Global Car Rental in Tourism Industry Revenue billion Forecast, by Vehicle Type 2020 & 2033
- Table 6: Global Car Rental in Tourism Industry Revenue billion Forecast, by Booking Mode 2020 & 2033
- Table 7: Global Car Rental in Tourism Industry Revenue billion Forecast, by End User 2020 & 2033
- Table 8: Global Car Rental in Tourism Industry Revenue billion Forecast, by Country 2020 & 2033
- Table 9: United states Car Rental in Tourism Industry Revenue (billion) Forecast, by Application 2020 & 2033
- Table 10: Canada Car Rental in Tourism Industry Revenue (billion) Forecast, by Application 2020 & 2033
- Table 11: Rest of North america Car Rental in Tourism Industry Revenue (billion) Forecast, by Application 2020 & 2033
- Table 12: Global Car Rental in Tourism Industry Revenue billion Forecast, by Vehicle Type 2020 & 2033
- Table 13: Global Car Rental in Tourism Industry Revenue billion Forecast, by Booking Mode 2020 & 2033
- Table 14: Global Car Rental in Tourism Industry Revenue billion Forecast, by End User 2020 & 2033
- Table 15: Global Car Rental in Tourism Industry Revenue billion Forecast, by Country 2020 & 2033
- Table 16: Germany Car Rental in Tourism Industry Revenue (billion) Forecast, by Application 2020 & 2033
- Table 17: United Kingdom Car Rental in Tourism Industry Revenue (billion) Forecast, by Application 2020 & 2033
- Table 18: France Car Rental in Tourism Industry Revenue (billion) Forecast, by Application 2020 & 2033
- Table 19: Italy Car Rental in Tourism Industry Revenue (billion) Forecast, by Application 2020 & 2033
- Table 20: Norway Car Rental in Tourism Industry Revenue (billion) Forecast, by Application 2020 & 2033
- Table 21: Netherlands Car Rental in Tourism Industry Revenue (billion) Forecast, by Application 2020 & 2033
- Table 22: Rest of Europe Car Rental in Tourism Industry Revenue (billion) Forecast, by Application 2020 & 2033
- Table 23: Global Car Rental in Tourism Industry Revenue billion Forecast, by Vehicle Type 2020 & 2033
- Table 24: Global Car Rental in Tourism Industry Revenue billion Forecast, by Booking Mode 2020 & 2033
- Table 25: Global Car Rental in Tourism Industry Revenue billion Forecast, by End User 2020 & 2033
- Table 26: Global Car Rental in Tourism Industry Revenue billion Forecast, by Country 2020 & 2033
- Table 27: China Car Rental in Tourism Industry Revenue (billion) Forecast, by Application 2020 & 2033
- Table 28: India Car Rental in Tourism Industry Revenue (billion) Forecast, by Application 2020 & 2033
- Table 29: Japan Car Rental in Tourism Industry Revenue (billion) Forecast, by Application 2020 & 2033
- Table 30: South Korea Car Rental in Tourism Industry Revenue (billion) Forecast, by Application 2020 & 2033
- Table 31: Rest of Asia Pacific Car Rental in Tourism Industry Revenue (billion) Forecast, by Application 2020 & 2033
- Table 32: Global Car Rental in Tourism Industry Revenue billion Forecast, by Vehicle Type 2020 & 2033
- Table 33: Global Car Rental in Tourism Industry Revenue billion Forecast, by Booking Mode 2020 & 2033
- Table 34: Global Car Rental in Tourism Industry Revenue billion Forecast, by End User 2020 & 2033
- Table 35: Global Car Rental in Tourism Industry Revenue billion Forecast, by Country 2020 & 2033
- Table 36: South America Car Rental in Tourism Industry Revenue (billion) Forecast, by Application 2020 & 2033
- Table 37: Middle East and Africa Car Rental in Tourism Industry Revenue (billion) Forecast, by Application 2020 & 2033
Frequently Asked Questions
1. What is the projected Compound Annual Growth Rate (CAGR) of the Car Rental in Tourism Industry?
The projected CAGR is approximately 9.77%.
2. Which companies are prominent players in the Car Rental in Tourism Industry?
Key companies in the market include The Hertz Corporation, Auto Europe Deutschland GmbH, Enterprise Holdings Inc, Seera Group Holdings Co, Carzonrent India Private Limited, Sixt SE, ZoomCar Inc, Europcar Mobility Group, Avis Budget Group Inc.
3. What are the main segments of the Car Rental in Tourism Industry?
The market segments include Vehicle Type, Booking Mode, End User.
4. Can you provide details about the market size?
The market size is estimated to be USD 129.66 billion as of 2022.
5. What are some drivers contributing to market growth?
Growing Use of Aluminum in Die Casting Equipment to Increase Market Demand.
6. What are the notable trends driving market growth?
Online Booking Expected to Witness Significant Growth during the Forecast Period.
7. Are there any restraints impacting market growth?
Fluctuations in Raw Material Prices.
8. Can you provide examples of recent developments in the market?
In January 2022, ekar, the Middle East's mobility company, launched its operations in Thailand starting with Bangkok and with plans to expand into other countries. ekar is launching its proprietary car subscription service which offers cars from one to nine-month terms for a single monthly subscription cost with no down payments or long-term commitments via the ekar app.
9. What pricing options are available for accessing the report?
Pricing options include single-user, multi-user, and enterprise licenses priced at USD 4750, USD 5250, and USD 8750 respectively.
10. Is the market size provided in terms of value or volume?
The market size is provided in terms of value, measured in billion.
11. Are there any specific market keywords associated with the report?
Yes, the market keyword associated with the report is "Car Rental in Tourism Industry," which aids in identifying and referencing the specific market segment covered.
12. How do I determine which pricing option suits my needs best?
The pricing options vary based on user requirements and access needs. Individual users may opt for single-user licenses, while businesses requiring broader access may choose multi-user or enterprise licenses for cost-effective access to the report.
13. Are there any additional resources or data provided in the Car Rental in Tourism Industry report?
While the report offers comprehensive insights, it's advisable to review the specific contents or supplementary materials provided to ascertain if additional resources or data are available.
14. How can I stay updated on further developments or reports in the Car Rental in Tourism Industry?
To stay informed about further developments, trends, and reports in the Car Rental in Tourism Industry, consider subscribing to industry newsletters, following relevant companies and organizations, or regularly checking reputable industry news sources and publications.
Methodology
Step 1 - Identification of Relevant Samples Size from Population Database


Step 2 - Approaches for Defining Global Market Size (Value, Volume* & Price*)

Note*: In applicable scenarios
Step 3 - Data Sources
Primary Research
- Web Analytics
- Survey Reports
- Research Institute
- Latest Research Reports
- Opinion Leaders
Secondary Research
- Annual Reports
- White Paper
- Latest Press Release
- Industry Association
- Paid Database
- Investor Presentations

Step 4 - Data Triangulation
Involves using different sources of information in order to increase the validity of a study
These sources are likely to be stakeholders in a program - participants, other researchers, program staff, other community members, and so on.
Then we put all data in single framework & apply various statistical tools to find out the dynamic on the market.
During the analysis stage, feedback from the stakeholder groups would be compared to determine areas of agreement as well as areas of divergence